| Param | Original file | Final file |
|---|---|---|
| Filename | modeM0/AS1T03_223T01_9000003850_26722cztM0_level2.evt | modeM0/AS1T03_223T01_9000003850_26722cztM0_level2_quad_clean.evt |
| Size (bytes) | 593,876,160 | 71,259,840 |
| Size | 566.4 MB | 68.0 MB |
| Events in quadrant A | 3,406,484 | 436,604 |
| Events in quadrant B | 5,114,653 | 441,918 |
| Events in quadrant C | 3,256,917 | 431,019 |
| Events in quadrant D | 5,783,801 | 411,468 |
| Mode M9 | |||
|---|---|---|---|
| Quadrant | BADHDUFLAG | Total packets | Discarded packets |
| A | 0 | 12 | 0 |
| B | 0 | 12 | 0 |
| C | 0 | 12 | 0 |
| D | 0 | 12 | 0 |
| Mode M0 | |||
|---|---|---|---|
| Quadrant | BADHDUFLAG | Total packets | Discarded packets |
| A | 0 | 13660 | 0 |
| B | 0 | 19010 | 0 |
| C | 0 | 13100 | 0 |
| D | 0 | 21426 | 0 |
| Quadrant | Total seconds | Saturated seconds | Saturation percentage |
|---|---|---|---|
| A | 6251 | 133 | 2.127660% |
| B | 6251 | 763 | 12.206047% |
| C | 6252 | 119 | 1.903391% |
| D | 6252 | 718 | 11.484325% |
Noise dominated data is calculated using 1-second bins in cleaned event files. If a bin has >2000 counts, and if more than 50% of those come from <1% of pixels, then it is considered to be noise-dominated and hence unusable.
| Quadrant | # 1 sec bins | Bins with >0 counts | Bins with >2000 counts | High rate bins dominated by noise | Noise dominated (total time) | Noise dominated (detector-on time) | Marked lightcurve |
|---|---|---|---|---|---|---|---|
| A | 7426 | 6251 | 34 | 34 | 0.46% | 0.54% | 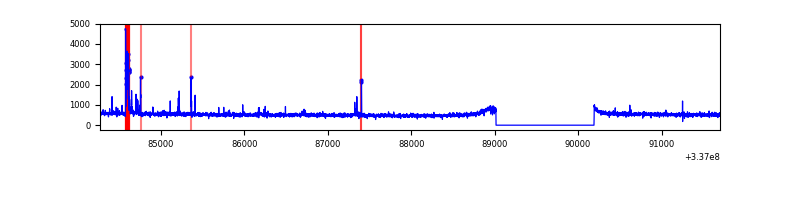 |
| B | 7426 | 6252 | 510 | 510 | 6.87% | 8.16% | 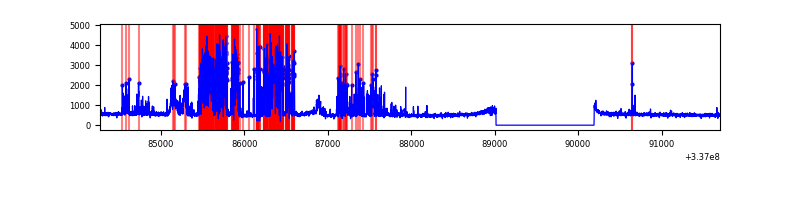 |
| C | 7427 | 6253 | 0 | 0 | 0.00% | 0.00% | 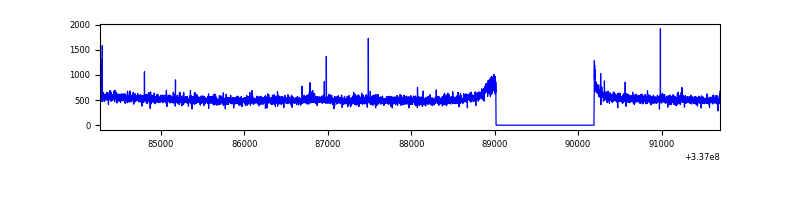 |
| D | 7427 | 6253 | 541 | 541 | 7.28% | 8.65% | 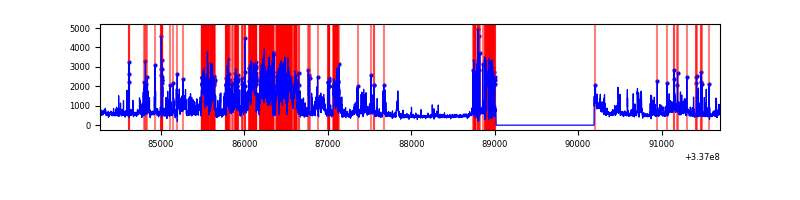 |
Top three noisy pixels from each quadrant. If the there are fewer than three noisy pixels in the level2.evt file, extra rows are filled as -1
| Pixel properties | Quadrant properties | ||||||
|---|---|---|---|---|---|---|---|
| Quadrant | DetID | PixID | Counts | Sigma | Mean | Median | Sigma |
| A | 0 | 13 | 173937 | 1043.95 | 837 | 822 | 165.8 |
| A | 13 | 254 | 10304 | 57.18 | 837 | 822 | 165.8 |
| A | 3 | 137 | 7351 | 39.37 | 837 | 822 | 165.8 |
| B | 0 | 189 | 1845490 | 12543.53 | 780 | 763 | 147.1 |
| B | 10 | 246 | 190695 | 1291.47 | 780 | 763 | 147.1 |
| B | 12 | 111 | 17442 | 113.41 | 780 | 763 | 147.1 |
| C | 14 | 238 | 127830 | 690.58 | 794 | 803 | 183.9 |
| C | 15 | 208 | 22535 | 118.15 | 794 | 803 | 183.9 |
| C | 6 | 80 | 5716 | 26.71 | 794 | 803 | 183.9 |
| D | 1 | 52 | 2128331 | 10219.91 | 776 | 761 | 208.2 |
| D | 2 | 250 | 334099 | 1601.21 | 776 | 761 | 208.2 |
| D | 7 | 80 | 275281 | 1318.67 | 776 | 761 | 208.2 |
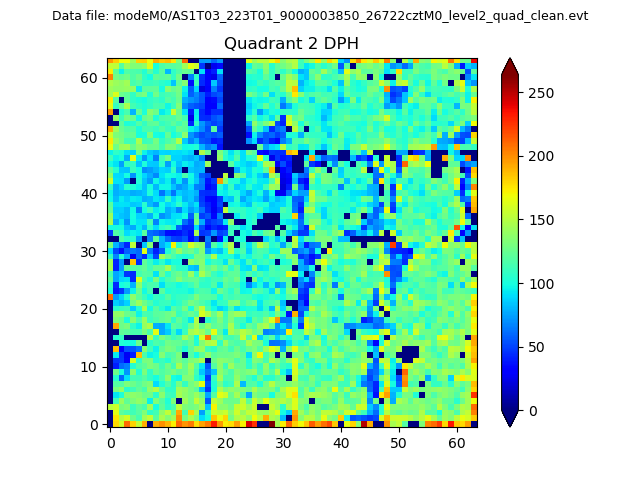
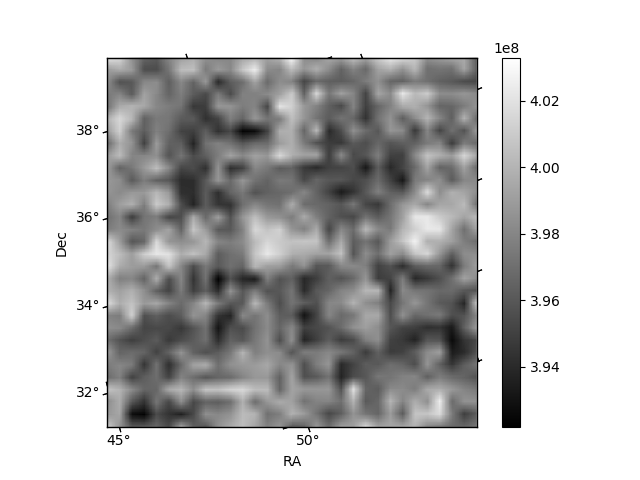
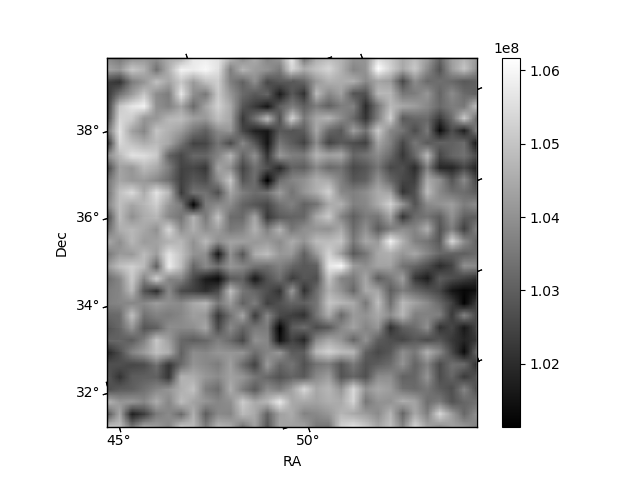
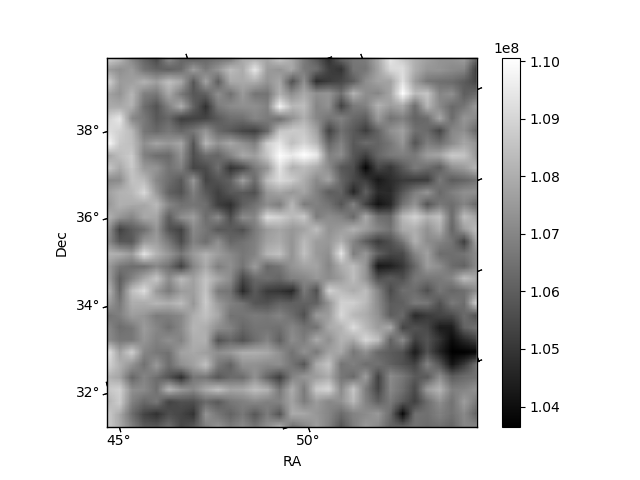
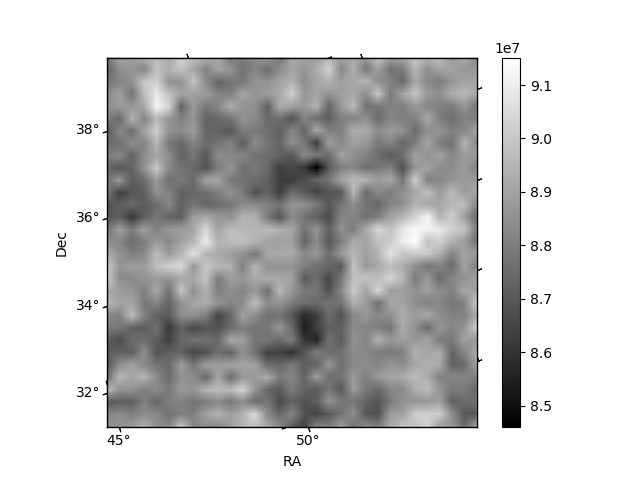
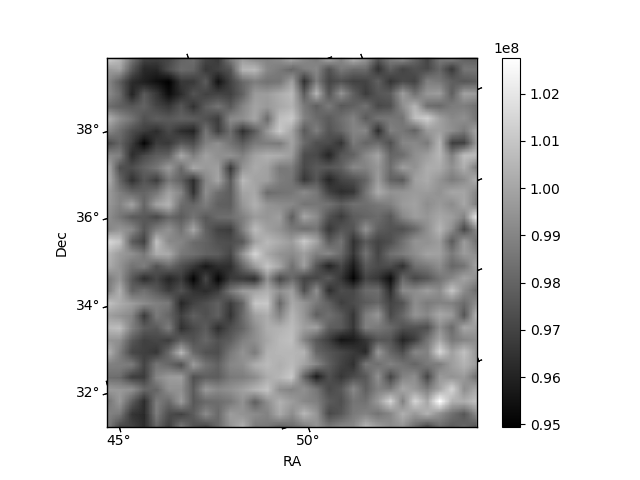
Histogram calculated using DETX and DETY for each event in the final _common_clean file
| Quadrant A | 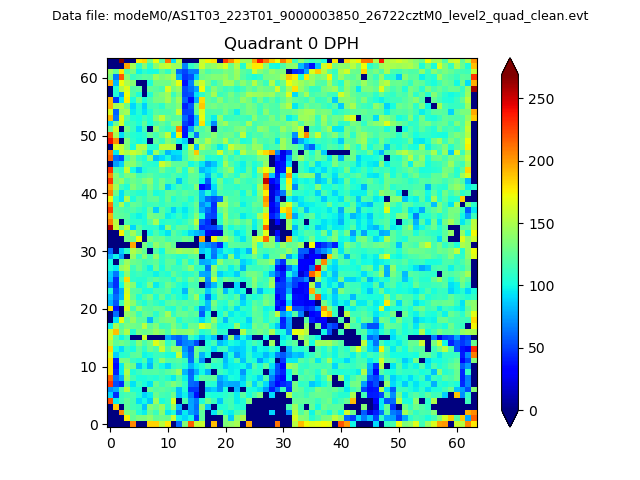 |
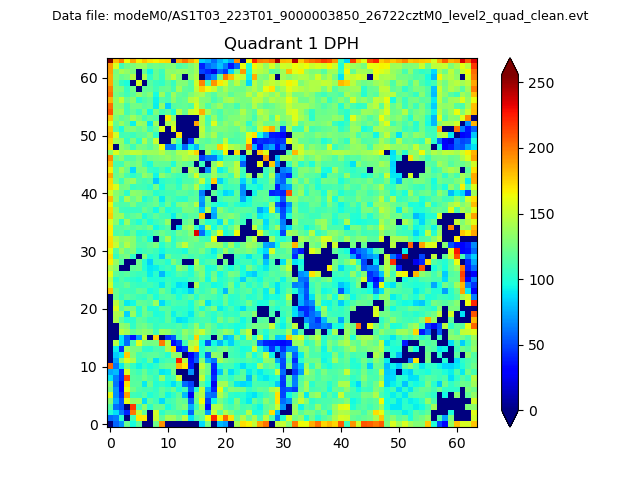 |
Quadrant B |
|---|---|---|---|
| Quadrant D | 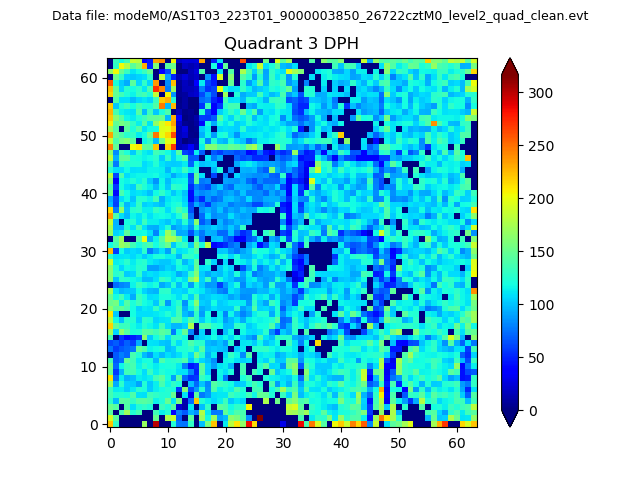 |
 |
Quadrant C |
| Plot type | Count rate plots | Images |
|---|---|---|
| Comparison with Poisson distribution Blue bars denote a histogram of data divided into 1 sec bins. Red curve is a Poisson curve with rate = median count rate of data. |
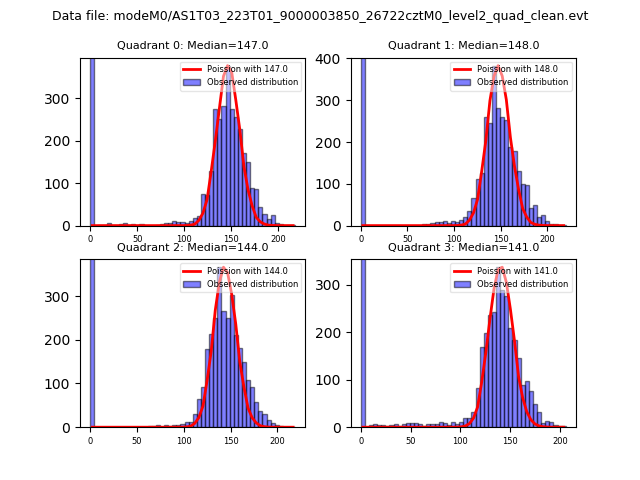 |
 |
| Quadrant-wise count rates Data is divided into 100 sec bins |
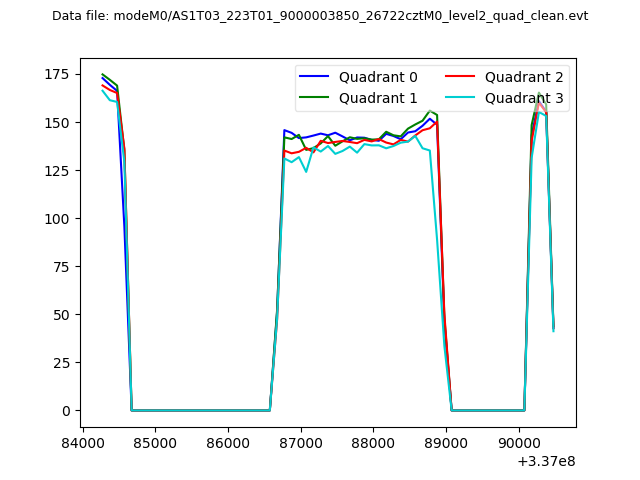 |
|
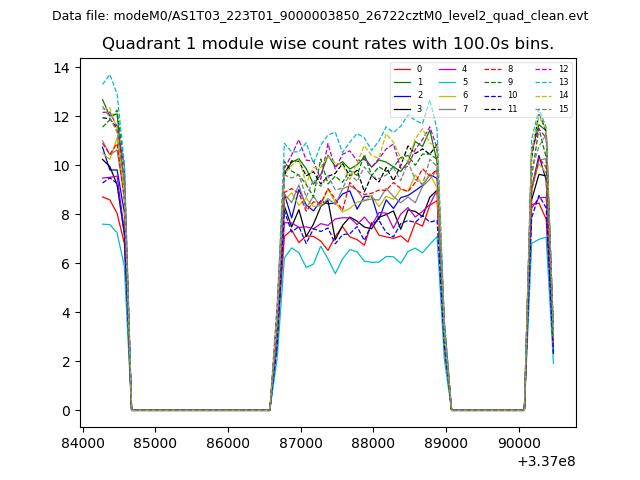
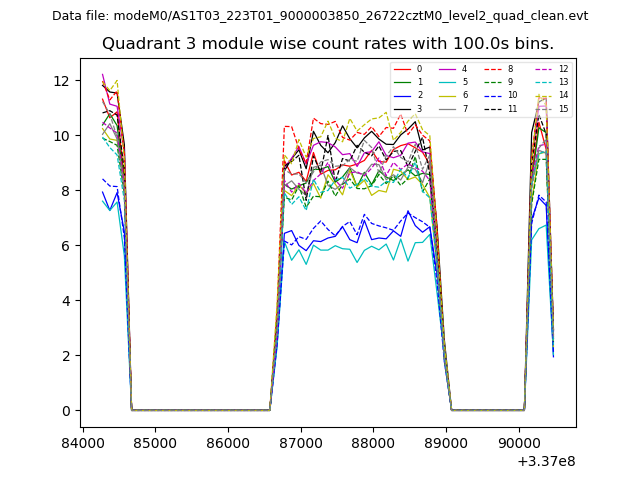
| Module-wise count rates for Quadrant A Data is divided into 100 sec bins |
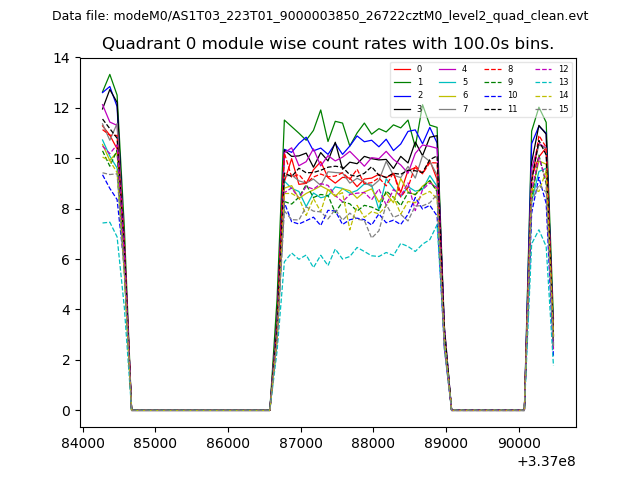 |
 |
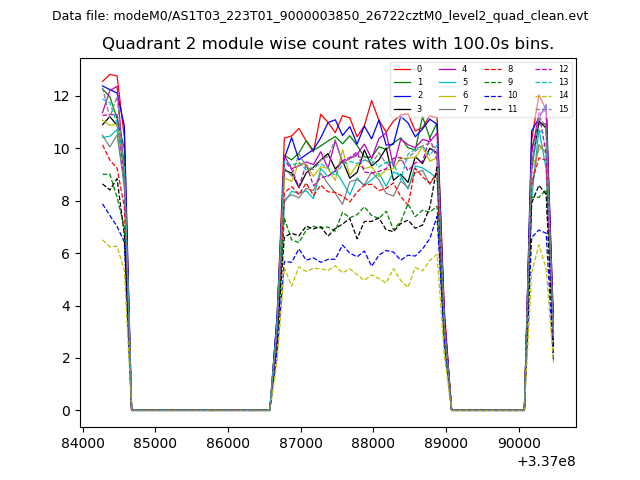
| Module-wise count rates for Quadrant B Data is divided into 100 sec bins |
 |
 |
| Module-wise count rates for Quadrant C Data is divided into 100 sec bins |
 |
 |
| Module-wise count rates for Quadrant D Data is divided into 100 sec bins |
 |
 |
| Parameter | Plot |
|---|---|
| CZT HV Monitor | 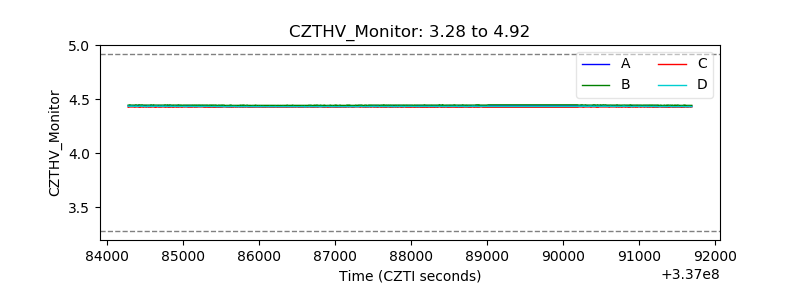 |
| D_VDD | 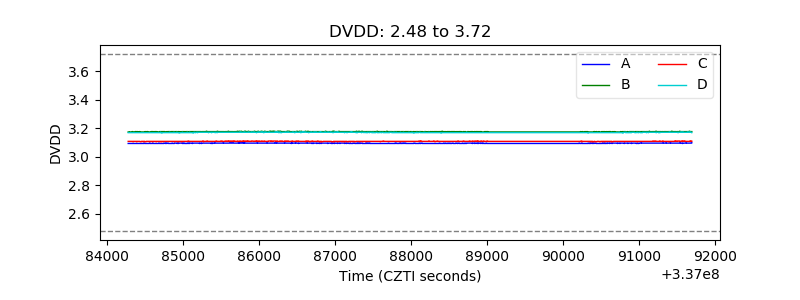 |
| Temperature 1 | 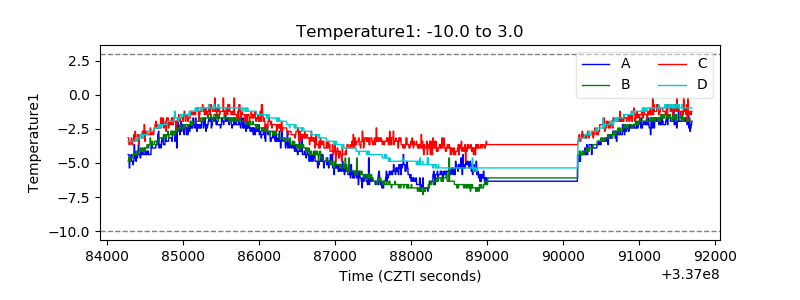 |
| Veto HV Monitor | 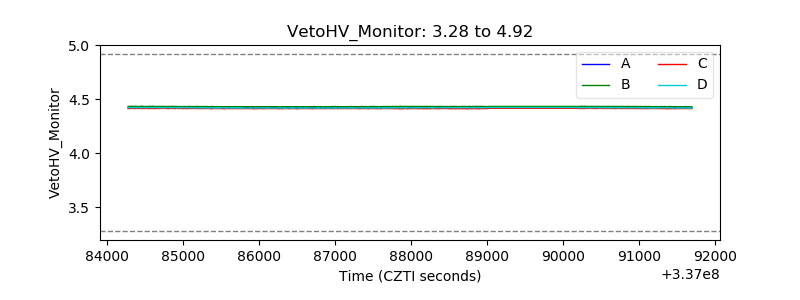 |
| Veto LLD | 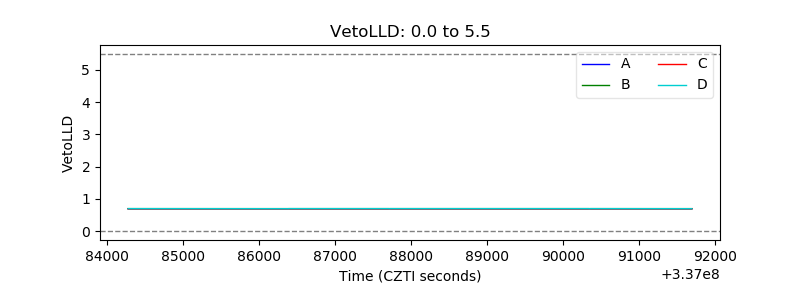 |
| Alpha Counter | 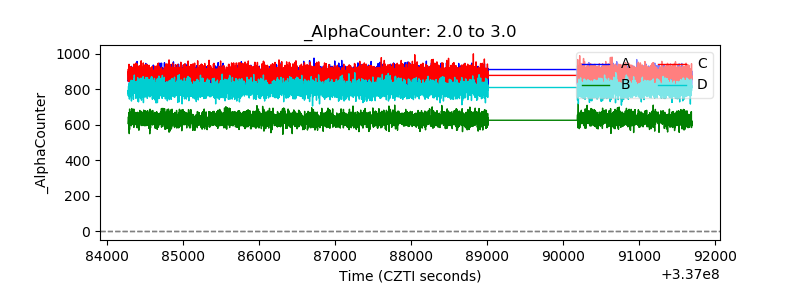 |
| _CPM_Rate | 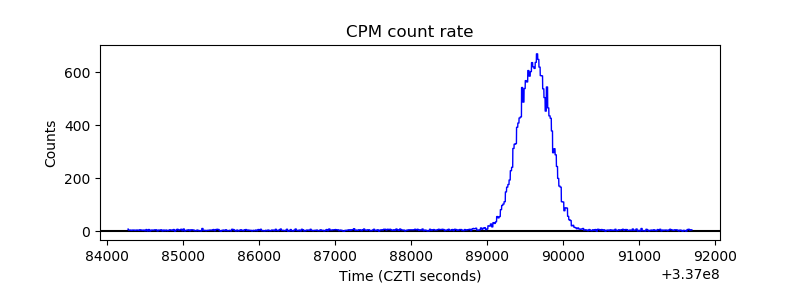 |
| CZT Counter | 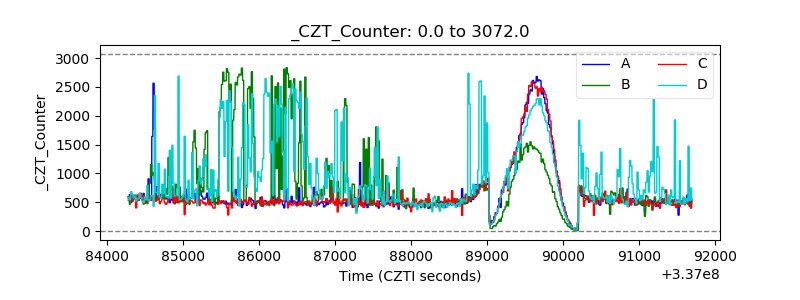 |
| +2.5 Volts monitor | 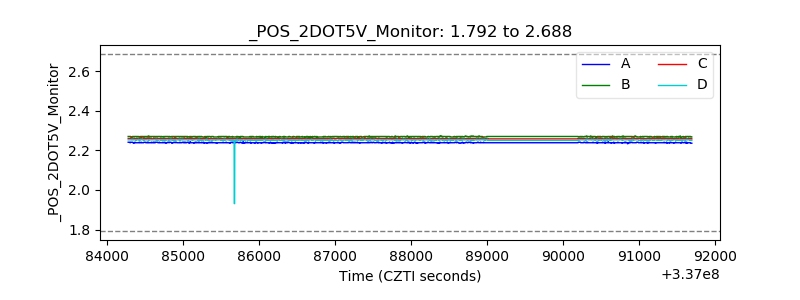 |
| +5 Volts monitor |  |
| _ROLL_ROT | 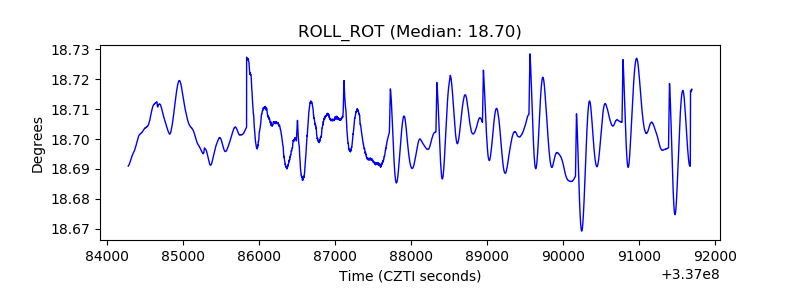 |
| _Roll_DEC | 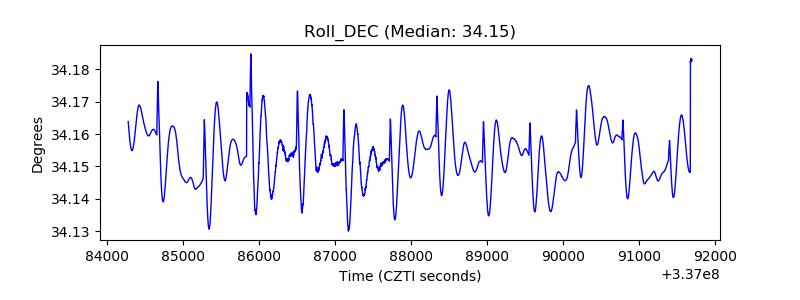 |
| _Roll_RA | 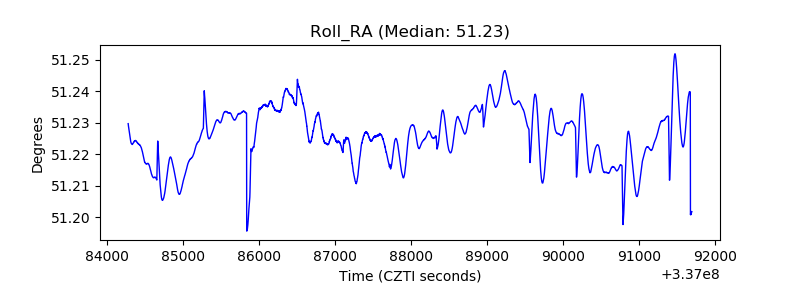 |
| Veto Counter | 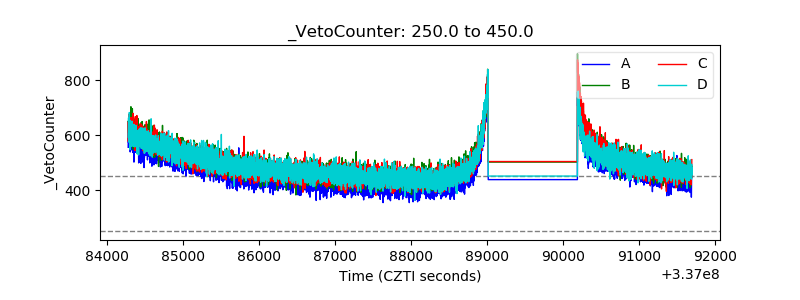 |