| Param | Original file | Final file |
|---|---|---|
| Filename | modeM0/AS1T03_223T01_9000003850_26723cztM0_level2.evt | modeM0/AS1T03_223T01_9000003850_26723cztM0_level2_quad_clean.evt |
| Size (bytes) | 625,512,960 | 71,867,520 |
| Size | 596.5 MB | 68.5 MB |
| Events in quadrant A | 3,662,470 | 452,283 |
| Events in quadrant B | 6,669,120 | 360,498 |
| Events in quadrant C | 3,510,684 | 443,571 |
| Events in quadrant D | 4,631,029 | 435,592 |
| Mode M9 | |||
|---|---|---|---|
| Quadrant | BADHDUFLAG | Total packets | Discarded packets |
| A | 0 | 11 | 0 |
| B | 0 | 12 | 0 |
| C | 0 | 12 | 0 |
| D | 0 | 12 | 0 |
| Mode M0 | |||
|---|---|---|---|
| Quadrant | BADHDUFLAG | Total packets | Discarded packets |
| A | 0 | 14974 | 0 |
| B | 0 | 24047 | 0 |
| C | 0 | 14473 | 0 |
| D | 0 | 18276 | 0 |
| Quadrant | Total seconds | Saturated seconds | Saturation percentage |
|---|---|---|---|
| A | 6942 | 114 | 1.642178% |
| B | 6942 | 1465 | 21.103428% |
| C | 6942 | 127 | 1.829444% |
| D | 6942 | 326 | 4.696053% |
Noise dominated data is calculated using 1-second bins in cleaned event files. If a bin has >2000 counts, and if more than 50% of those come from <1% of pixels, then it is considered to be noise-dominated and hence unusable.
| Quadrant | # 1 sec bins | Bins with >0 counts | Bins with >2000 counts | High rate bins dominated by noise | Noise dominated (total time) | Noise dominated (detector-on time) | Marked lightcurve |
|---|---|---|---|---|---|---|---|
| A | 7832 | 6943 | 20 | 20 | 0.26% | 0.29% | 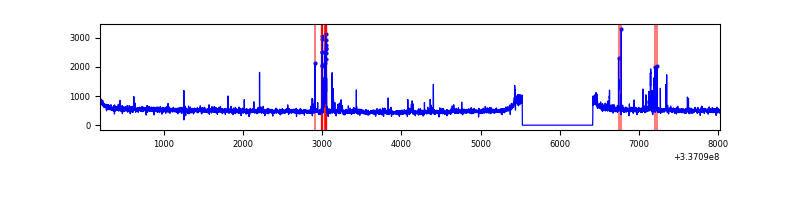 |
| B | 7832 | 6943 | 1219 | 1219 | 15.56% | 17.56% | 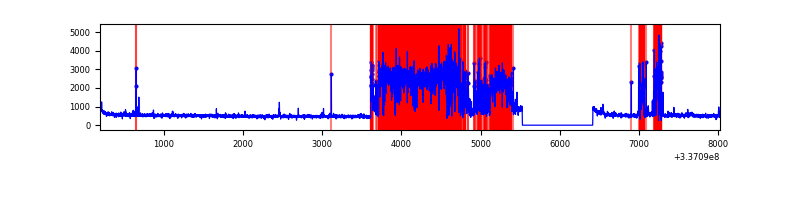 |
| C | 7832 | 6943 | 0 | 0 | 0.00% | 0.00% | 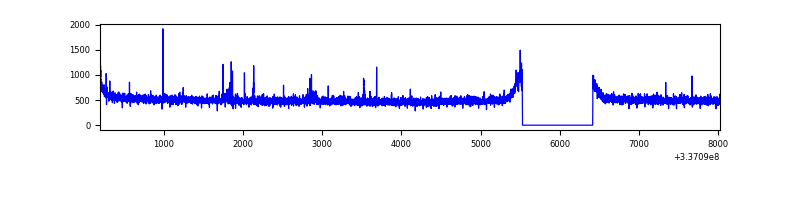 |
| D | 7832 | 6943 | 186 | 186 | 2.37% | 2.68% | 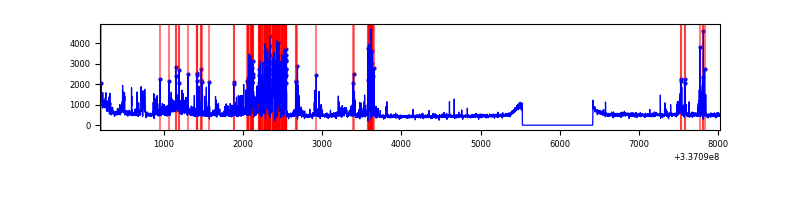 |
Top three noisy pixels from each quadrant. If the there are fewer than three noisy pixels in the level2.evt file, extra rows are filled as -1
| Pixel properties | Quadrant properties | ||||||
|---|---|---|---|---|---|---|---|
| Quadrant | DetID | PixID | Counts | Sigma | Mean | Median | Sigma |
| A | 0 | 13 | 190787 | 1051.05 | 900 | 881 | 180.7 |
| A | 13 | 254 | 12176 | 62.51 | 900 | 881 | 180.7 |
| A | 3 | 137 | 8237 | 40.71 | 900 | 881 | 180.7 |
| B | 0 | 189 | 3377966 | 22007.31 | 810 | 792 | 153.5 |
| B | 3 | 112 | 65877 | 424.13 | 810 | 792 | 153.5 |
| B | 10 | 246 | 38982 | 248.86 | 810 | 792 | 153.5 |
| C | 14 | 238 | 136233 | 677.92 | 854 | 861 | 199.7 |
| C | 15 | 208 | 33272 | 162.31 | 854 | 861 | 199.7 |
| C | 14 | 176 | 7914 | 35.32 | 854 | 861 | 199.7 |
| D | 2 | 250 | 444324 | 2102.37 | 863 | 838 | 210.9 |
| D | 7 | 80 | 429166 | 2030.51 | 863 | 838 | 210.9 |
| D | 1 | 52 | 412651 | 1952.22 | 863 | 838 | 210.9 |
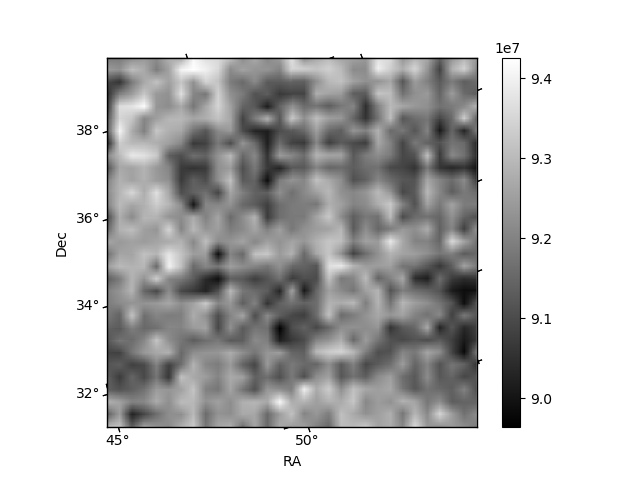
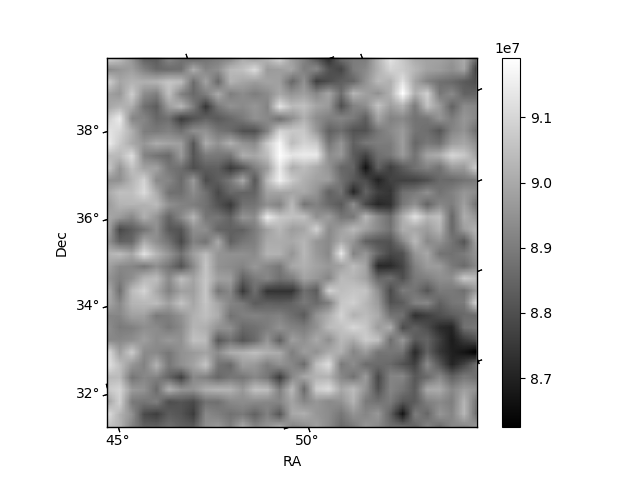
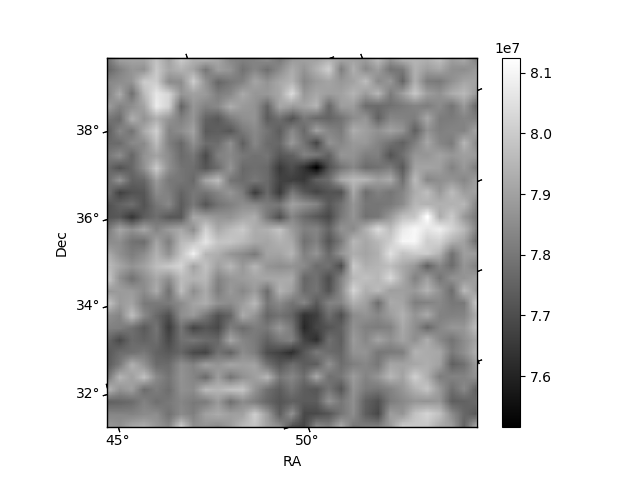
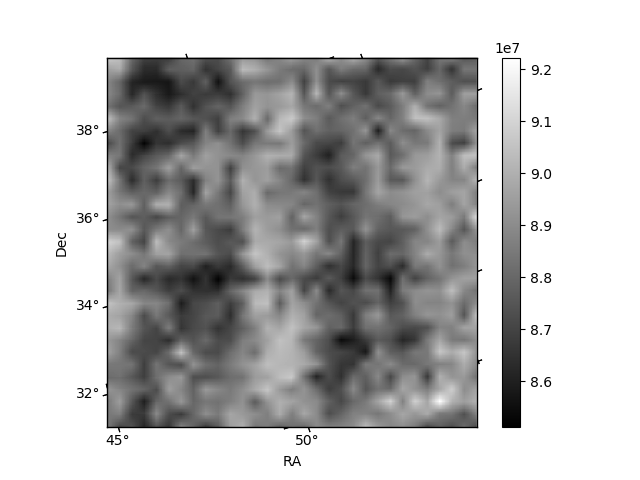
Histogram calculated using DETX and DETY for each event in the final _common_clean file
| Quadrant A | 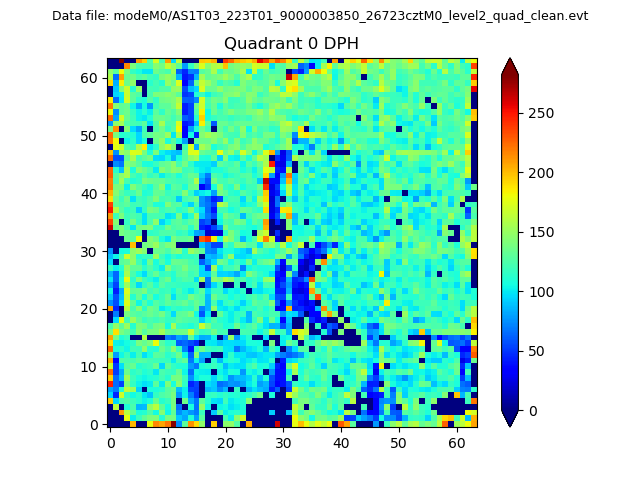 |
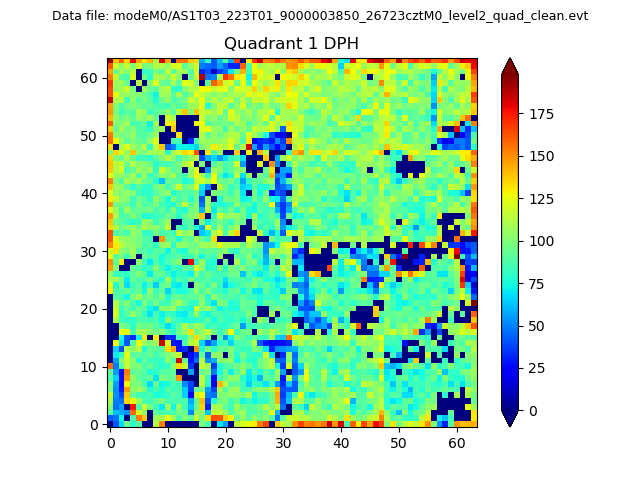 |
Quadrant B |
|---|---|---|---|
| Quadrant D | 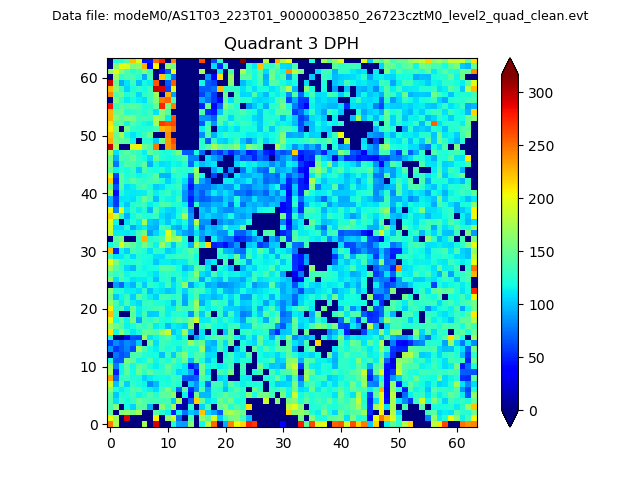 |
 |
Quadrant C |
| Plot type | Count rate plots | Images |
|---|---|---|
| Comparison with Poisson distribution Blue bars denote a histogram of data divided into 1 sec bins. Red curve is a Poisson curve with rate = median count rate of data. |
 |
 |
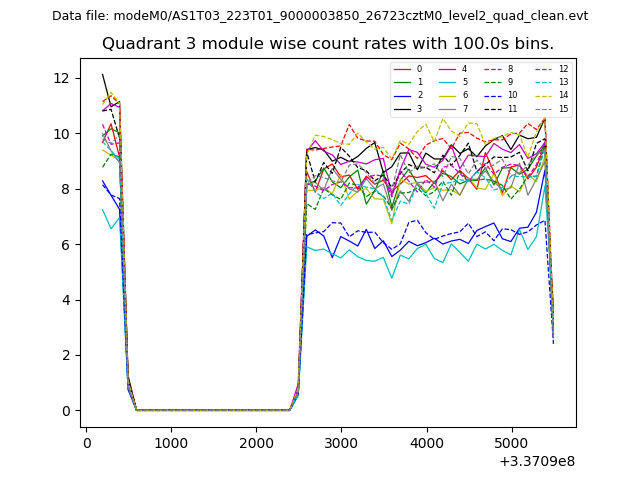
| Quadrant-wise count rates Data is divided into 100 sec bins |
 |
|
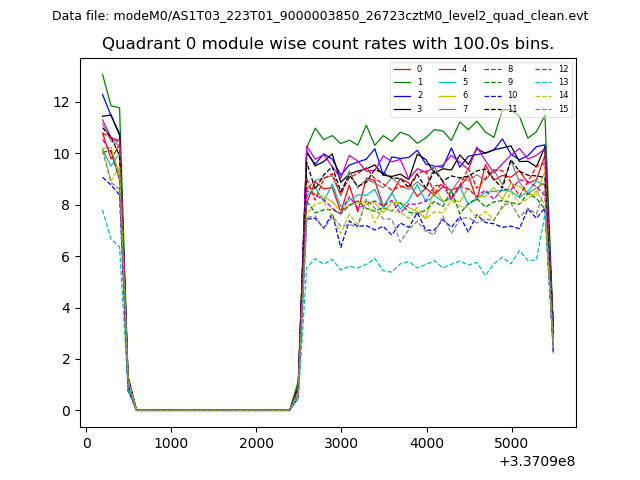
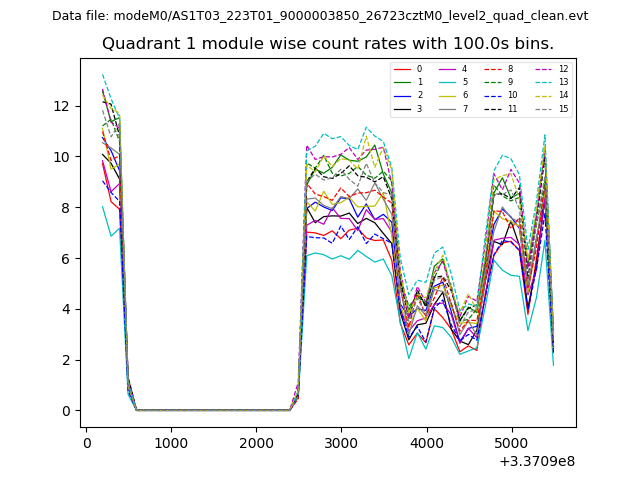
| Module-wise count rates for Quadrant A Data is divided into 100 sec bins |
 |
 |
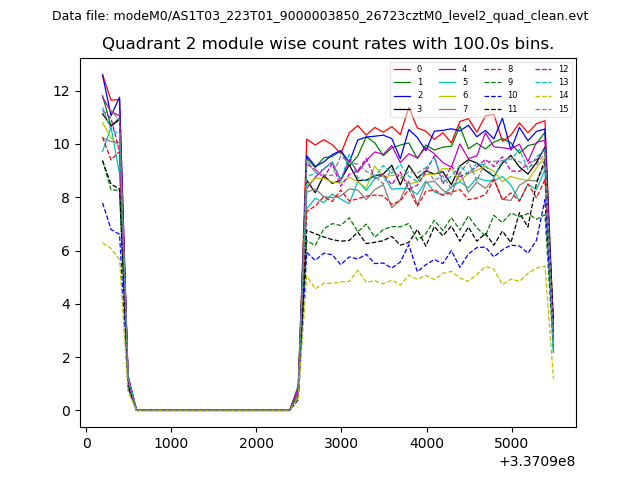
| Module-wise count rates for Quadrant B Data is divided into 100 sec bins |
 |
 |
| Module-wise count rates for Quadrant C Data is divided into 100 sec bins |
 |
 |
| Module-wise count rates for Quadrant D Data is divided into 100 sec bins |
 |
 |
| Parameter | Plot |
|---|---|
| CZT HV Monitor | 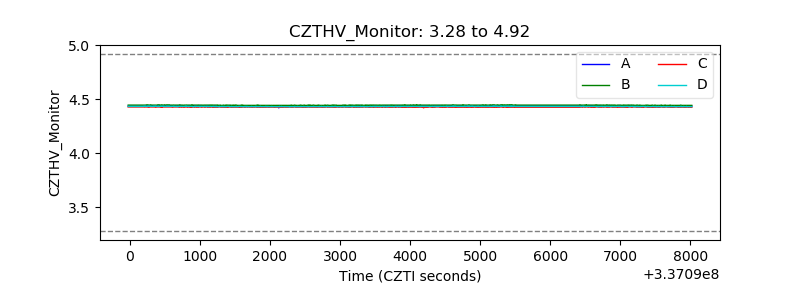 |
| D_VDD | 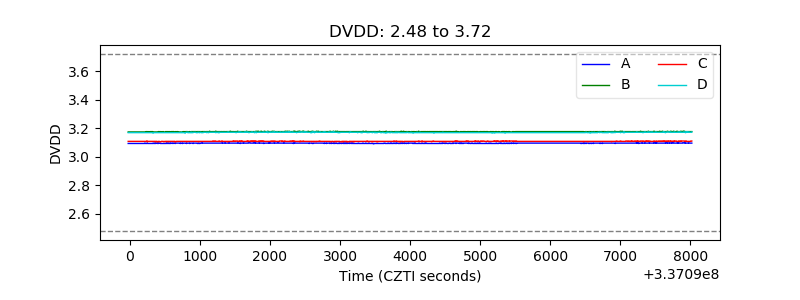 |
| Temperature 1 | 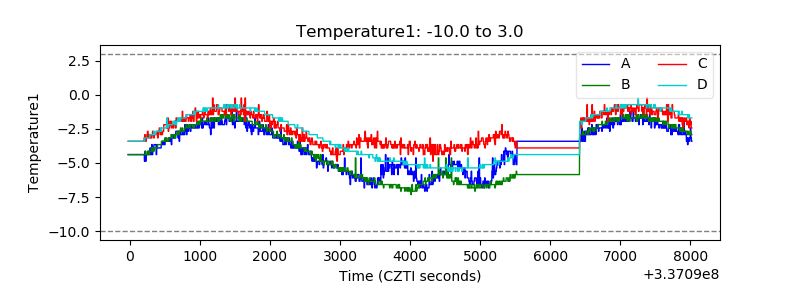 |
| Veto HV Monitor | 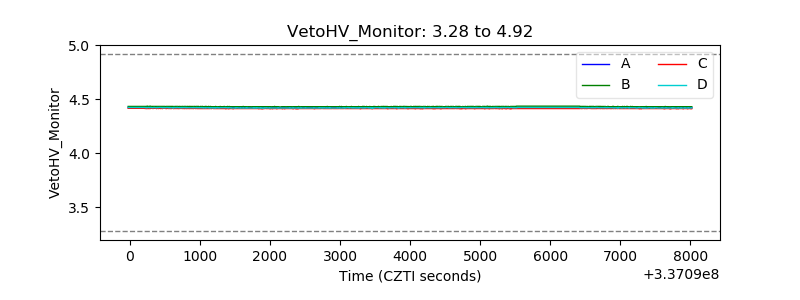 |
| Veto LLD | 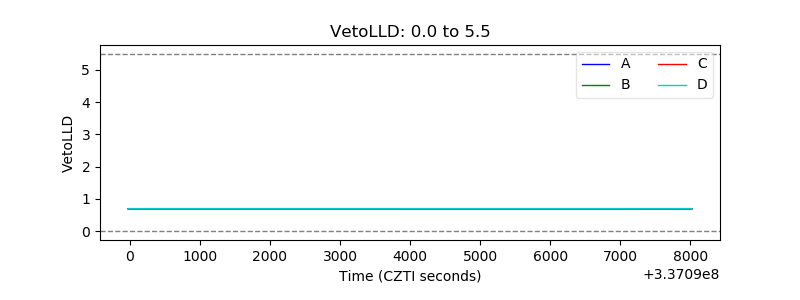 |
| Alpha Counter |  |
| _CPM_Rate | 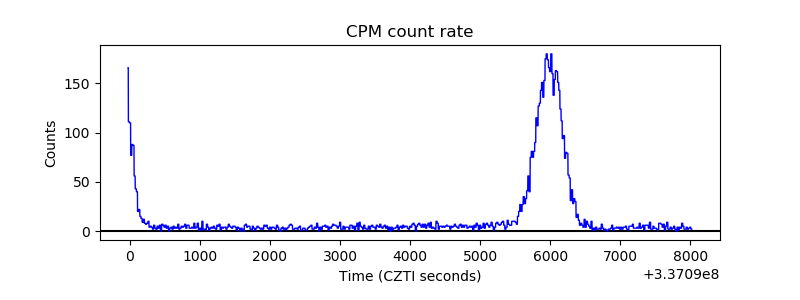 |
| CZT Counter | 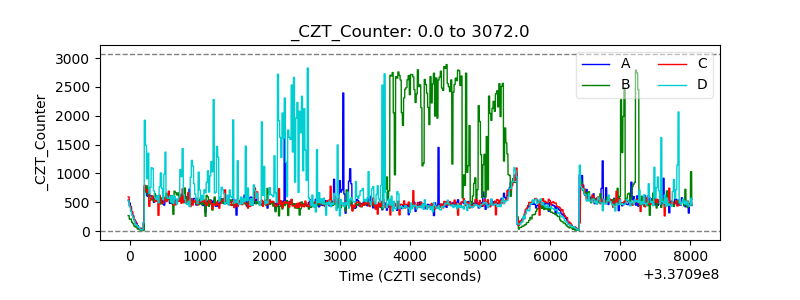 |
| +2.5 Volts monitor |  |
| +5 Volts monitor |  |
| _ROLL_ROT | 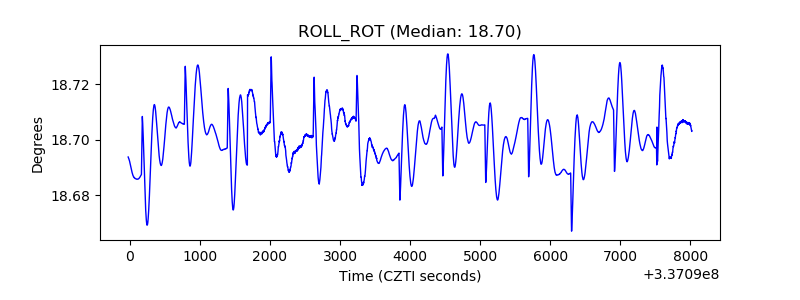 |
| _Roll_DEC | 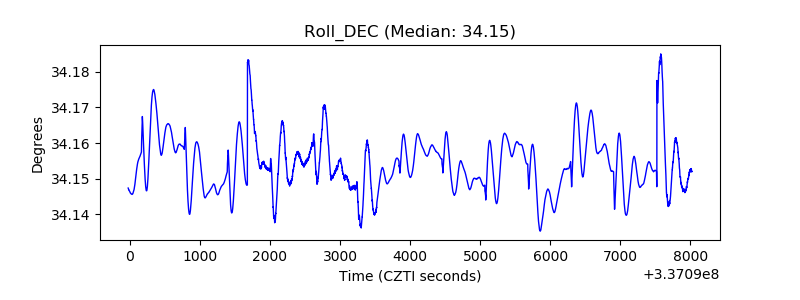 |
| _Roll_RA |  |
| Veto Counter | 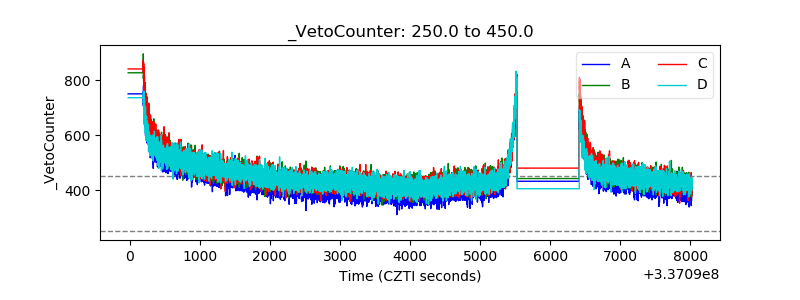 |