| Param | Original file | Final file |
|---|---|---|
| Filename | modeM0/AS1T03_223T01_9000003850_26724cztM0_level2.evt | modeM0/AS1T03_223T01_9000003850_26724cztM0_level2_quad_clean.evt |
| Size (bytes) | 521,435,520 | 79,462,080 |
| Size | 497.3 MB | 75.8 MB |
| Events in quadrant A | 3,995,071 | 481,836 |
| Events in quadrant B | 3,852,124 | 487,843 |
| Events in quadrant C | 3,524,892 | 473,592 |
| Events in quadrant D | 3,933,710 | 464,286 |
| Mode M9 | |||
|---|---|---|---|
| Quadrant | BADHDUFLAG | Total packets | Discarded packets |
| A | 0 | 5 | 0 |
| B | 0 | 5 | 0 |
| C | 0 | 5 | 0 |
| D | 0 | 5 | 0 |
| Mode M0 | |||
|---|---|---|---|
| Quadrant | BADHDUFLAG | Total packets | Discarded packets |
| A | 0 | 16389 | 0 |
| B | 0 | 15784 | 0 |
| C | 0 | 14826 | 0 |
| D | 0 | 16300 | 0 |
| Quadrant | Total seconds | Saturated seconds | Saturation percentage |
|---|---|---|---|
| A | 7156 | 158 | 2.207937% |
| B | 7157 | 170 | 2.375297% |
| C | 7157 | 102 | 1.425178% |
| D | 7156 | 87 | 1.215763% |
Noise dominated data is calculated using 1-second bins in cleaned event files. If a bin has >2000 counts, and if more than 50% of those come from <1% of pixels, then it is considered to be noise-dominated and hence unusable.
| Quadrant | # 1 sec bins | Bins with >0 counts | Bins with >2000 counts | High rate bins dominated by noise | Noise dominated (total time) | Noise dominated (detector-on time) | Marked lightcurve |
|---|---|---|---|---|---|---|---|
| A | 7701 | 7157 | 74 | 74 | 0.96% | 1.03% | 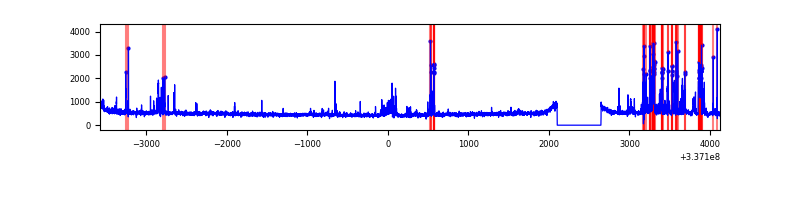 |
| B | 7702 | 7158 | 87 | 87 | 1.13% | 1.22% | 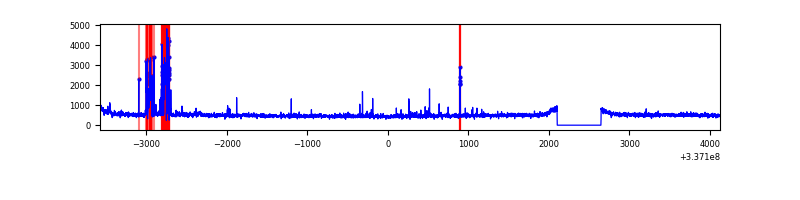 |
| C | 7702 | 7158 | 1 | 1 | 0.01% | 0.01% | 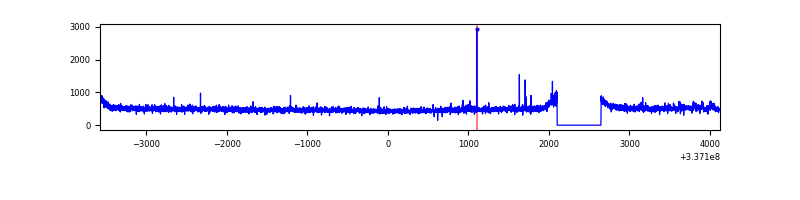 |
| D | 7701 | 7157 | 27 | 27 | 0.35% | 0.38% | 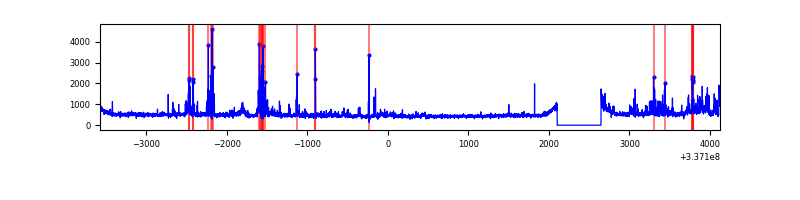 |
Top three noisy pixels from each quadrant. If the there are fewer than three noisy pixels in the level2.evt file, extra rows are filled as -1
| Pixel properties | Quadrant properties | ||||||
|---|---|---|---|---|---|---|---|
| Quadrant | DetID | PixID | Counts | Sigma | Mean | Median | Sigma |
| A | 0 | 13 | 537842 | 2965.3 | 895 | 874 | 181.1 |
| A | 13 | 254 | 11773 | 60.19 | 895 | 874 | 181.1 |
| A | 3 | 137 | 8328 | 41.16 | 895 | 874 | 181.1 |
| B | 0 | 189 | 278393 | 1638.31 | 884 | 861 | 169.4 |
| B | 3 | 112 | 65856 | 383.68 | 884 | 861 | 169.4 |
| B | 10 | 246 | 42704 | 247.01 | 884 | 861 | 169.4 |
| C | 14 | 238 | 135125 | 666.24 | 856 | 861 | 201.5 |
| C | 3 | 233 | 30122 | 145.2 | 856 | 861 | 201.5 |
| C | 15 | 208 | 19792 | 93.94 | 856 | 861 | 201.5 |
| D | 12 | 227 | 261410 | 1234.67 | 871 | 844 | 211.0 |
| D | 2 | 250 | 213455 | 1007.44 | 871 | 844 | 211.0 |
| D | 1 | 52 | 109030 | 512.63 | 871 | 844 | 211.0 |
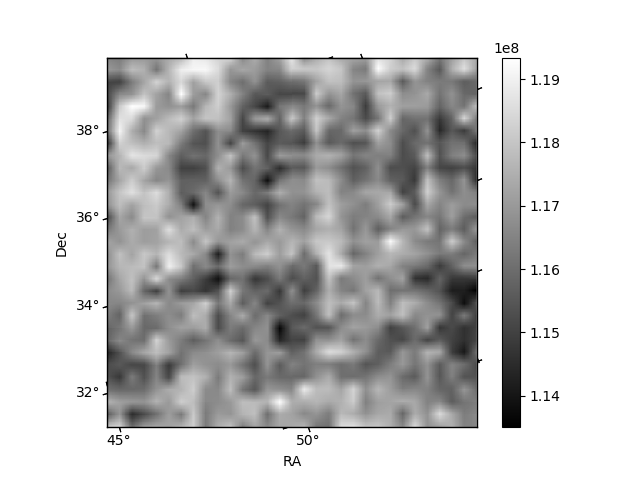
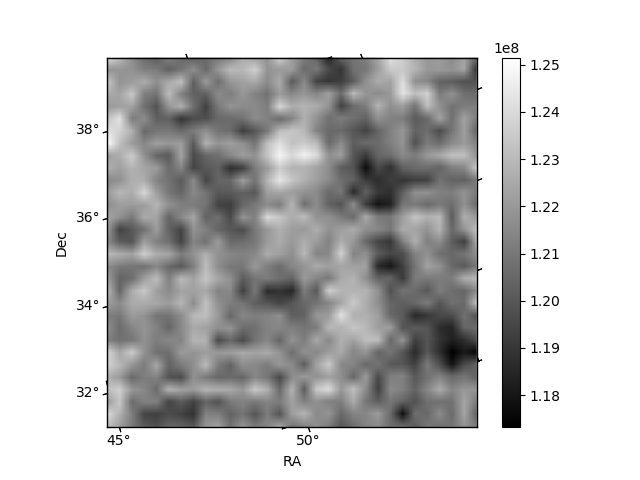
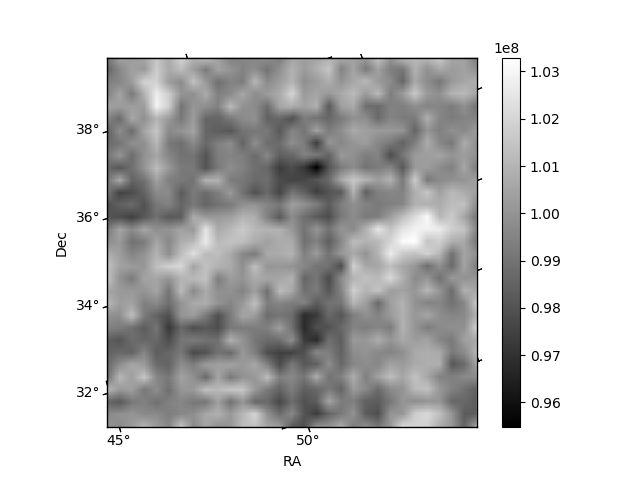
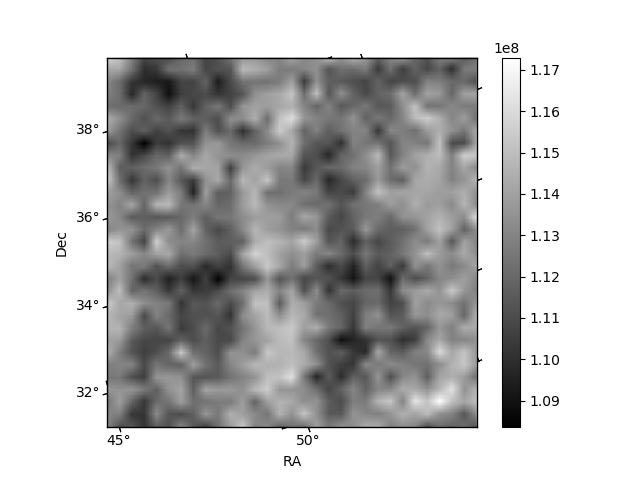
Histogram calculated using DETX and DETY for each event in the final _common_clean file
| Quadrant A | 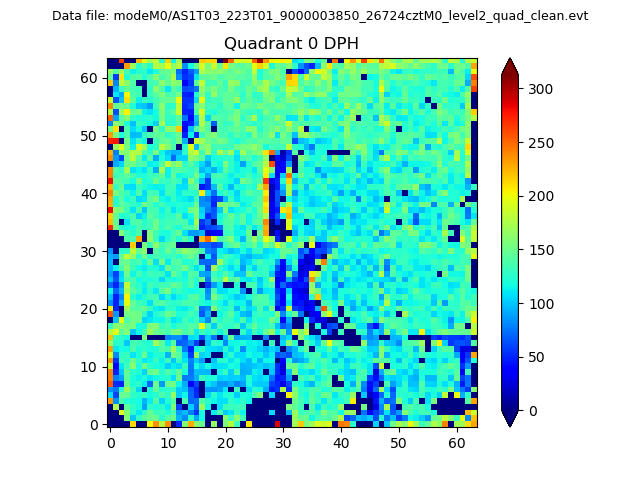 |
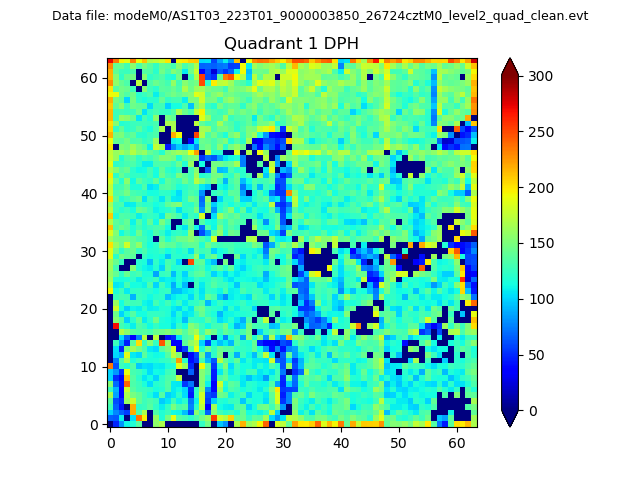 |
Quadrant B |
|---|---|---|---|
| Quadrant D | 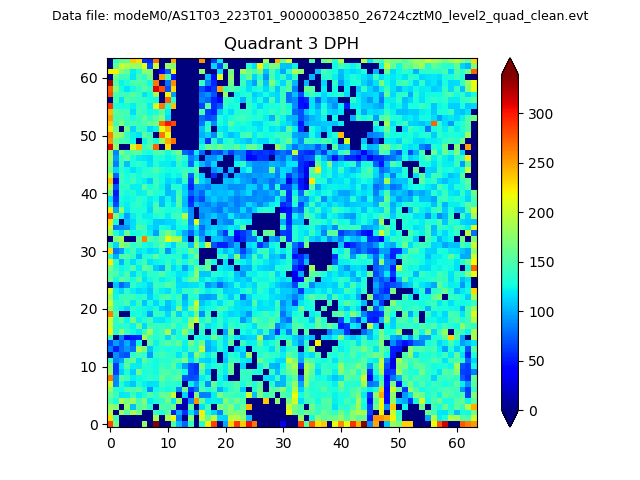 |
 |
Quadrant C |
| Plot type | Count rate plots | Images |
|---|---|---|
| Comparison with Poisson distribution Blue bars denote a histogram of data divided into 1 sec bins. Red curve is a Poisson curve with rate = median count rate of data. |
 |
 |
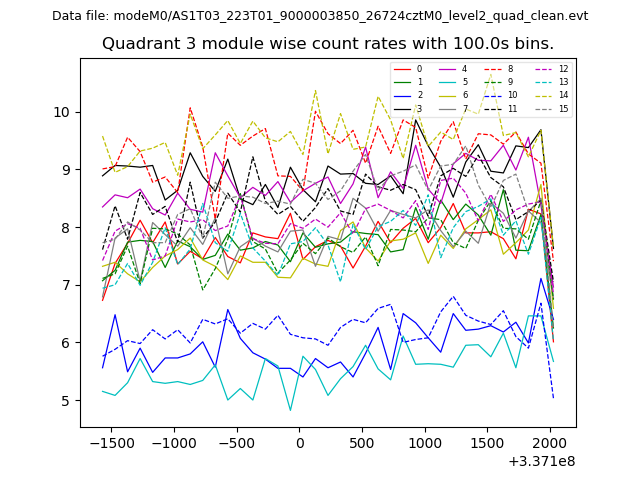
| Quadrant-wise count rates Data is divided into 100 sec bins |
 |
|
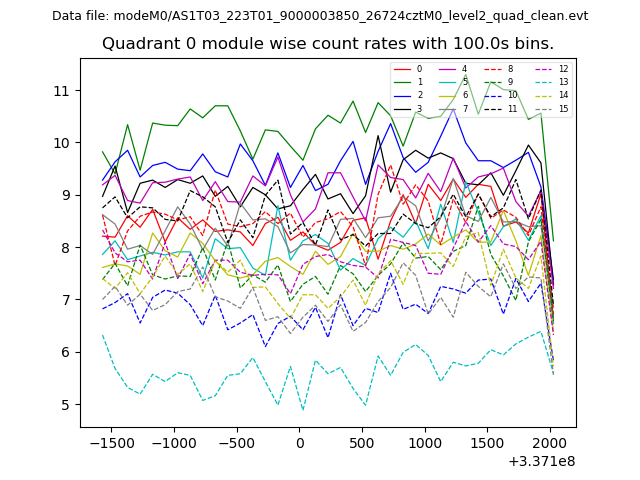
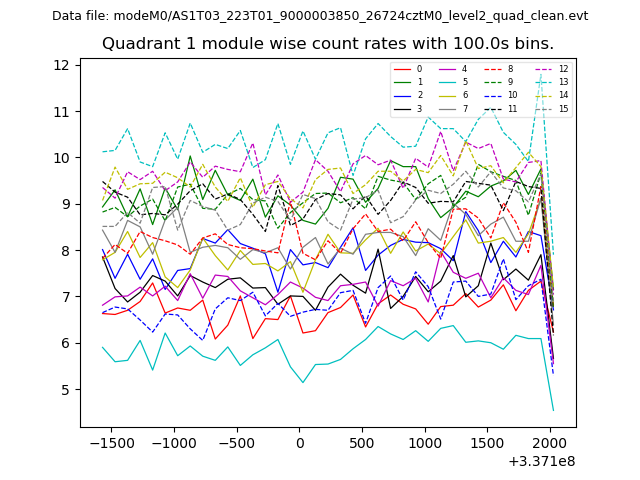
| Module-wise count rates for Quadrant A Data is divided into 100 sec bins |
 |
 |
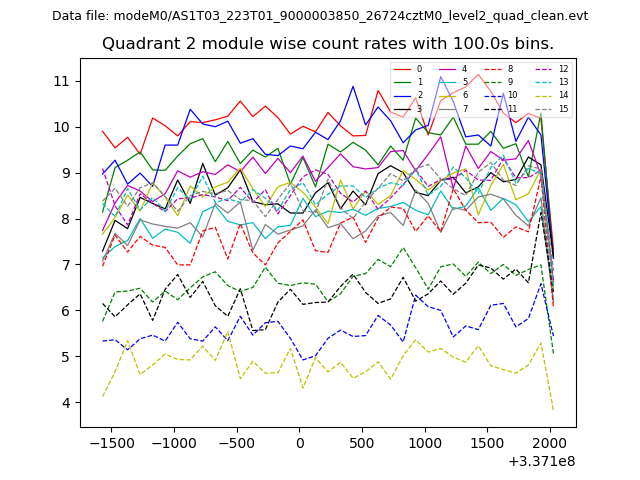
| Module-wise count rates for Quadrant B Data is divided into 100 sec bins |
 |
 |
| Module-wise count rates for Quadrant C Data is divided into 100 sec bins |
 |
 |
| Module-wise count rates for Quadrant D Data is divided into 100 sec bins |
 |
 |
| Parameter | Plot |
|---|---|
| CZT HV Monitor | 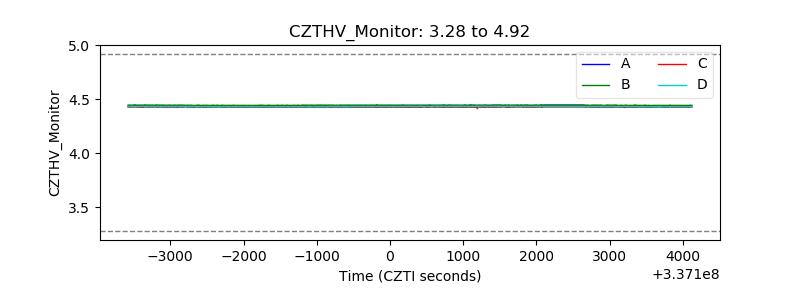 |
| D_VDD | 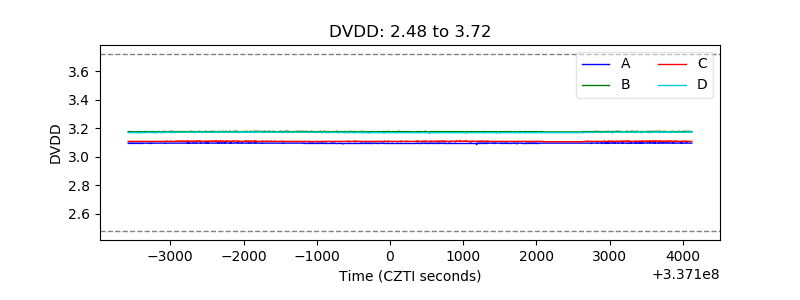 |
| Temperature 1 | 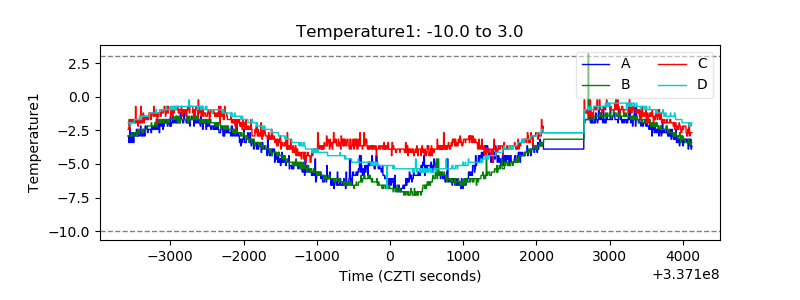 |
| Veto HV Monitor | 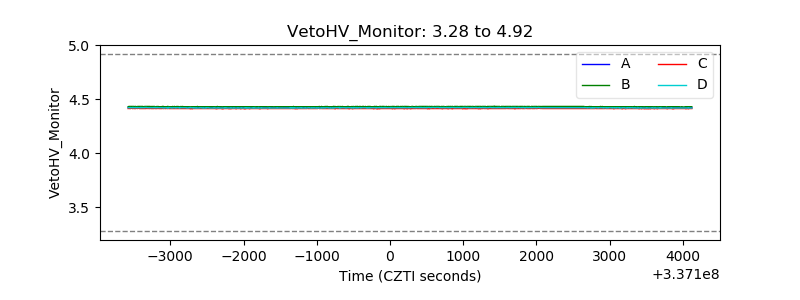 |
| Veto LLD | 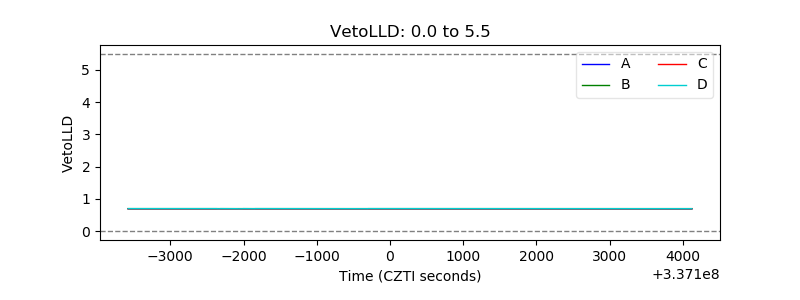 |
| Alpha Counter |  |
| _CPM_Rate | 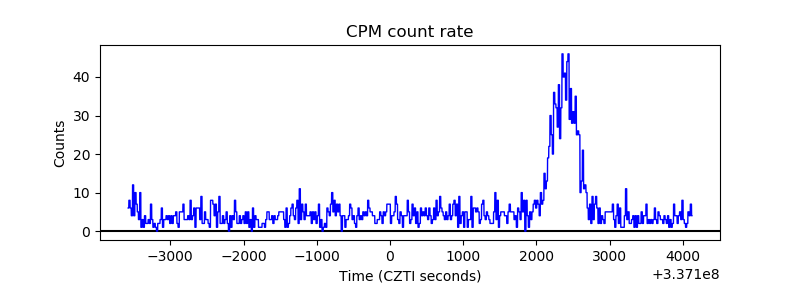 |
| CZT Counter | 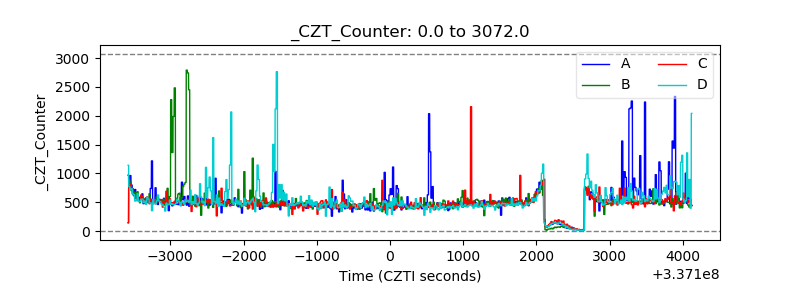 |
| +2.5 Volts monitor |  |
| +5 Volts monitor |  |
| _ROLL_ROT | 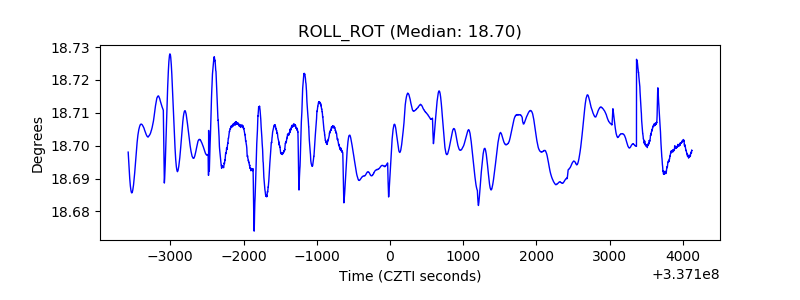 |
| _Roll_DEC | 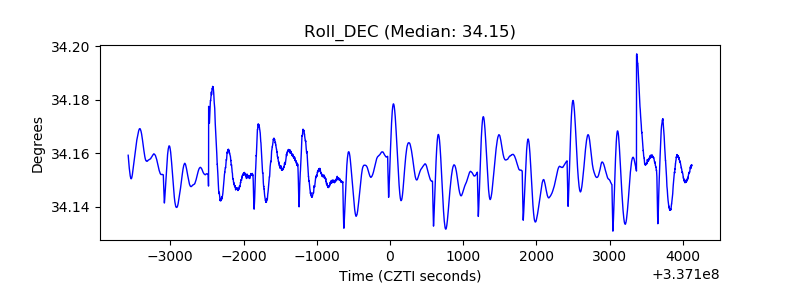 |
| _Roll_RA |  |
| Veto Counter | 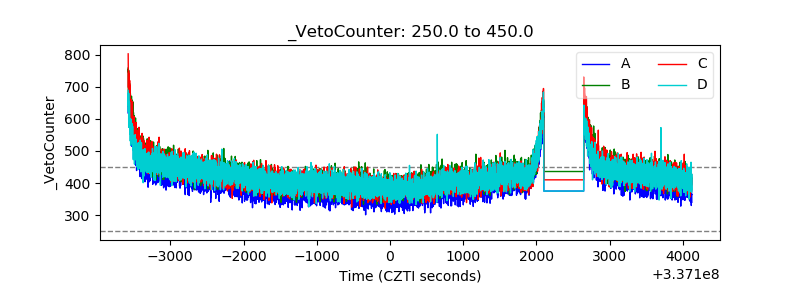 |