| Param | Original file | Final file |
|---|---|---|
| Filename | modeM0/AS1T03_223T01_9000003850_26725cztM0_level2.evt | modeM0/AS1T03_223T01_9000003850_26725cztM0_level2_quad_clean.evt |
| Size (bytes) | 595,952,640 | 84,070,080 |
| Size | 568.3 MB | 80.2 MB |
| Events in quadrant A | 4,054,493 | 517,501 |
| Events in quadrant B | 3,951,391 | 522,260 |
| Events in quadrant C | 3,785,019 | 507,212 |
| Events in quadrant D | 5,751,752 | 479,477 |
| Mode M9 | |||
|---|---|---|---|
| Quadrant | BADHDUFLAG | Total packets | Discarded packets |
| A | 0 | 7 | 0 |
| B | 0 | 8 | 0 |
| C | 0 | 8 | 0 |
| D | 0 | 8 | 0 |
| Mode M0 | |||
|---|---|---|---|
| Quadrant | BADHDUFLAG | Total packets | Discarded packets |
| A | 0 | 16859 | 0 |
| B | 0 | 16412 | 0 |
| C | 0 | 15761 | 0 |
| D | 0 | 22102 | 0 |
| Quadrant | Total seconds | Saturated seconds | Saturation percentage |
|---|---|---|---|
| A | 7459 | 180 | 2.413192% |
| B | 7459 | 204 | 2.734951% |
| C | 7458 | 150 | 2.011263% |
| D | 7458 | 491 | 6.583534% |
Noise dominated data is calculated using 1-second bins in cleaned event files. If a bin has >2000 counts, and if more than 50% of those come from <1% of pixels, then it is considered to be noise-dominated and hence unusable.
| Quadrant | # 1 sec bins | Bins with >0 counts | Bins with >2000 counts | High rate bins dominated by noise | Noise dominated (total time) | Noise dominated (detector-on time) | Marked lightcurve |
|---|---|---|---|---|---|---|---|
| A | 7764 | 7460 | 67 | 67 | 0.86% | 0.90% | 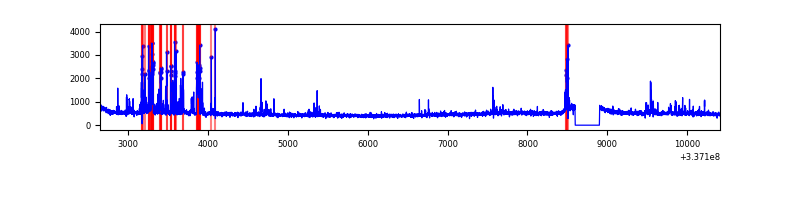 |
| B | 7764 | 7460 | 82 | 82 | 1.06% | 1.10% | 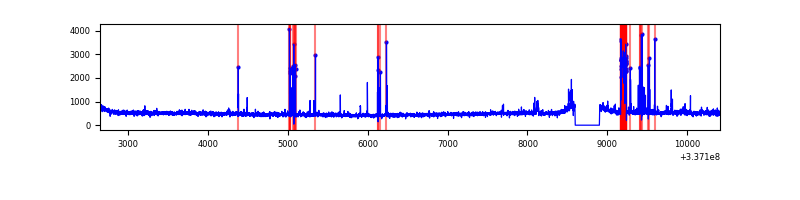 |
| C | 7763 | 7459 | 4 | 4 | 0.05% | 0.05% | 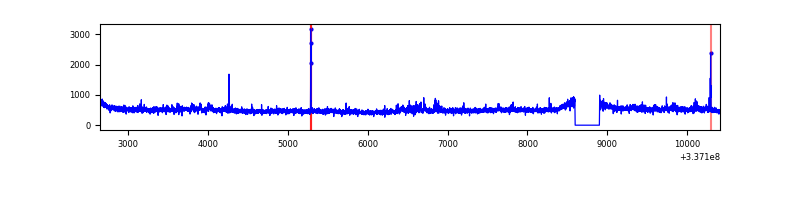 |
| D | 7763 | 7459 | 335 | 335 | 4.32% | 4.49% | 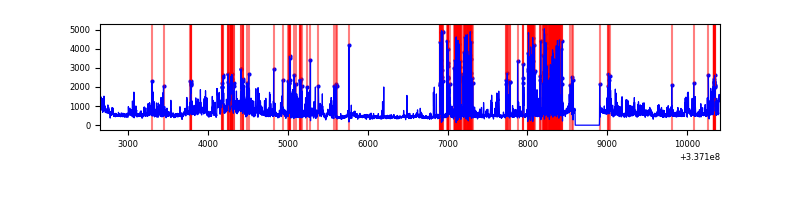 |
Top three noisy pixels from each quadrant. If the there are fewer than three noisy pixels in the level2.evt file, extra rows are filled as -1
| Pixel properties | Quadrant properties | ||||||
|---|---|---|---|---|---|---|---|
| Quadrant | DetID | PixID | Counts | Sigma | Mean | Median | Sigma |
| A | 0 | 13 | 469045 | 2492.62 | 924 | 902 | 187.8 |
| A | 11 | 29 | 18436 | 93.36 | 924 | 902 | 187.8 |
| A | 13 | 254 | 11295 | 55.34 | 924 | 902 | 187.8 |
| B | 0 | 189 | 239244 | 1365.16 | 912 | 890 | 174.6 |
| B | 3 | 112 | 66750 | 377.21 | 912 | 890 | 174.6 |
| B | 10 | 246 | 47919 | 269.36 | 912 | 890 | 174.6 |
| C | 3 | 233 | 157551 | 750.87 | 886 | 890 | 208.6 |
| C | 14 | 238 | 140371 | 668.53 | 886 | 890 | 208.6 |
| C | 15 | 208 | 30034 | 139.69 | 886 | 890 | 208.6 |
| D | 1 | 52 | 1755641 | 8180.93 | 877 | 851 | 214.5 |
| D | 12 | 227 | 388743 | 1808.37 | 877 | 851 | 214.5 |
| D | 2 | 250 | 152906 | 708.89 | 877 | 851 | 214.5 |
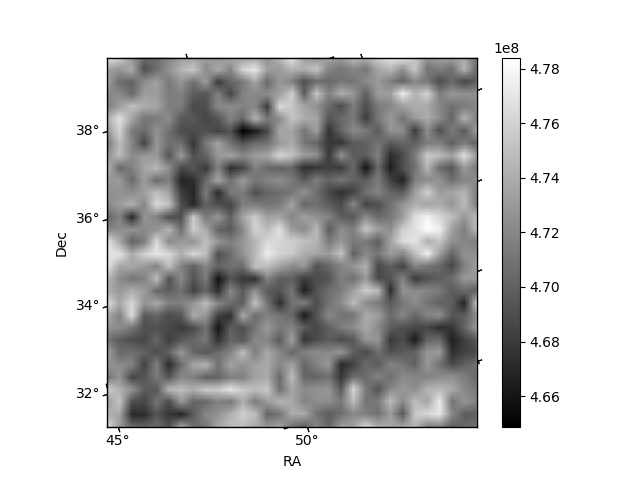
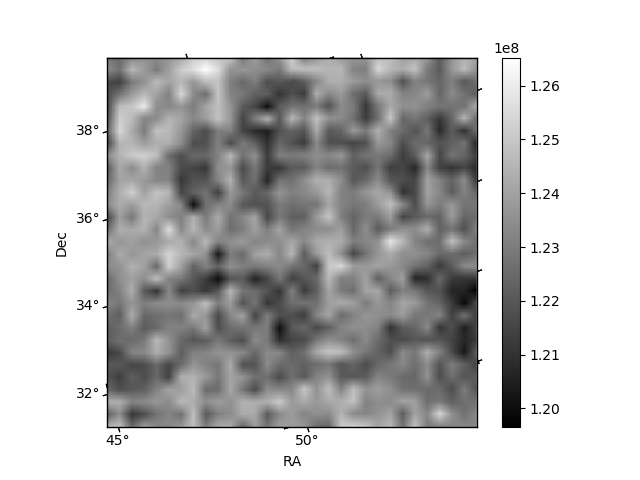
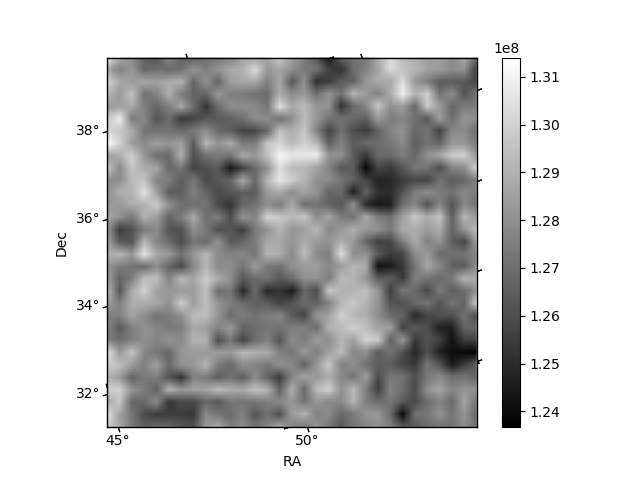
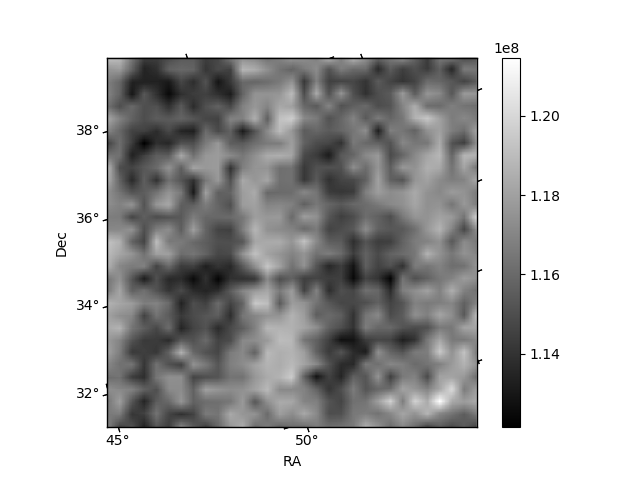
Histogram calculated using DETX and DETY for each event in the final _common_clean file
| Quadrant A | 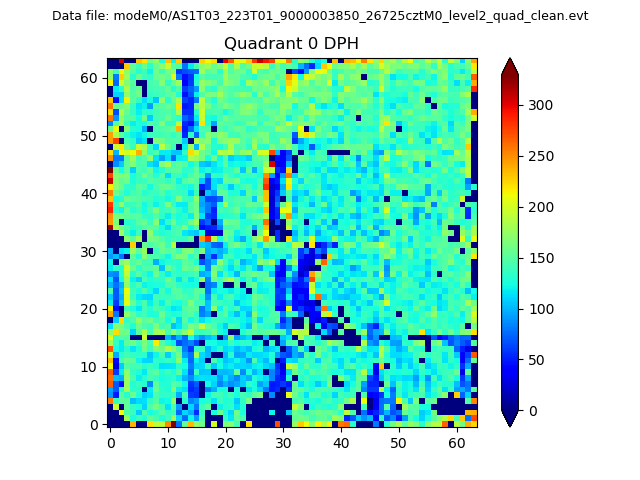 |
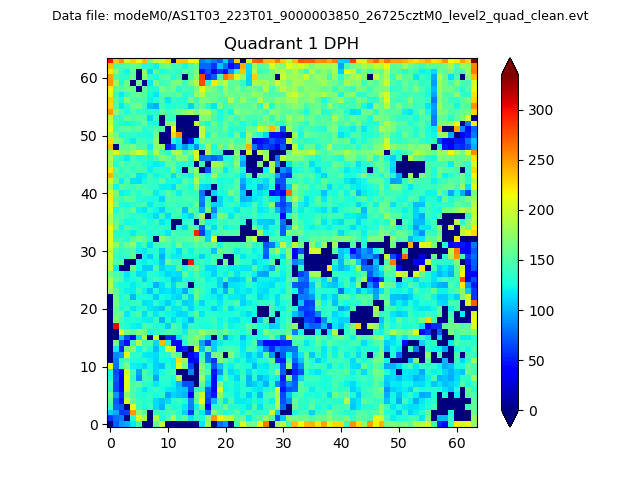 |
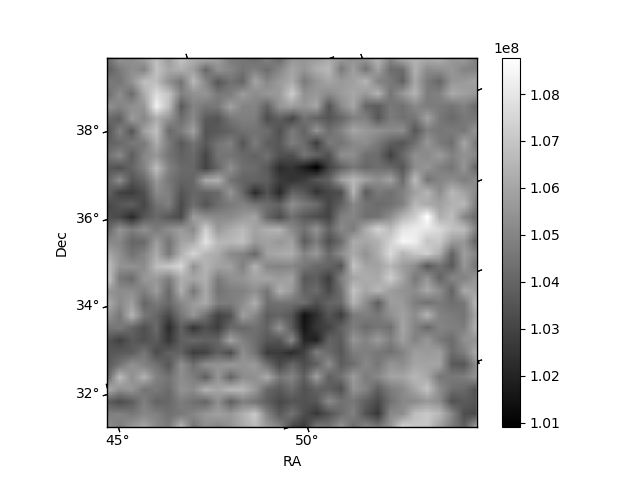
Quadrant B |
|---|---|---|---|
| Quadrant D | 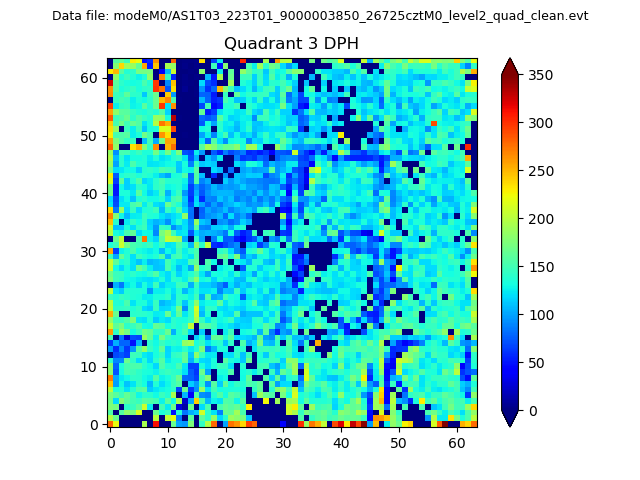 |
 |
Quadrant C |
| Plot type | Count rate plots | Images |
|---|---|---|
| Comparison with Poisson distribution Blue bars denote a histogram of data divided into 1 sec bins. Red curve is a Poisson curve with rate = median count rate of data. |
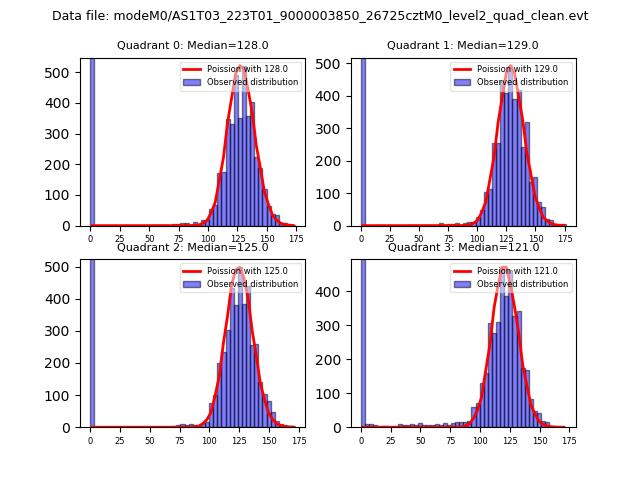 |
 |
| Quadrant-wise count rates Data is divided into 100 sec bins |
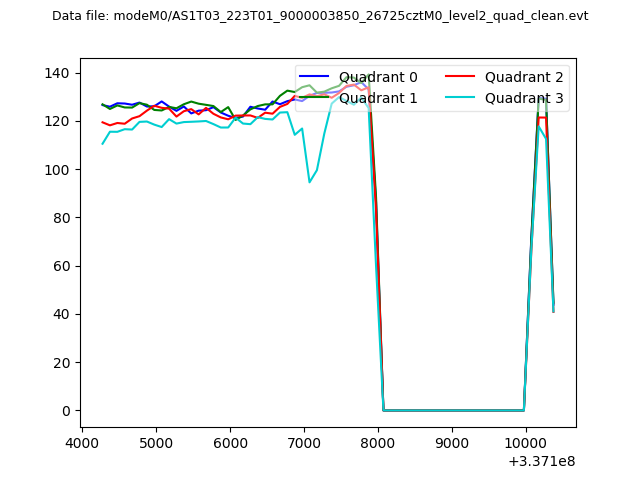 |
|
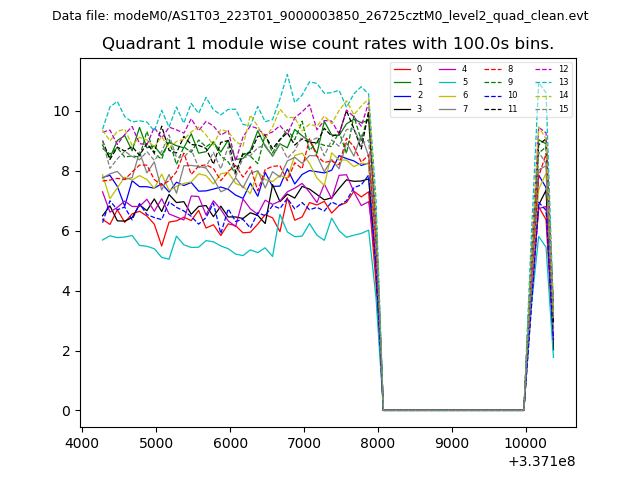
| Module-wise count rates for Quadrant A Data is divided into 100 sec bins |
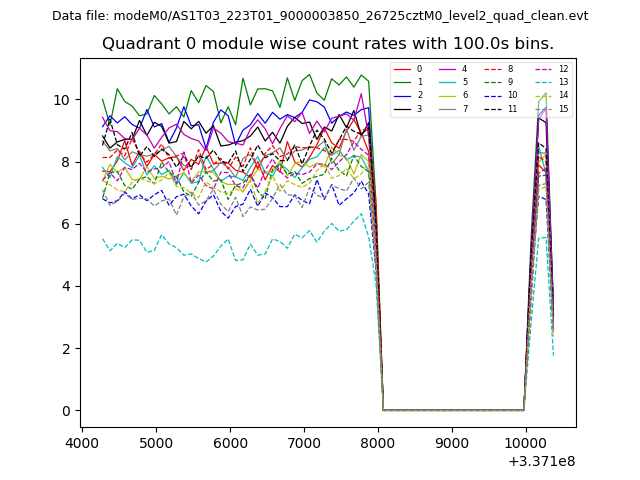 |
 |
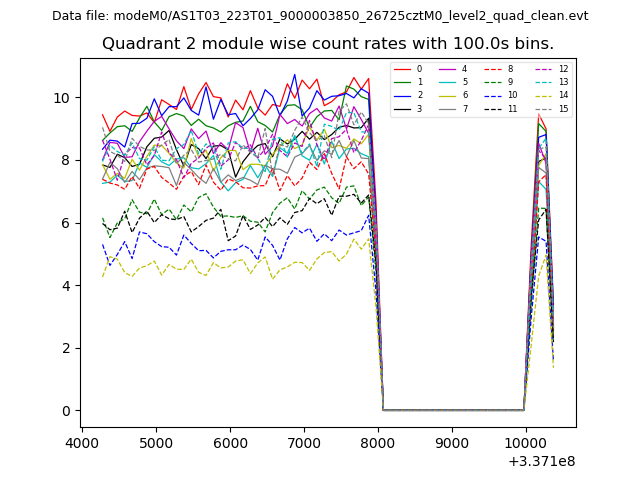
| Module-wise count rates for Quadrant B Data is divided into 100 sec bins |
 |
 |
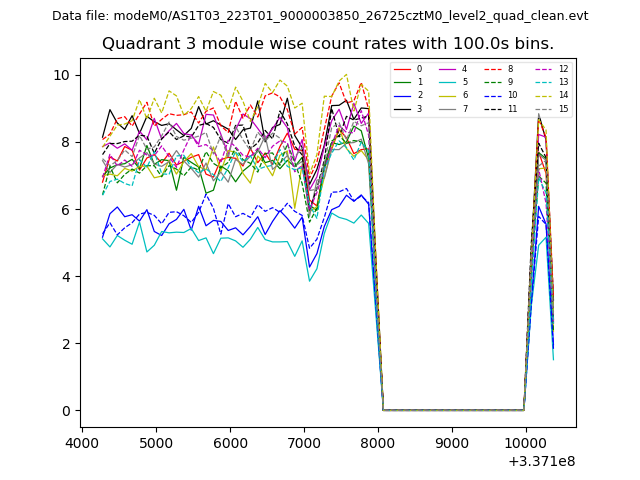
| Module-wise count rates for Quadrant C Data is divided into 100 sec bins |
 |
 |
| Module-wise count rates for Quadrant D Data is divided into 100 sec bins |
 |
 |
| Parameter | Plot |
|---|---|
| CZT HV Monitor | 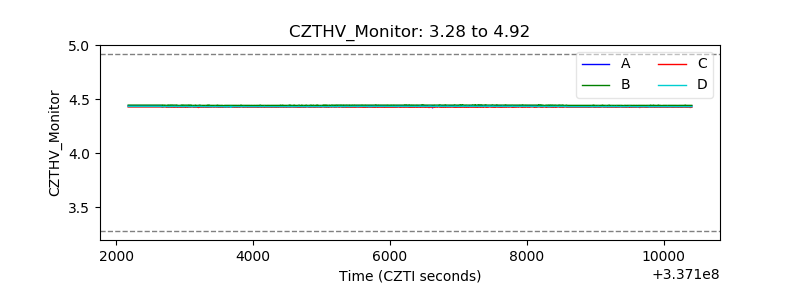 |
| D_VDD | 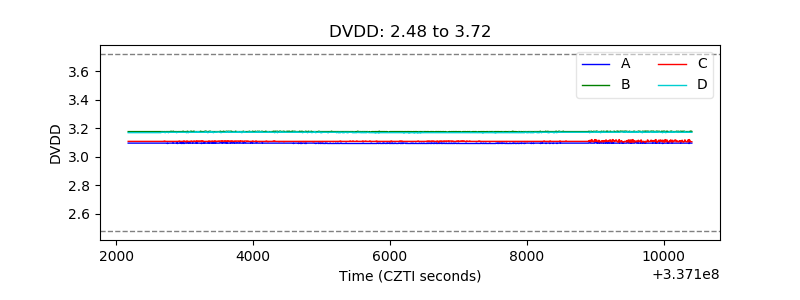 |
| Temperature 1 | 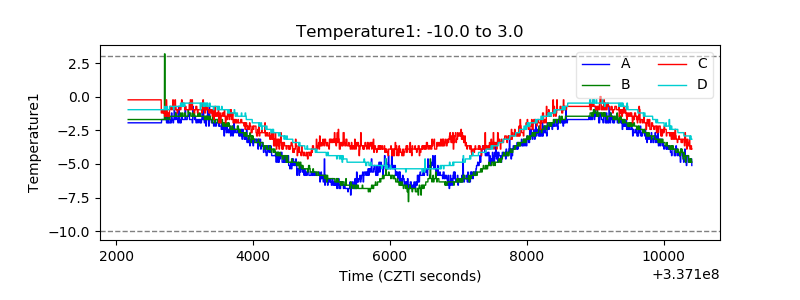 |
| Veto HV Monitor | 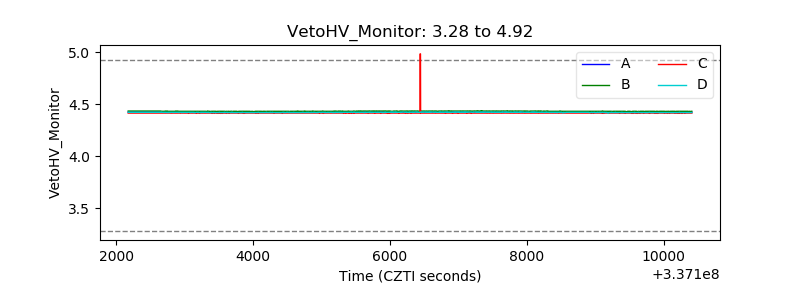 |
| Veto LLD | 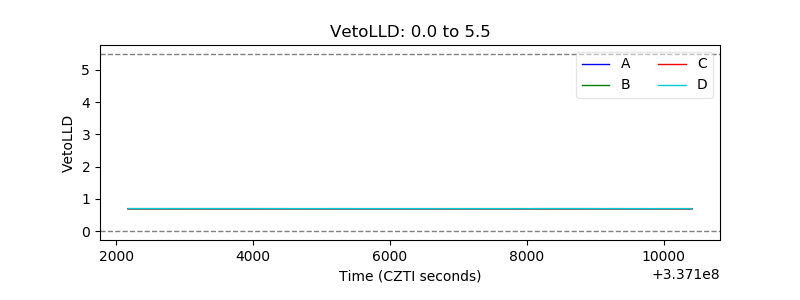 |
| Alpha Counter | 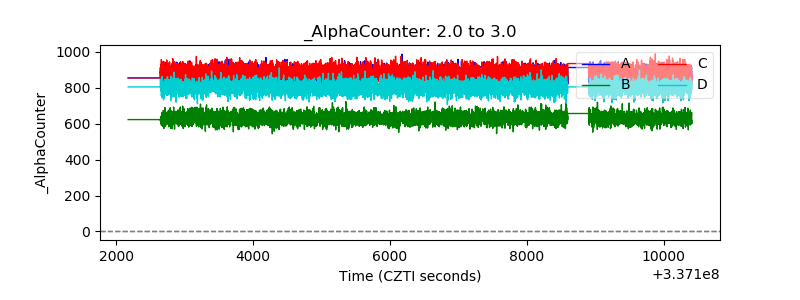 |
| _CPM_Rate | 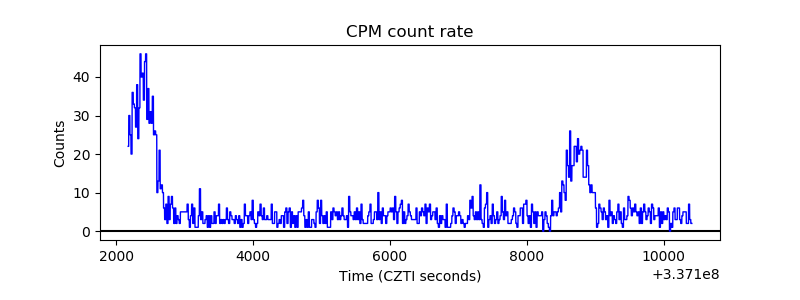 |
| CZT Counter | 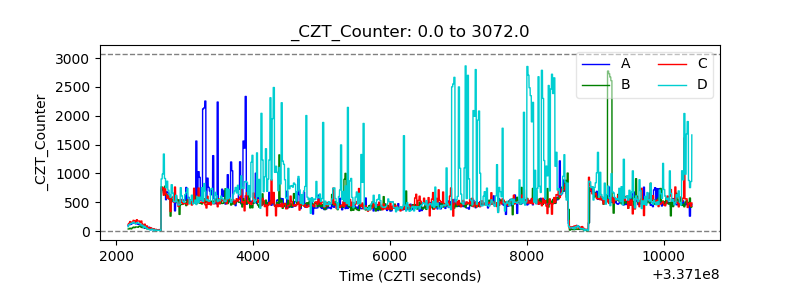 |
| +2.5 Volts monitor |  |
| +5 Volts monitor | 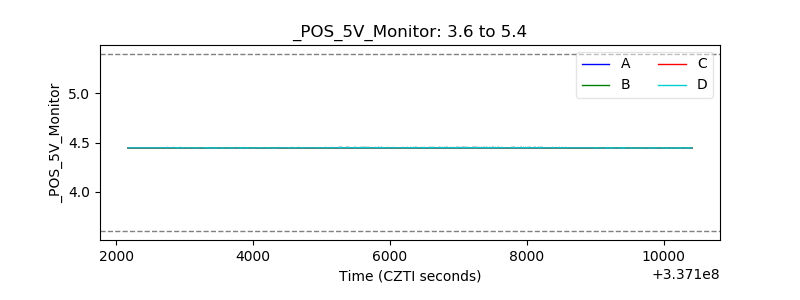 |
| _ROLL_ROT | 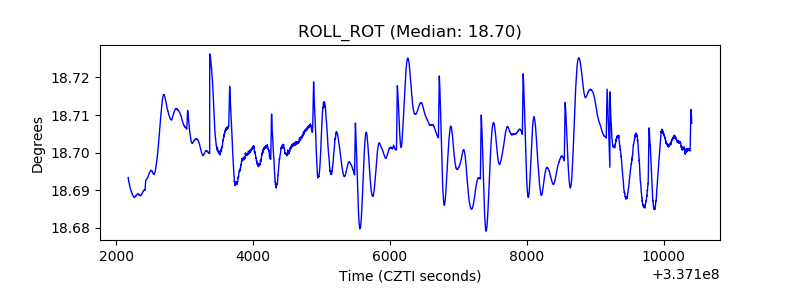 |
| _Roll_DEC | 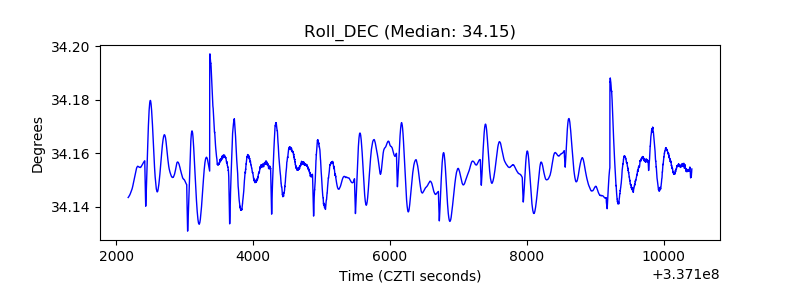 |
| _Roll_RA | 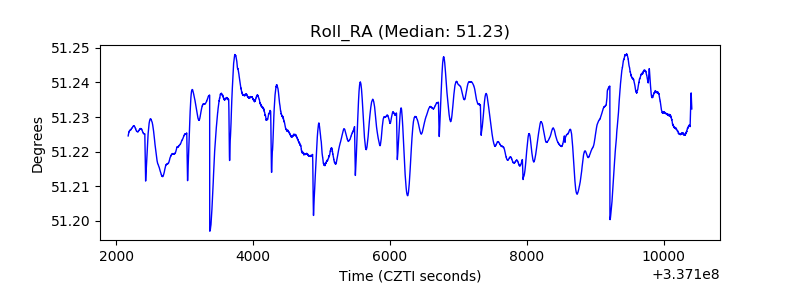 |
| Veto Counter | 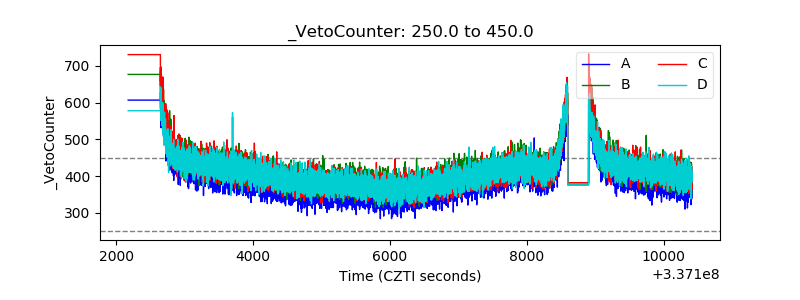 |