| Param | Original file | Final file |
|---|---|---|
| Filename | modeM0/AS1T03_223T01_9000003850_26726cztM0_level2.evt | modeM0/AS1T03_223T01_9000003850_26726cztM0_level2_quad_clean.evt |
| Size (bytes) | 681,586,560 | 88,591,680 |
| Size | 650.0 MB | 84.5 MB |
| Events in quadrant A | 3,966,915 | 564,771 |
| Events in quadrant B | 8,144,953 | 526,318 |
| Events in quadrant C | 3,488,098 | 562,059 |
| Events in quadrant D | 4,565,117 | 538,219 |
| Mode M9 | |||
|---|---|---|---|
| Quadrant | BADHDUFLAG | Total packets | Discarded packets |
| A | 0 | 4 | 0 |
| B | 0 | 4 | 0 |
| C | 0 | 4 | 0 |
| D | 0 | 4 | 0 |
| Mode M0 | |||
|---|---|---|---|
| Quadrant | BADHDUFLAG | Total packets | Discarded packets |
| A | 0 | 16443 | 0 |
| B | 0 | 28809 | 0 |
| C | 0 | 14736 | 0 |
| D | 0 | 18192 | 0 |
| Quadrant | Total seconds | Saturated seconds | Saturation percentage |
|---|---|---|---|
| A | 7049 | 175 | 2.482622% |
| B | 7049 | 1614 | 22.896865% |
| C | 7049 | 105 | 1.489573% |
| D | 7050 | 246 | 3.489362% |
Noise dominated data is calculated using 1-second bins in cleaned event files. If a bin has >2000 counts, and if more than 50% of those come from <1% of pixels, then it is considered to be noise-dominated and hence unusable.
| Quadrant | # 1 sec bins | Bins with >0 counts | Bins with >2000 counts | High rate bins dominated by noise | Noise dominated (total time) | Noise dominated (detector-on time) | Marked lightcurve |
|---|---|---|---|---|---|---|---|
| A | 7424 | 7050 | 108 | 108 | 1.45% | 1.53% | 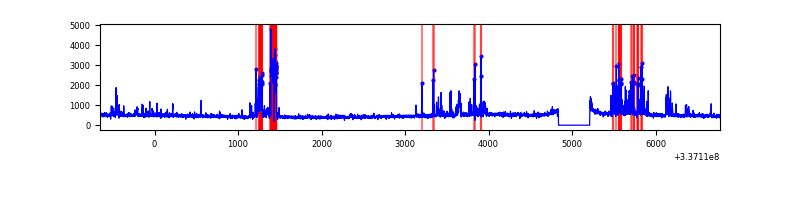 |
| B | 7424 | 7050 | 1392 | 1392 | 18.75% | 19.74% | 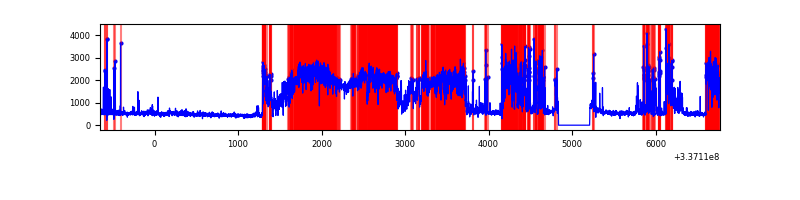 |
| C | 7424 | 7050 | 4 | 4 | 0.05% | 0.06% | 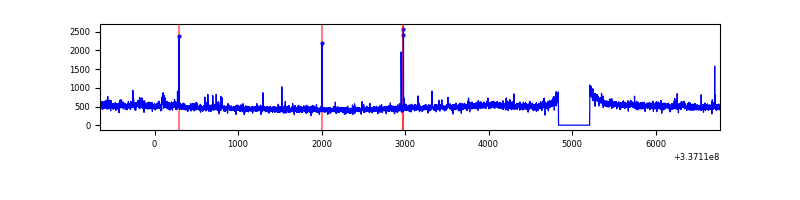 |
| D | 7425 | 7051 | 155 | 155 | 2.09% | 2.20% | 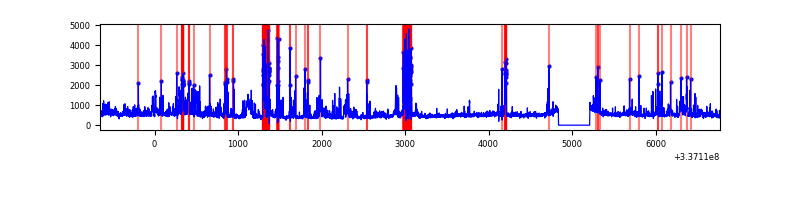 |
Top three noisy pixels from each quadrant. If the there are fewer than three noisy pixels in the level2.evt file, extra rows are filled as -1
| Pixel properties | Quadrant properties | ||||||
|---|---|---|---|---|---|---|---|
| Quadrant | DetID | PixID | Counts | Sigma | Mean | Median | Sigma |
| A | 0 | 13 | 648540 | 3745.44 | 852 | 833 | 172.9 |
| A | 11 | 29 | 18375 | 101.44 | 852 | 833 | 172.9 |
| A | 6 | 16 | 15642 | 85.63 | 852 | 833 | 172.9 |
| B | 0 | 189 | 4597088 | 29709.48 | 811 | 791 | 154.7 |
| B | 10 | 251 | 219186 | 1411.66 | 811 | 791 | 154.7 |
| B | 3 | 112 | 104081 | 667.64 | 811 | 791 | 154.7 |
| C | 14 | 238 | 131165 | 677.01 | 822 | 826 | 192.5 |
| C | 3 | 233 | 81168 | 417.31 | 822 | 826 | 192.5 |
| C | 15 | 208 | 35151 | 178.29 | 822 | 826 | 192.5 |
| D | 1 | 52 | 958423 | 4741.39 | 825 | 799 | 202.0 |
| D | 7 | 80 | 163798 | 807.04 | 825 | 799 | 202.0 |
| D | 2 | 250 | 153311 | 755.12 | 825 | 799 | 202.0 |
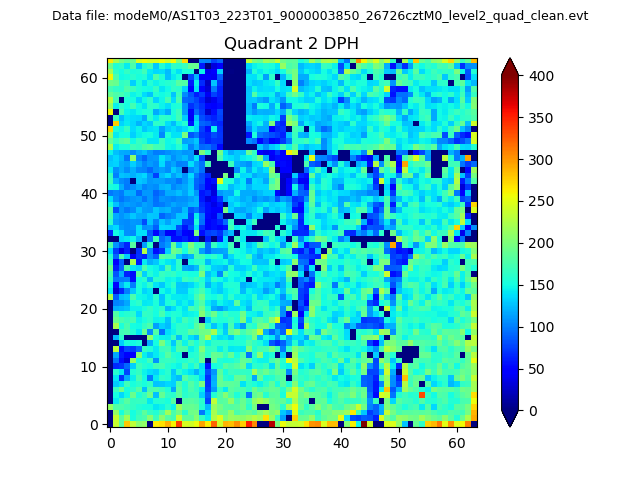
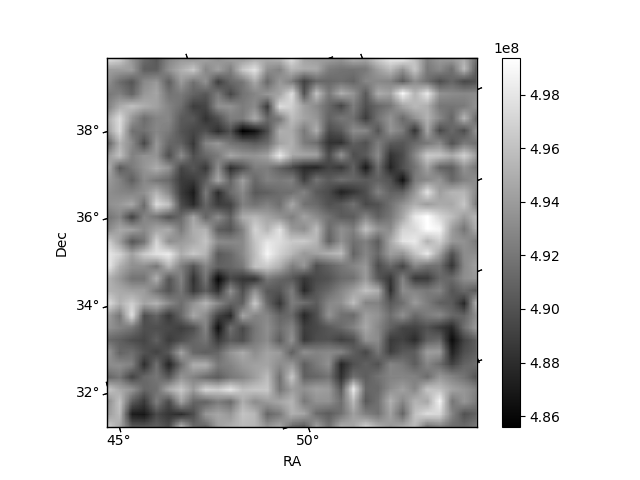
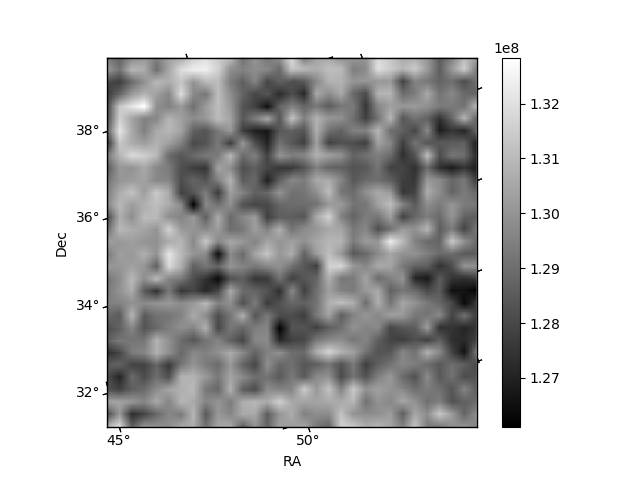
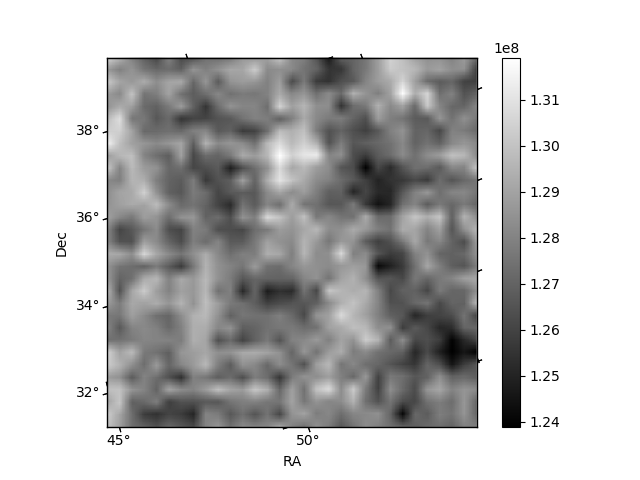
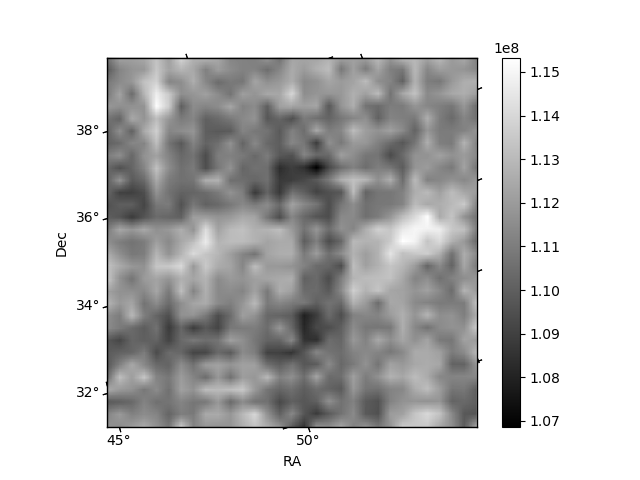
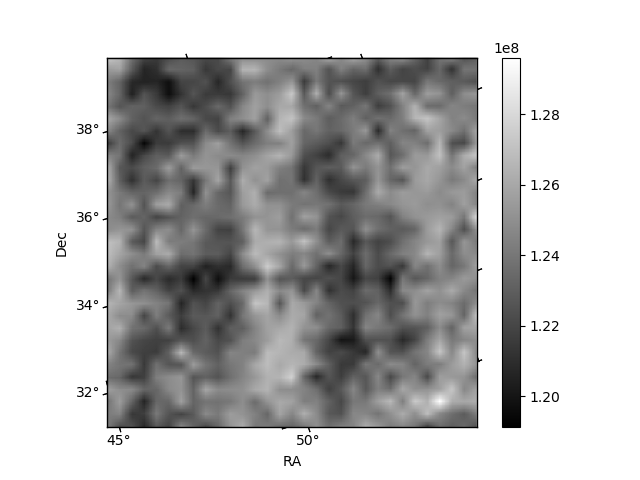
Histogram calculated using DETX and DETY for each event in the final _common_clean file
| Quadrant A | 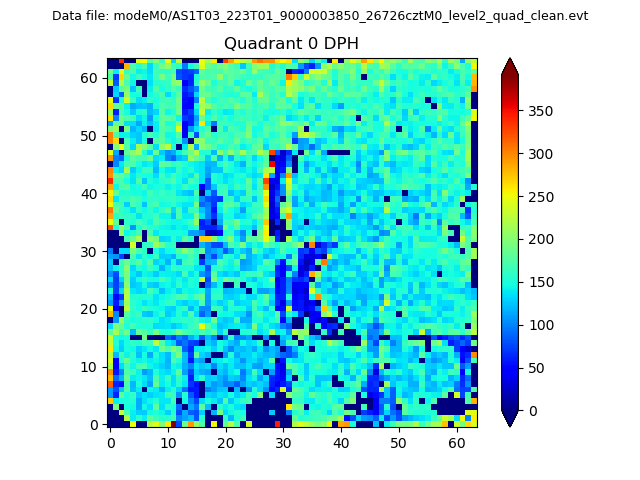 |
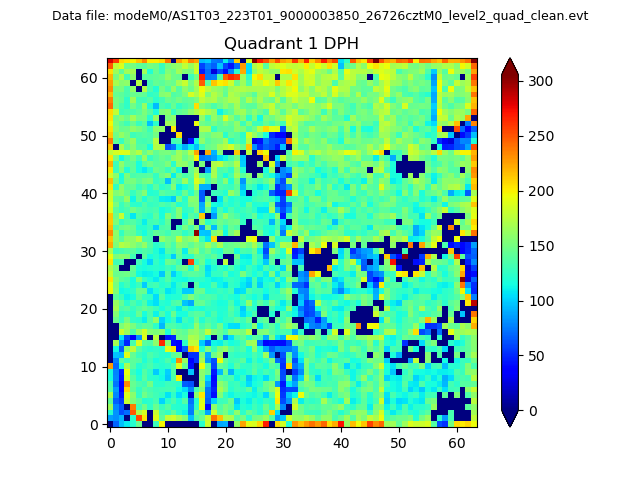 |
Quadrant B |
|---|---|---|---|
| Quadrant D | 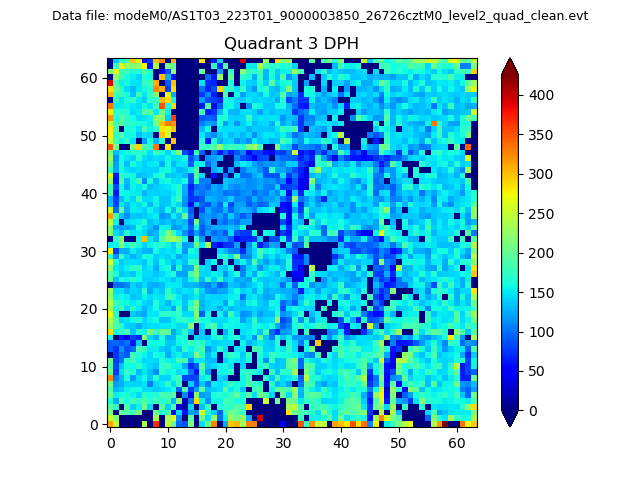 |
 |
Quadrant C |
| Plot type | Count rate plots | Images |
|---|---|---|
| Comparison with Poisson distribution Blue bars denote a histogram of data divided into 1 sec bins. Red curve is a Poisson curve with rate = median count rate of data. |
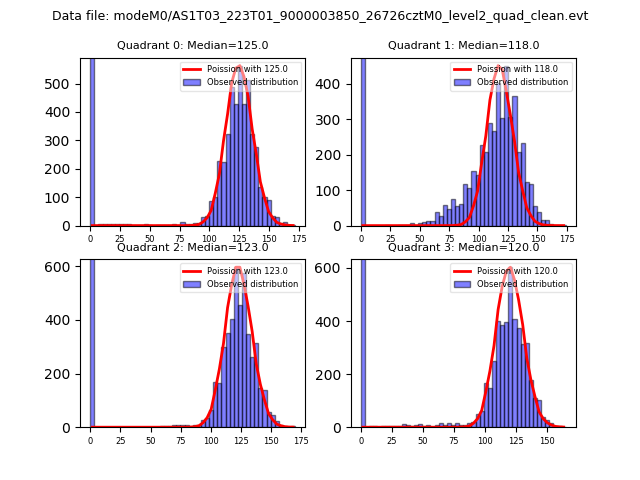 |
 |
| Quadrant-wise count rates Data is divided into 100 sec bins |
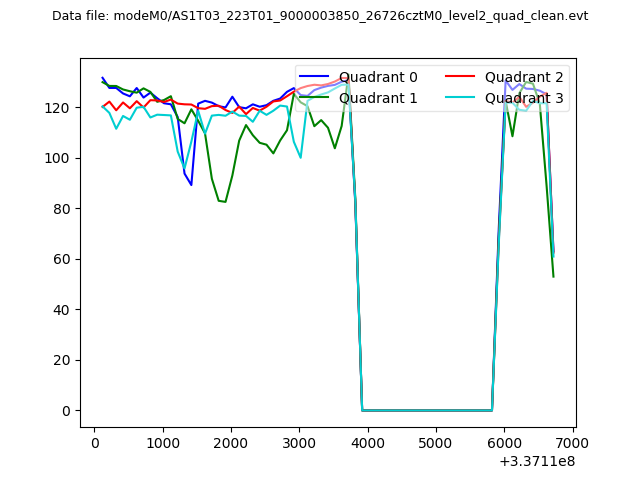 |
|
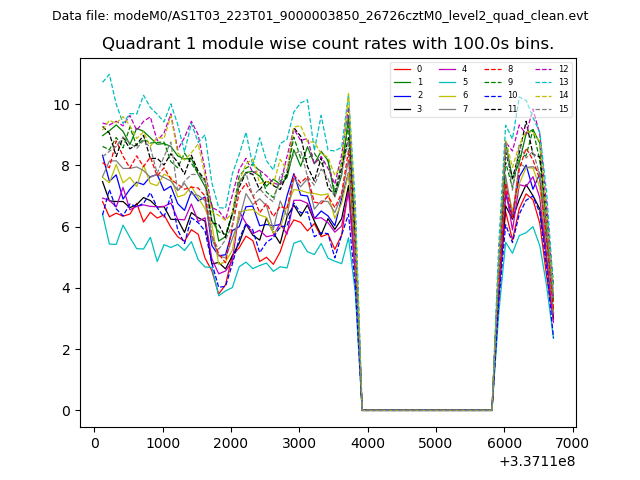
| Module-wise count rates for Quadrant A Data is divided into 100 sec bins |
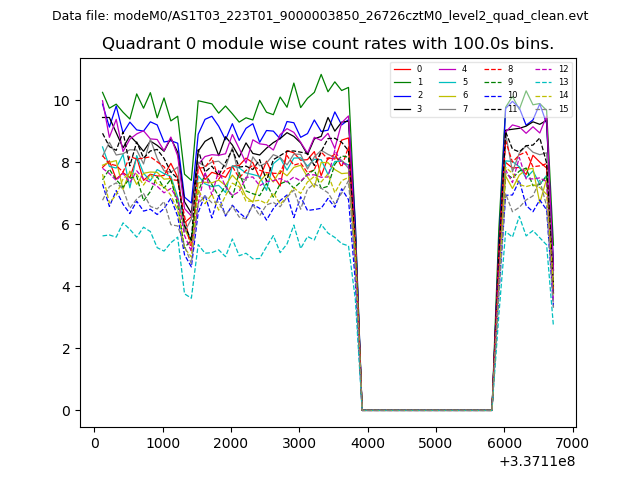 |
 |
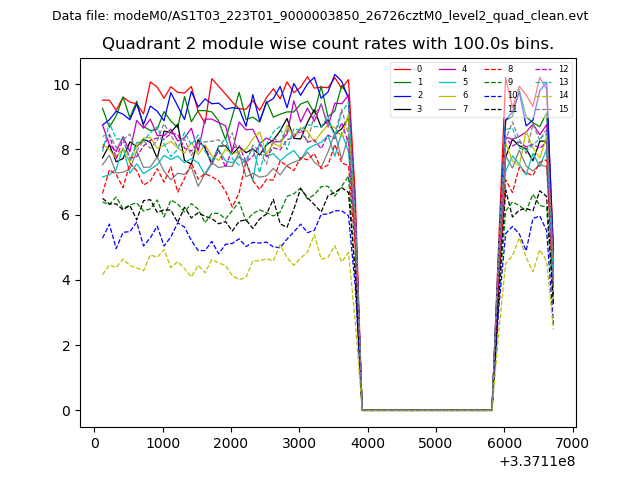
| Module-wise count rates for Quadrant B Data is divided into 100 sec bins |
 |
 |
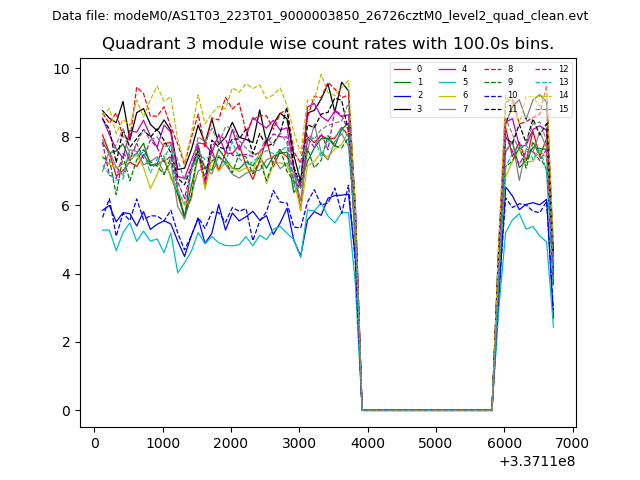
| Module-wise count rates for Quadrant C Data is divided into 100 sec bins |
 |
 |
| Module-wise count rates for Quadrant D Data is divided into 100 sec bins |
 |
 |
| Parameter | Plot |
|---|---|
| CZT HV Monitor | 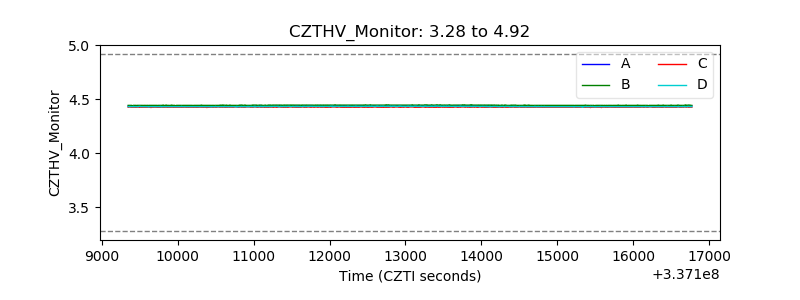 |
| D_VDD | 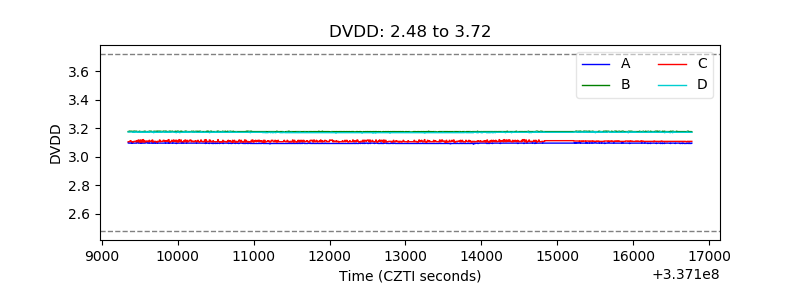 |
| Temperature 1 | 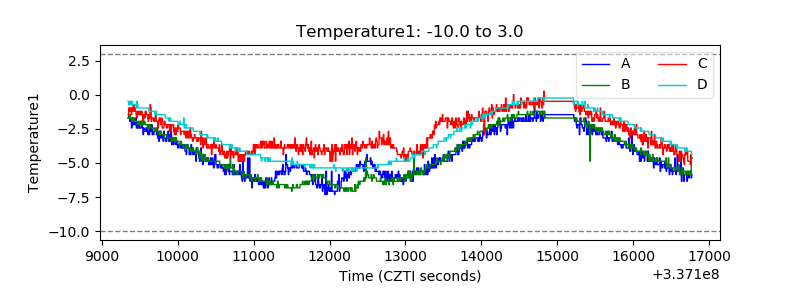 |
| Veto HV Monitor | 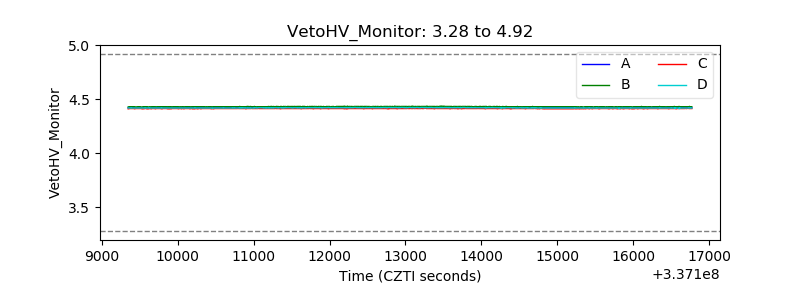 |
| Veto LLD | 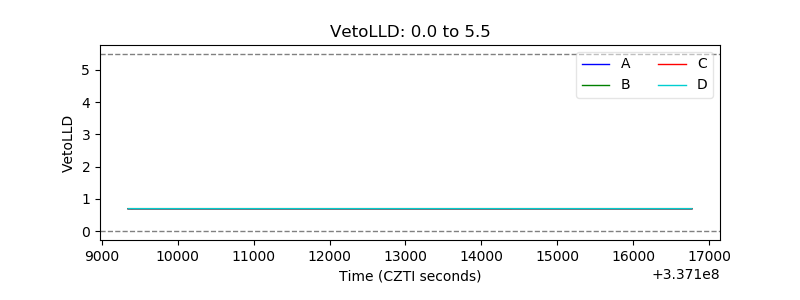 |
| Alpha Counter |  |
| _CPM_Rate | 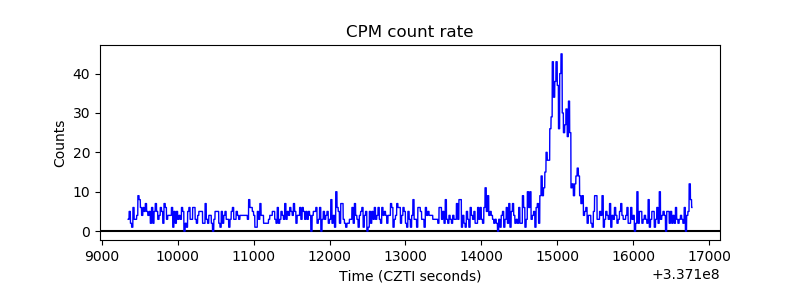 |
| CZT Counter | 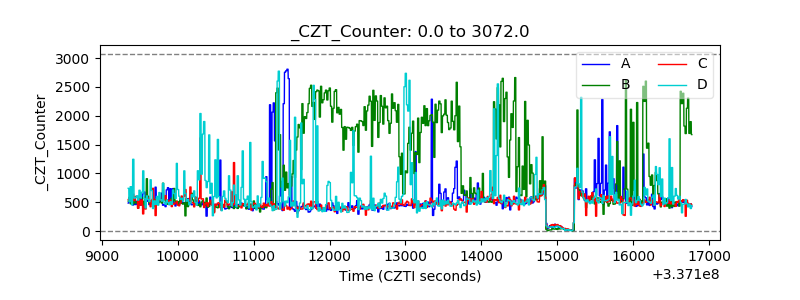 |
| +2.5 Volts monitor |  |
| +5 Volts monitor |  |
| _ROLL_ROT | 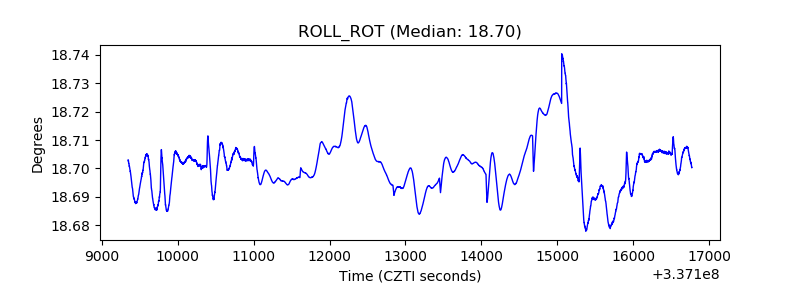 |
| _Roll_DEC | 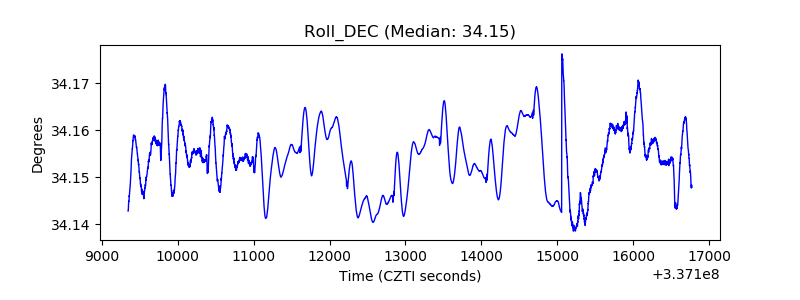 |
| _Roll_RA | 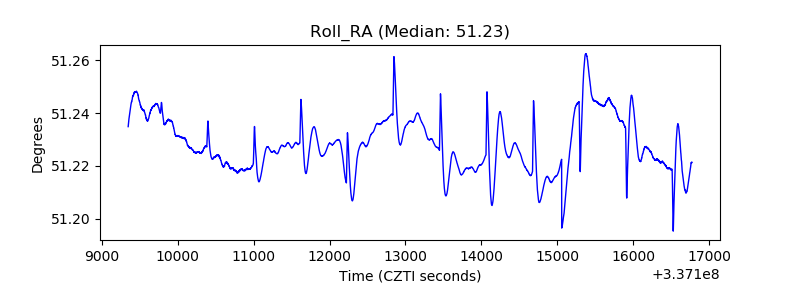 |
| Veto Counter | 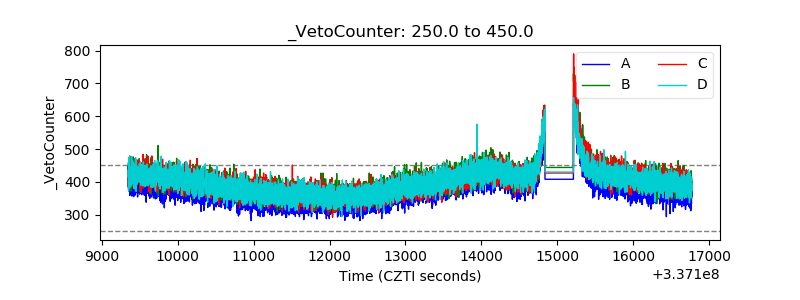 |