| Param | Original file | Final file |
|---|---|---|
| Filename | modeM0/AS1T03_223T01_9000003850_26729cztM0_level2.evt | modeM0/AS1T03_223T01_9000003850_26729cztM0_level2_quad_clean.evt |
| Size (bytes) | 1,658,859,840 | 241,951,680 |
| Size | 1.5 GB | 230.7 MB |
| Events in quadrant A | 9,079,794 | 1,563,395 |
| Events in quadrant B | 19,001,387 | 1,470,396 |
| Events in quadrant C | 8,927,783 | 1,554,692 |
| Events in quadrant D | 12,009,509 | 1,490,581 |
| Mode M9 | |||
|---|---|---|---|
| Quadrant | BADHDUFLAG | Total packets | Discarded packets |
| A | 0 | 20 | 0 |
| B | 0 | 20 | 0 |
| C | 0 | 20 | 0 |
| D | 0 | 20 | 0 |
| Mode M0 | |||
|---|---|---|---|
| Quadrant | BADHDUFLAG | Total packets | Discarded packets |
| A | 0 | 39230 | 0 |
| B | 0 | 68590 | 0 |
| C | 0 | 38349 | 0 |
| D | 0 | 48191 | 0 |
| Quadrant | Total seconds | Saturated seconds | Saturation percentage |
|---|---|---|---|
| A | 18104 | 181 | 0.999779% |
| B | 18105 | 2873 | 15.868545% |
| C | 18104 | 260 | 1.436147% |
| D | 18104 | 828 | 4.573575% |
Noise dominated data is calculated using 1-second bins in cleaned event files. If a bin has >2000 counts, and if more than 50% of those come from <1% of pixels, then it is considered to be noise-dominated and hence unusable.
| Quadrant | # 1 sec bins | Bins with >0 counts | Bins with >2000 counts | High rate bins dominated by noise | Noise dominated (total time) | Noise dominated (detector-on time) | Marked lightcurve |
|---|---|---|---|---|---|---|---|
| A | 20214 | 18107 | 79 | 79 | 0.39% | 0.44% | 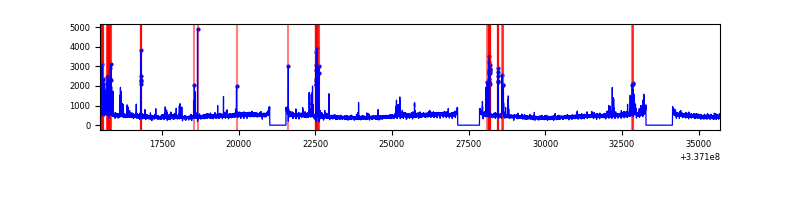 |
| B | 20215 | 18108 | 2380 | 2380 | 11.77% | 13.14% | 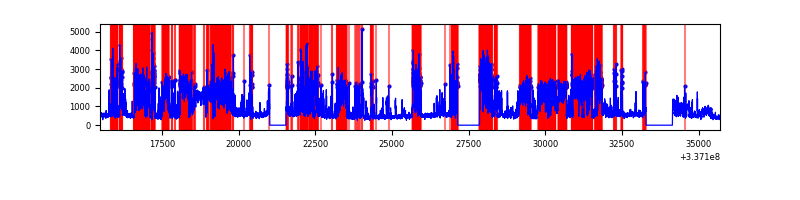 |
| C | 20214 | 18107 | 24 | 24 | 0.12% | 0.13% | 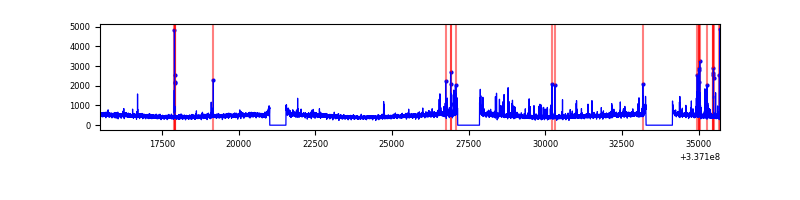 |
| D | 20214 | 18107 | 547 | 547 | 2.71% | 3.02% | 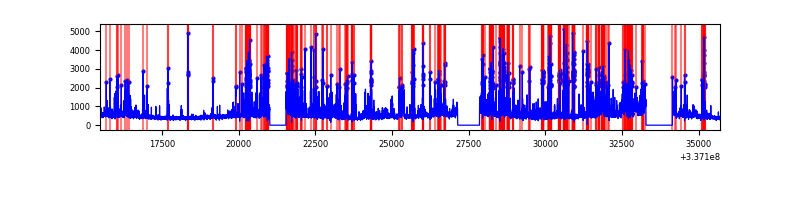 |
Top three noisy pixels from each quadrant. If the there are fewer than three noisy pixels in the level2.evt file, extra rows are filled as -1
| Pixel properties | Quadrant properties | ||||||
|---|---|---|---|---|---|---|---|
| Quadrant | DetID | PixID | Counts | Sigma | Mean | Median | Sigma |
| A | 0 | 13 | 740312 | 1704.88 | 2161 | 2113 | 433.0 |
| A | 13 | 254 | 28017 | 59.83 | 2161 | 2113 | 433.0 |
| A | 3 | 137 | 20850 | 43.27 | 2161 | 2113 | 433.0 |
| B | 0 | 189 | 10427197 | 26844.0 | 2055 | 2002 | 388.4 |
| B | 10 | 251 | 234027 | 597.44 | 2055 | 2002 | 388.4 |
| B | 3 | 112 | 163477 | 415.78 | 2055 | 2002 | 388.4 |
| C | 14 | 238 | 331132 | 671.82 | 2085 | 2101 | 489.8 |
| C | 4 | 254 | 283435 | 574.43 | 2085 | 2101 | 489.8 |
| C | 3 | 233 | 82842 | 164.86 | 2085 | 2101 | 489.8 |
| D | 1 | 52 | 2913854 | 5578.86 | 2061 | 2012 | 521.9 |
| D | 2 | 250 | 609558 | 1164.01 | 2061 | 2012 | 521.9 |
| D | 7 | 80 | 457346 | 872.38 | 2061 | 2012 | 521.9 |
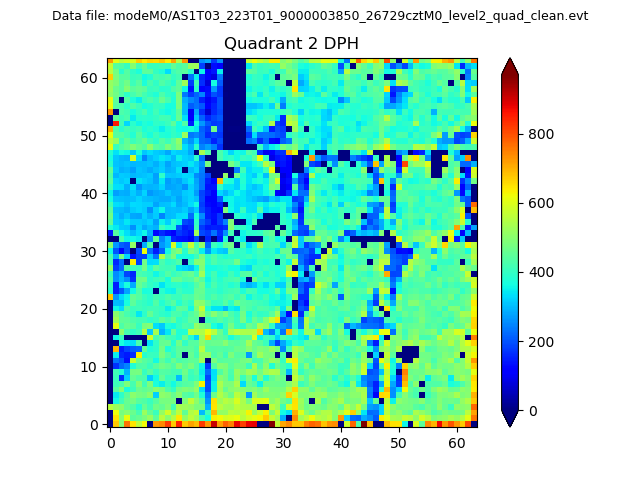
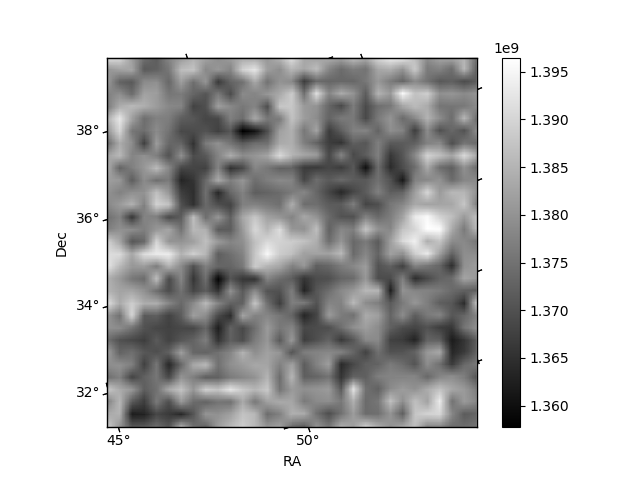
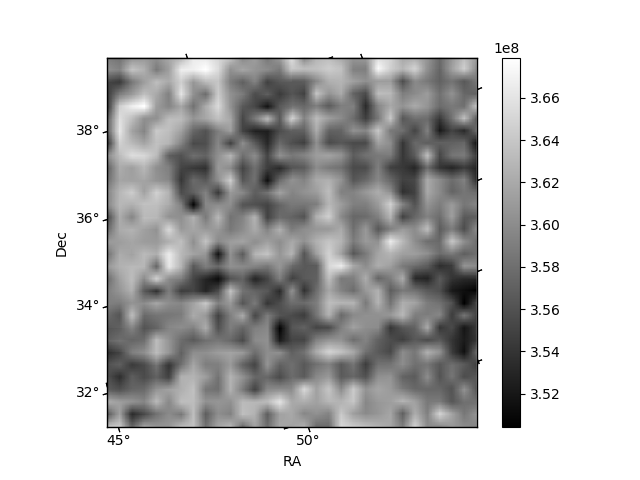
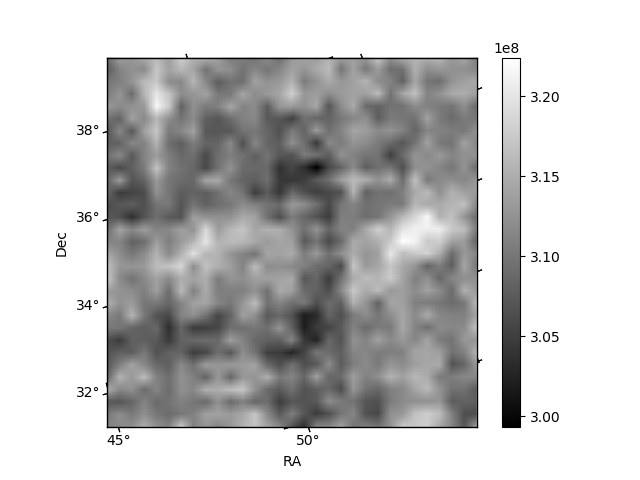
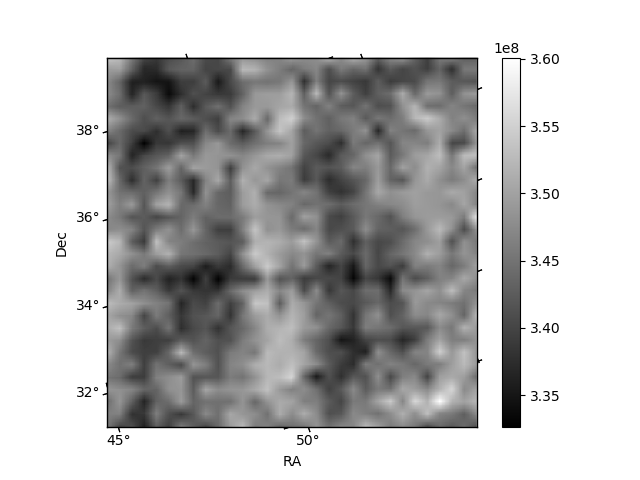
Histogram calculated using DETX and DETY for each event in the final _common_clean file
| Quadrant A | 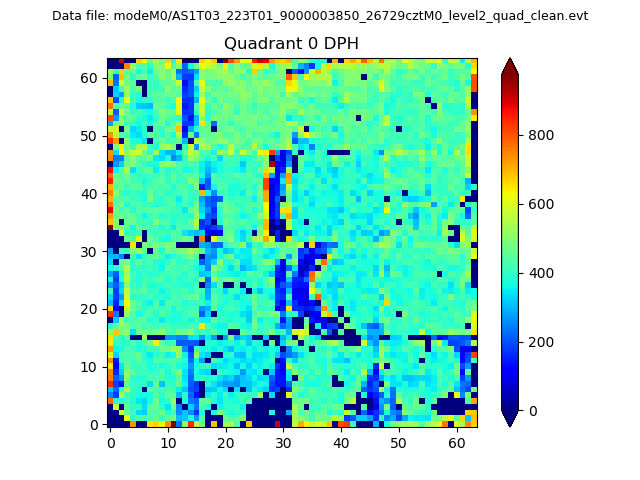 |
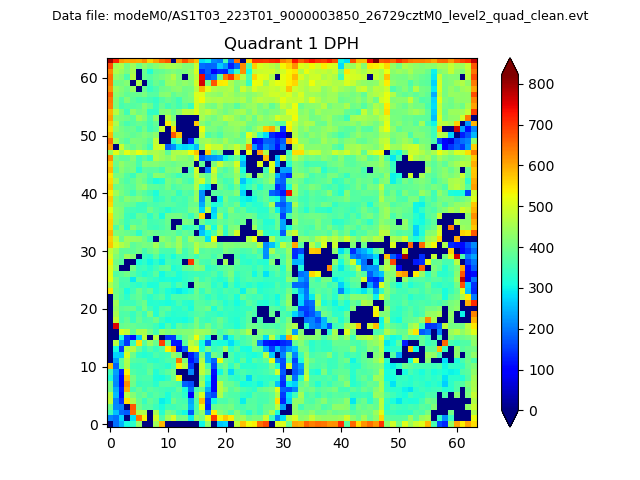 |
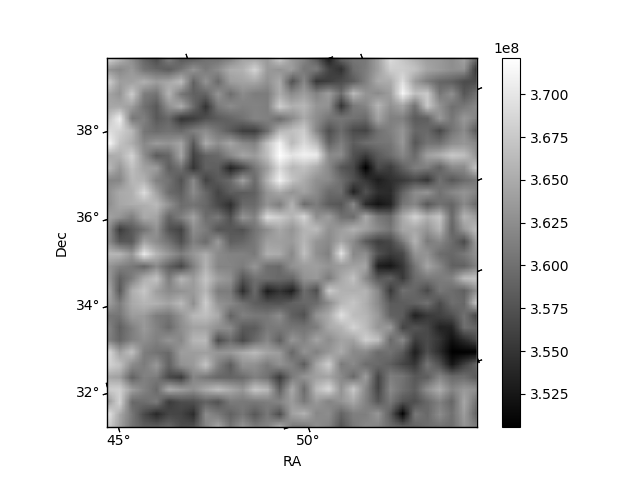
Quadrant B |
|---|---|---|---|
| Quadrant D | 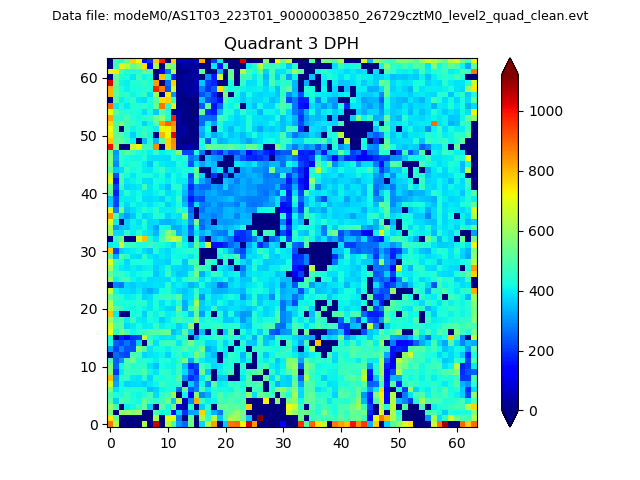 |
 |
Quadrant C |
| Plot type | Count rate plots | Images |
|---|---|---|
| Comparison with Poisson distribution Blue bars denote a histogram of data divided into 1 sec bins. Red curve is a Poisson curve with rate = median count rate of data. |
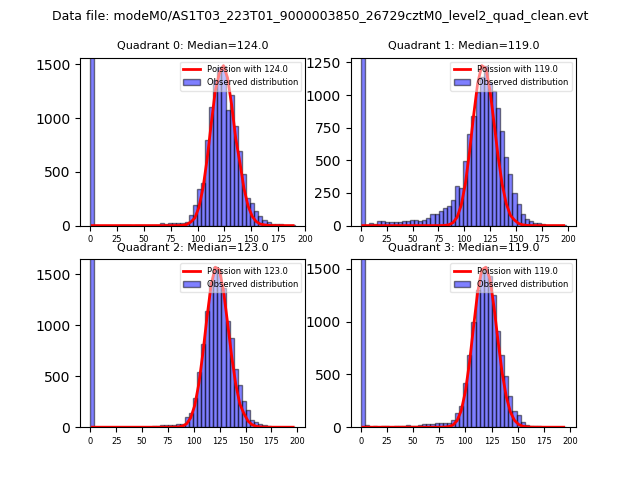 |
 |
| Quadrant-wise count rates Data is divided into 100 sec bins |
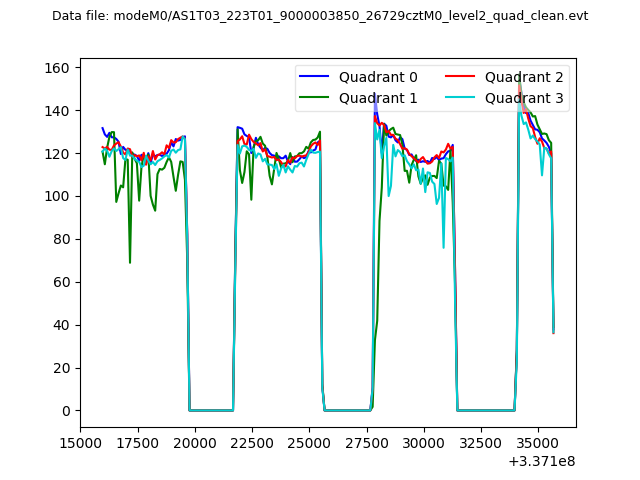 |
|
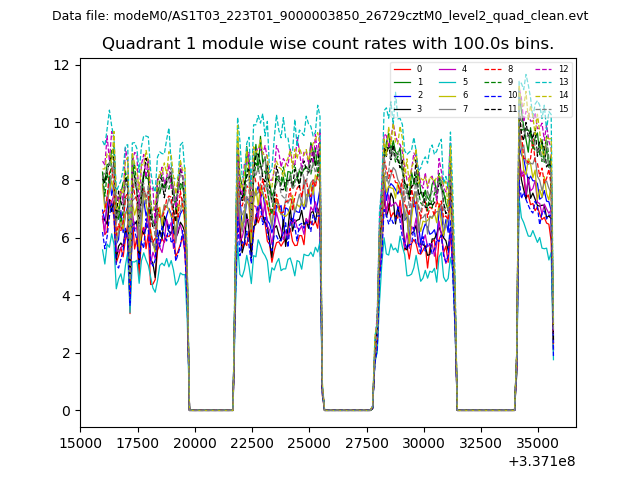
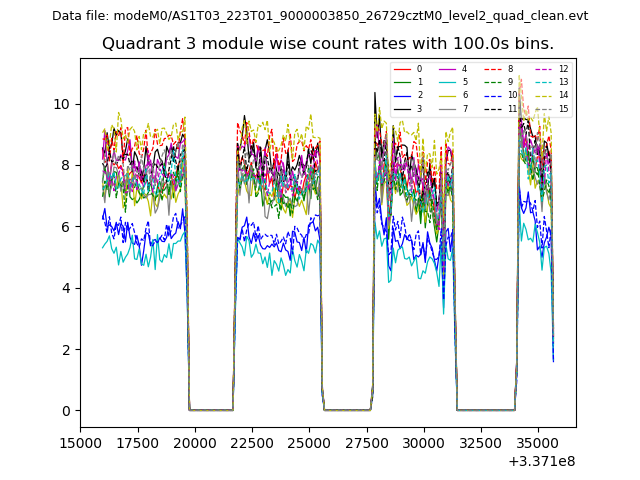
| Module-wise count rates for Quadrant A Data is divided into 100 sec bins |
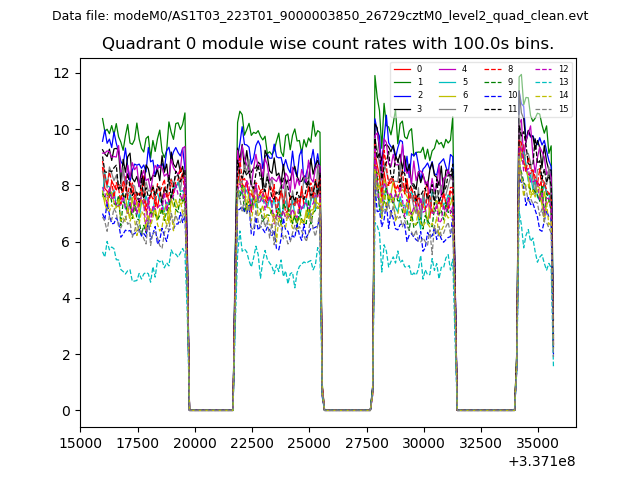 |
 |
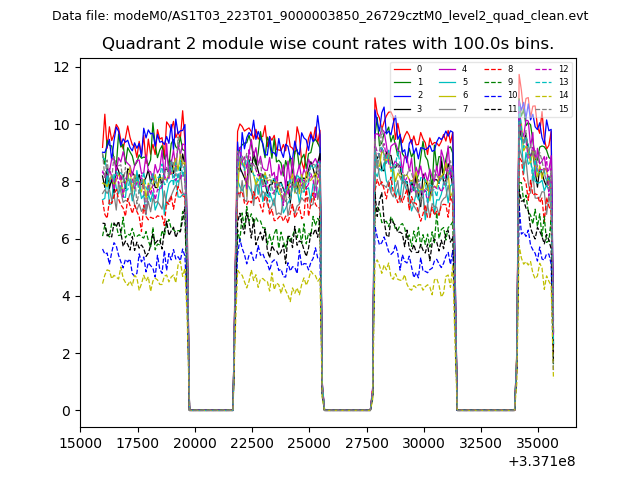
| Module-wise count rates for Quadrant B Data is divided into 100 sec bins |
 |
 |
| Module-wise count rates for Quadrant C Data is divided into 100 sec bins |
 |
 |
| Module-wise count rates for Quadrant D Data is divided into 100 sec bins |
 |
 |
| Parameter | Plot |
|---|---|
| CZT HV Monitor | 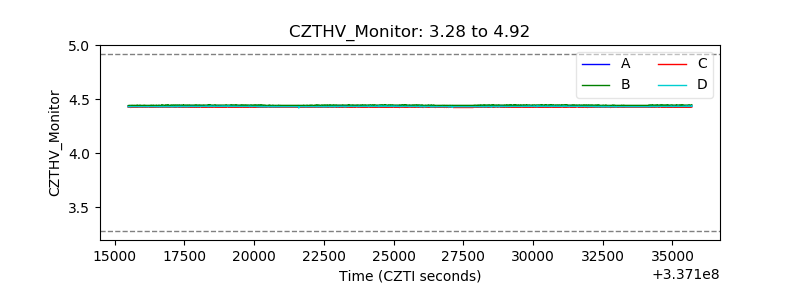 |
| D_VDD | 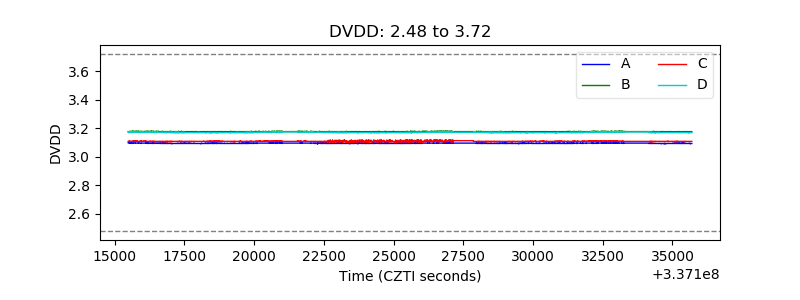 |
| Temperature 1 | 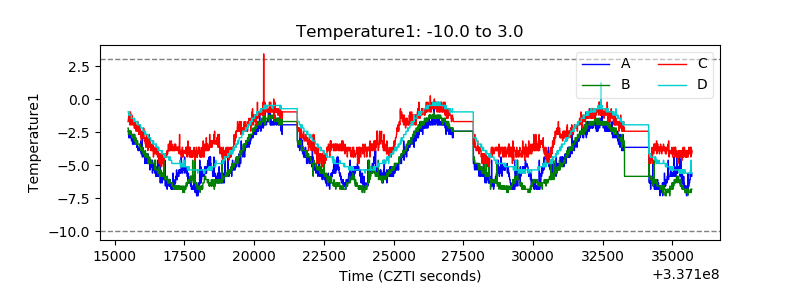 |
| Veto HV Monitor | 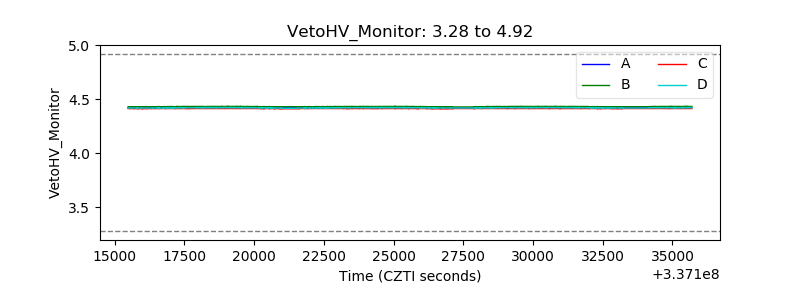 |
| Veto LLD | 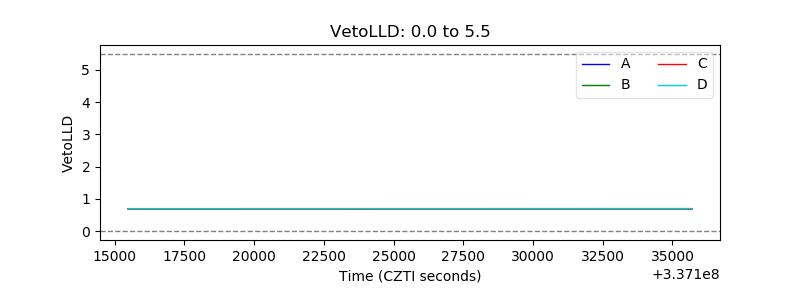 |
| Alpha Counter | 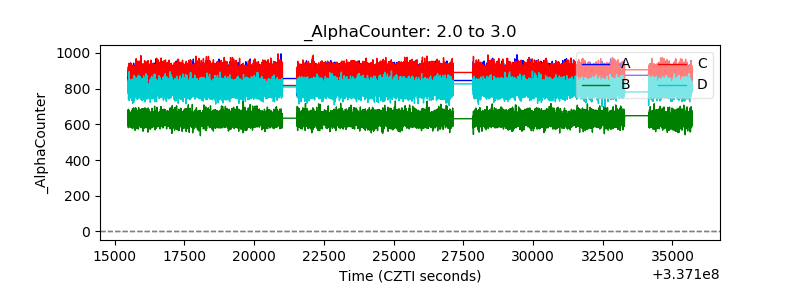 |
| _CPM_Rate | 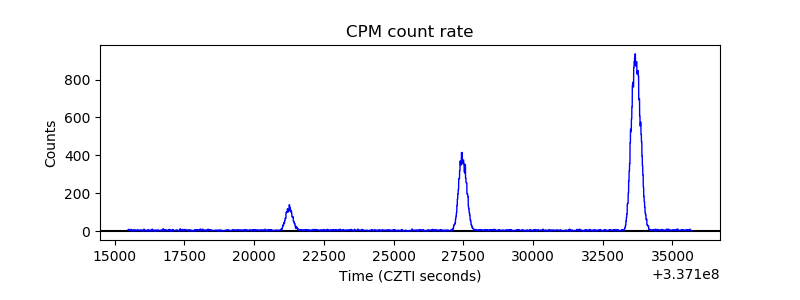 |
| CZT Counter | 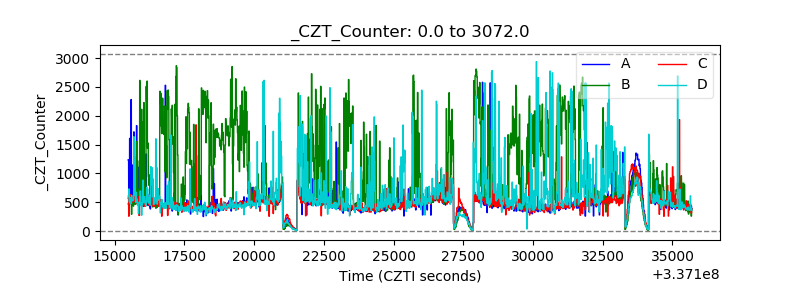 |
| +2.5 Volts monitor | 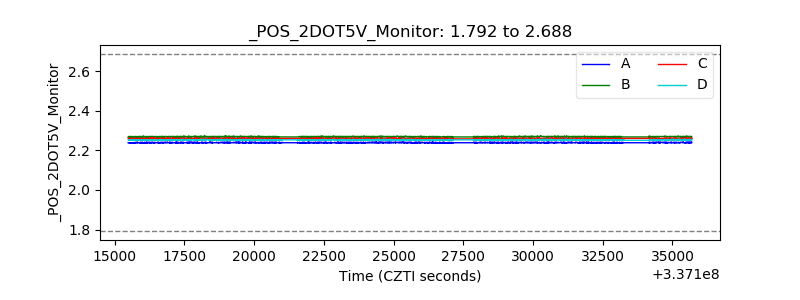 |
| +5 Volts monitor |  |
| _ROLL_ROT | 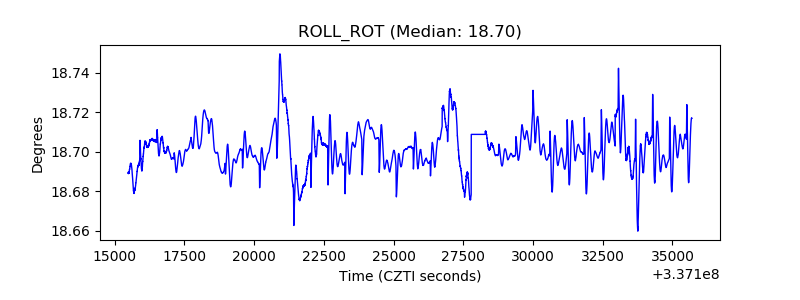 |
| _Roll_DEC | 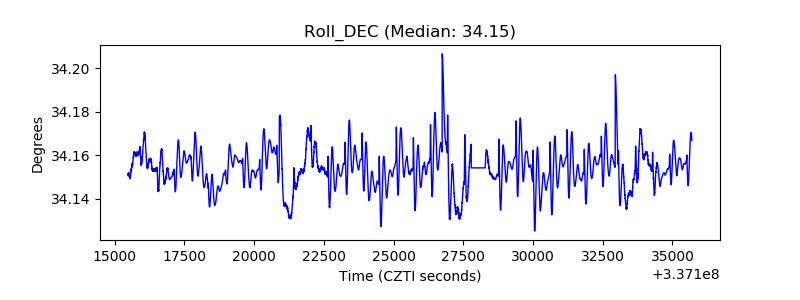 |
| _Roll_RA | 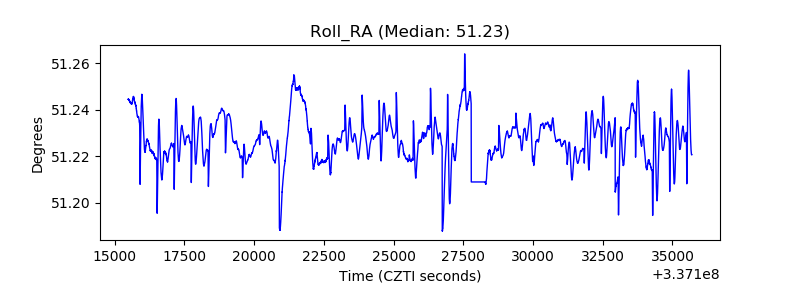 |
| Veto Counter | 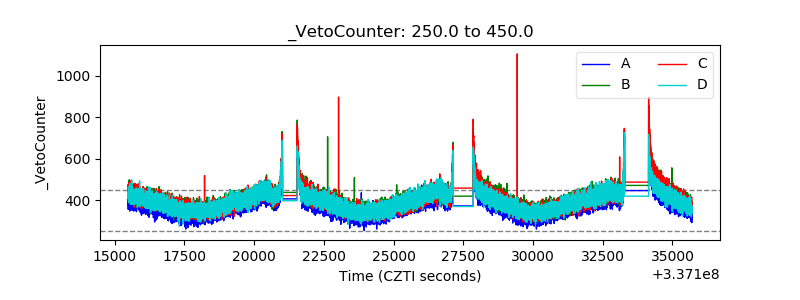 |