| Param | Original file | Final file |
|---|---|---|
| Filename | modeM0/AS1T03_223T01_9000003850_26730cztM0_level2.evt | modeM0/AS1T03_223T01_9000003850_26730cztM0_level2_quad_clean.evt |
| Size (bytes) | 594,521,280 | 98,265,600 |
| Size | 567.0 MB | 93.7 MB |
| Events in quadrant A | 4,511,961 | 622,989 |
| Events in quadrant B | 4,976,803 | 634,886 |
| Events in quadrant C | 3,772,045 | 624,466 |
| Events in quadrant D | 4,265,729 | 601,692 |
| Mode M9 | |||
|---|---|---|---|
| Quadrant | BADHDUFLAG | Total packets | Discarded packets |
| A | 0 | 18 | 0 |
| B | 0 | 18 | 0 |
| C | 0 | 18 | 0 |
| D | 0 | 18 | 0 |
| Mode M0 | |||
|---|---|---|---|
| Quadrant | BADHDUFLAG | Total packets | Discarded packets |
| A | 0 | 18011 | 0 |
| B | 0 | 19583 | 0 |
| C | 0 | 15768 | 0 |
| D | 0 | 17684 | 0 |
| Quadrant | Total seconds | Saturated seconds | Saturation percentage |
|---|---|---|---|
| A | 7057 | 382 | 5.413065% |
| B | 7058 | 504 | 7.140833% |
| C | 7058 | 152 | 2.153585% |
| D | 7058 | 219 | 3.102862% |
Noise dominated data is calculated using 1-second bins in cleaned event files. If a bin has >2000 counts, and if more than 50% of those come from <1% of pixels, then it is considered to be noise-dominated and hence unusable.
| Quadrant | # 1 sec bins | Bins with >0 counts | Bins with >2000 counts | High rate bins dominated by noise | Noise dominated (total time) | Noise dominated (detector-on time) | Marked lightcurve |
|---|---|---|---|---|---|---|---|
| A | 8927 | 7059 | 302 | 302 | 3.38% | 4.28% | 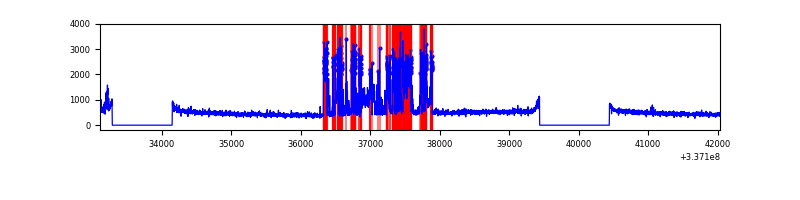 |
| B | 8928 | 7060 | 220 | 220 | 2.46% | 3.12% | 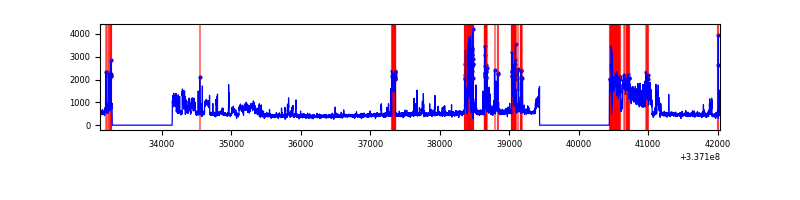 |
| C | 8928 | 7060 | 24 | 24 | 0.27% | 0.34% | 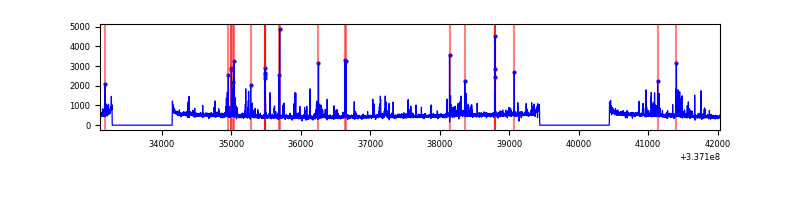 |
| D | 8928 | 7060 | 113 | 113 | 1.27% | 1.60% | 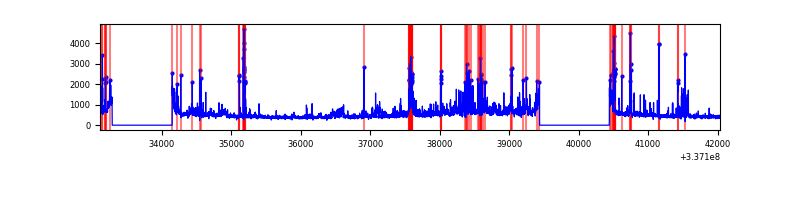 |
Top three noisy pixels from each quadrant. If the there are fewer than three noisy pixels in the level2.evt file, extra rows are filled as -1
| Pixel properties | Quadrant properties | ||||||
|---|---|---|---|---|---|---|---|
| Quadrant | DetID | PixID | Counts | Sigma | Mean | Median | Sigma |
| A | 11 | 29 | 1194529 | 7043.92 | 848 | 831 | 169.5 |
| A | 0 | 13 | 48546 | 281.56 | 848 | 831 | 169.5 |
| A | 13 | 254 | 10805 | 58.86 | 848 | 831 | 169.5 |
| B | 0 | 189 | 1592933 | 9908.17 | 841 | 820 | 160.7 |
| B | 3 | 112 | 45787 | 279.84 | 841 | 820 | 160.7 |
| B | 10 | 246 | 30858 | 186.93 | 841 | 820 | 160.7 |
| C | 4 | 254 | 372723 | 1914.59 | 827 | 833 | 194.2 |
| C | 14 | 238 | 131739 | 673.94 | 827 | 833 | 194.2 |
| C | 15 | 208 | 27727 | 138.46 | 827 | 833 | 194.2 |
| D | 1 | 52 | 862375 | 3985.97 | 816 | 799 | 216.2 |
| D | 7 | 80 | 197569 | 910.33 | 816 | 799 | 216.2 |
| D | 2 | 250 | 43443 | 197.29 | 816 | 799 | 216.2 |
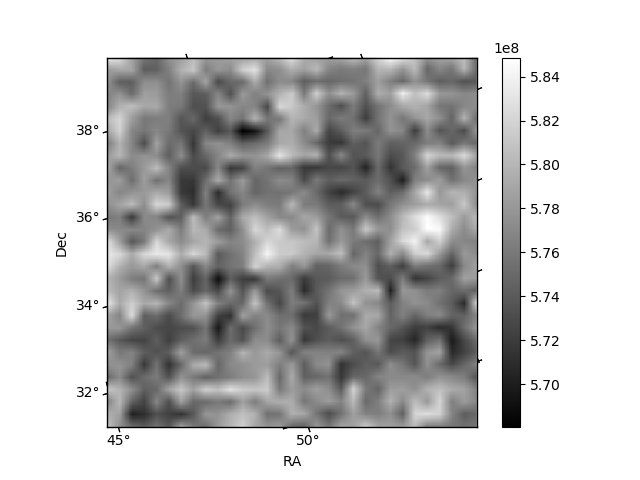
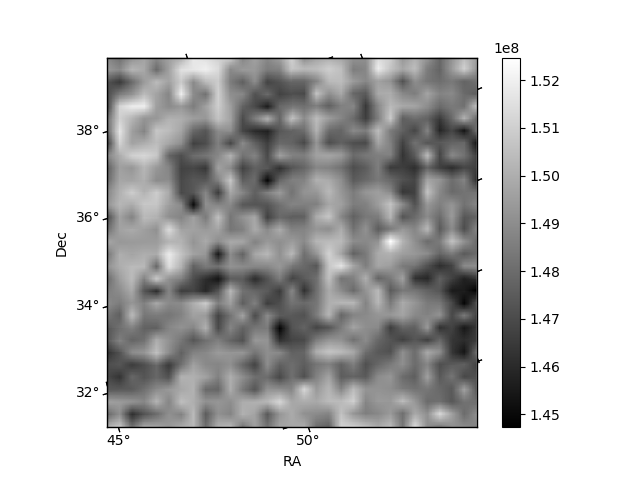
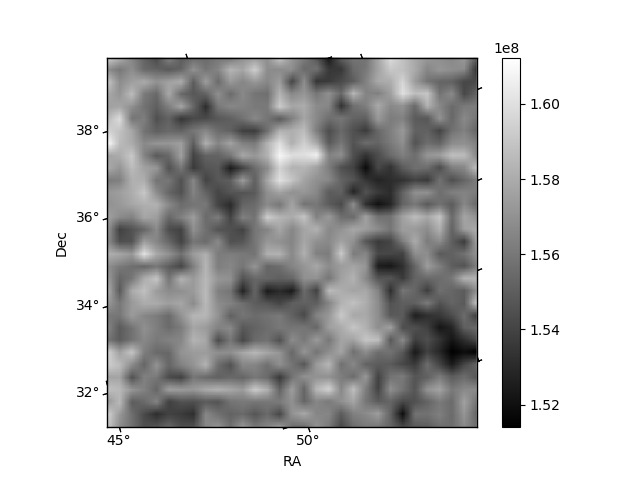
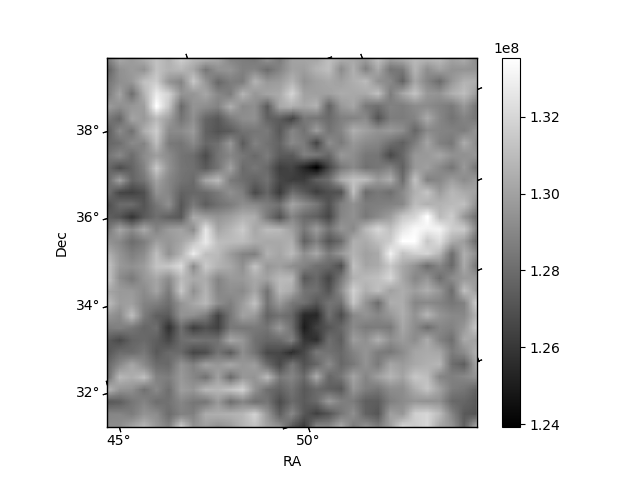
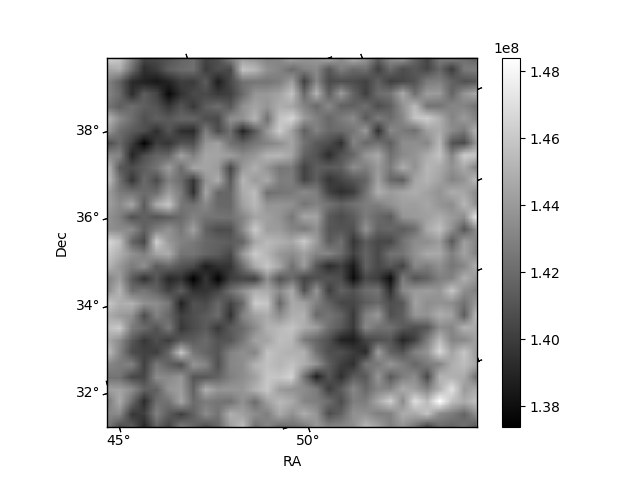
Histogram calculated using DETX and DETY for each event in the final _common_clean file
| Quadrant A | 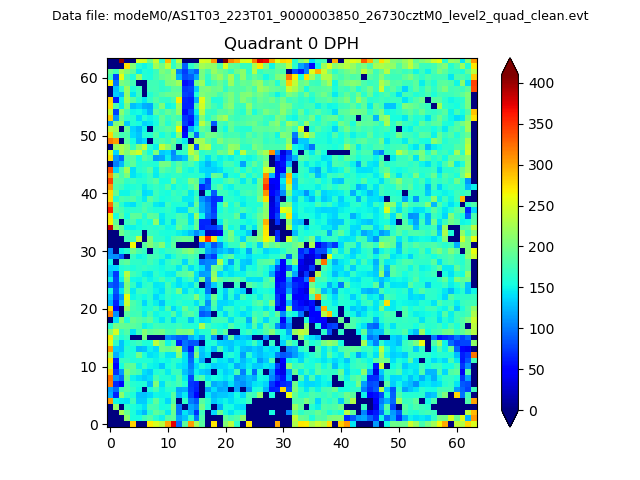 |
 |
Quadrant B |
|---|---|---|---|
| Quadrant D | 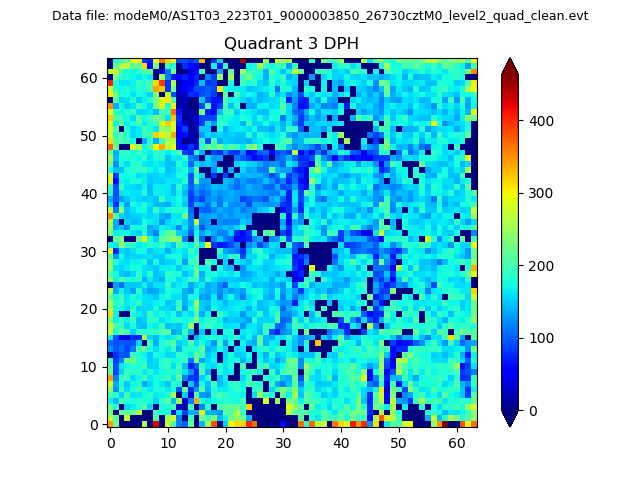 |
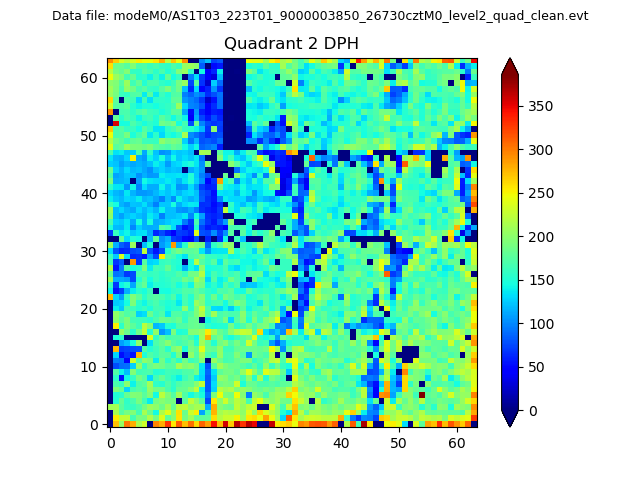 |
Quadrant C |
| Plot type | Count rate plots | Images |
|---|---|---|
| Comparison with Poisson distribution Blue bars denote a histogram of data divided into 1 sec bins. Red curve is a Poisson curve with rate = median count rate of data. |
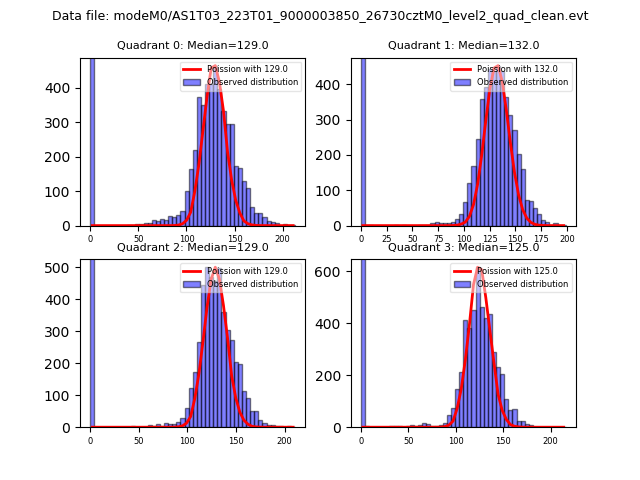 |
 |
| Quadrant-wise count rates Data is divided into 100 sec bins |
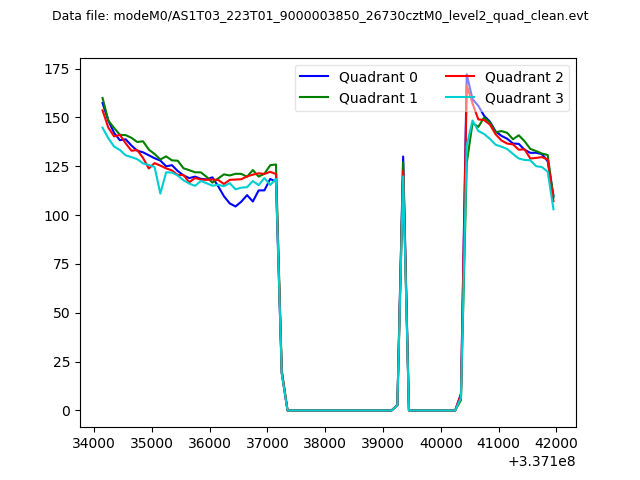 |
|
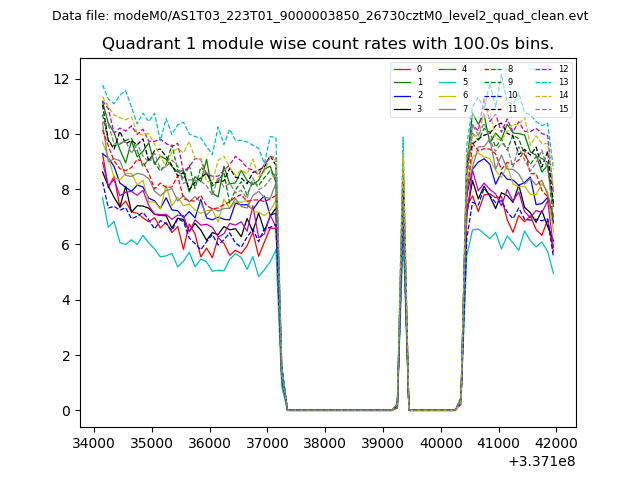
| Module-wise count rates for Quadrant A Data is divided into 100 sec bins |
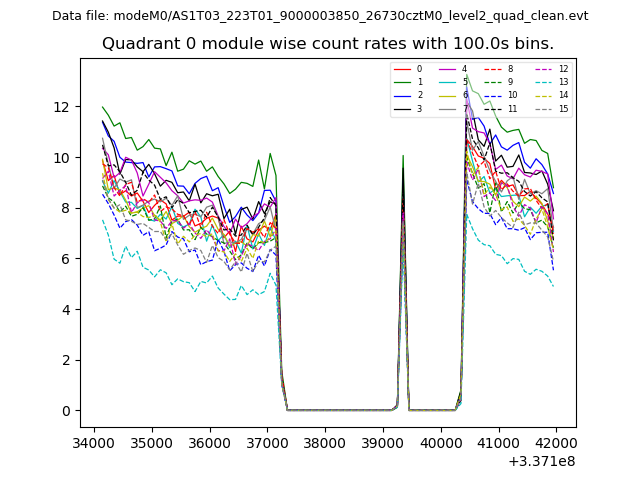 |
 |
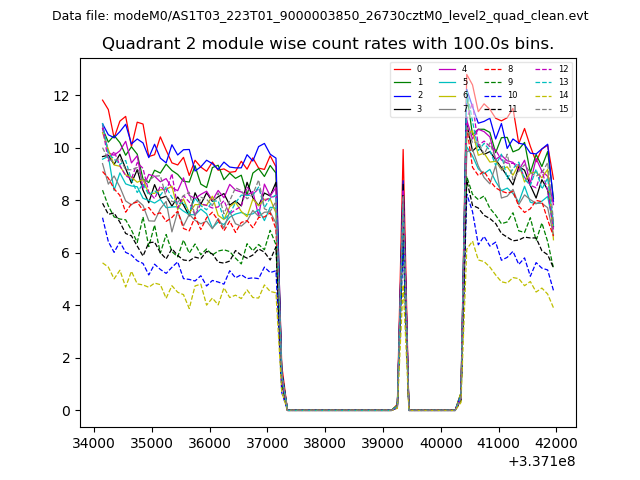
| Module-wise count rates for Quadrant B Data is divided into 100 sec bins |
 |
 |
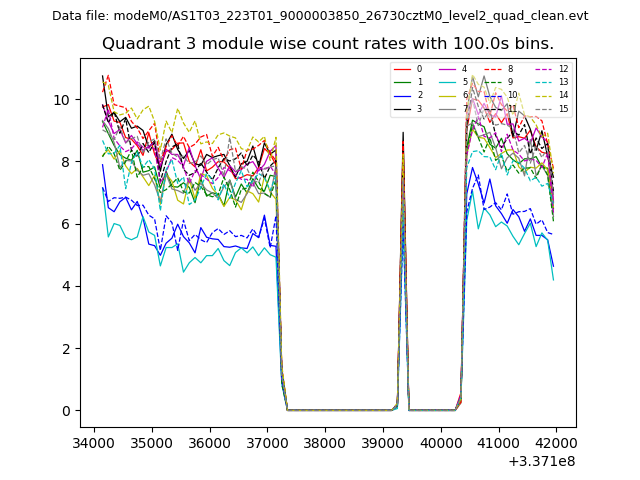
| Module-wise count rates for Quadrant C Data is divided into 100 sec bins |
 |
 |
| Module-wise count rates for Quadrant D Data is divided into 100 sec bins |
 |
 |
| Parameter | Plot |
|---|---|
| CZT HV Monitor | 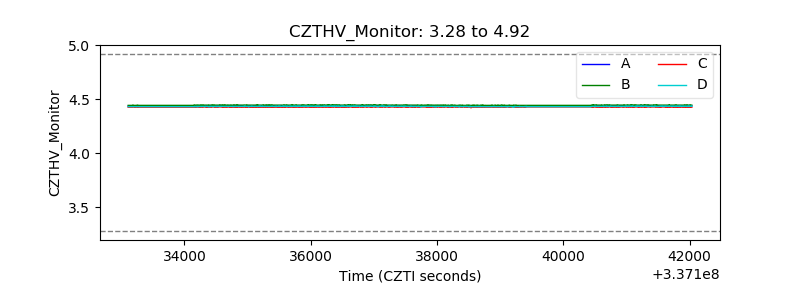 |
| D_VDD | 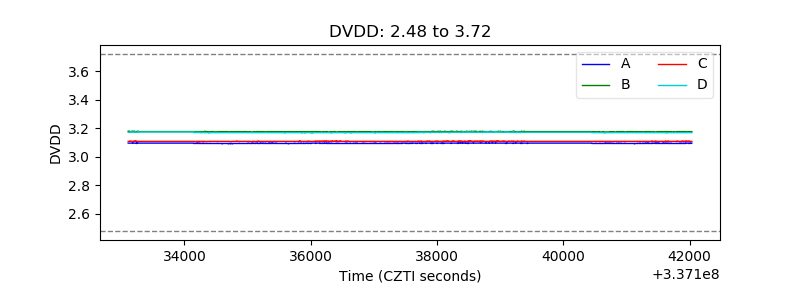 |
| Temperature 1 | 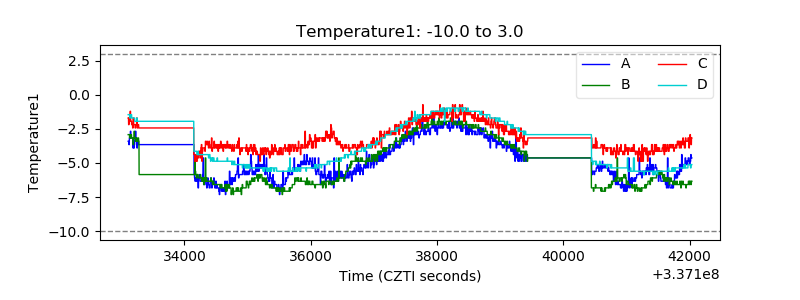 |
| Veto HV Monitor |  |
| Veto LLD | 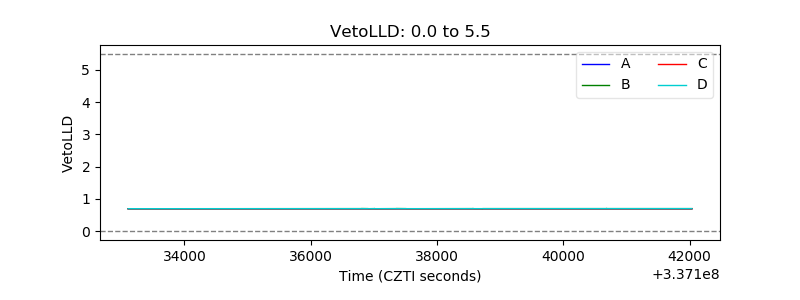 |
| Alpha Counter | 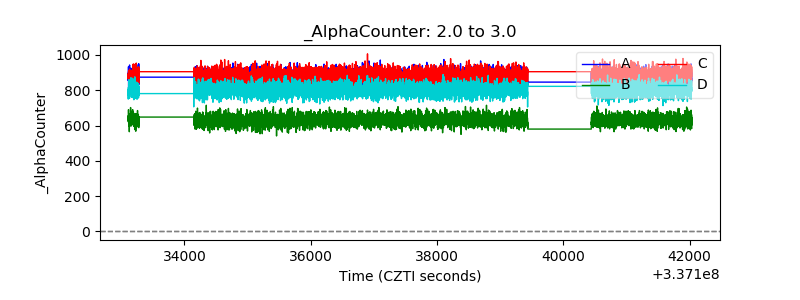 |
| _CPM_Rate | 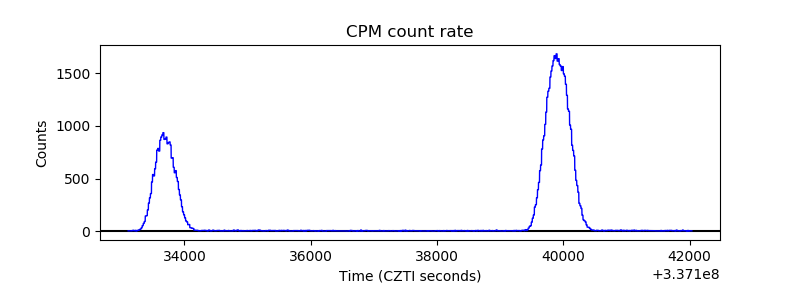 |
| CZT Counter | 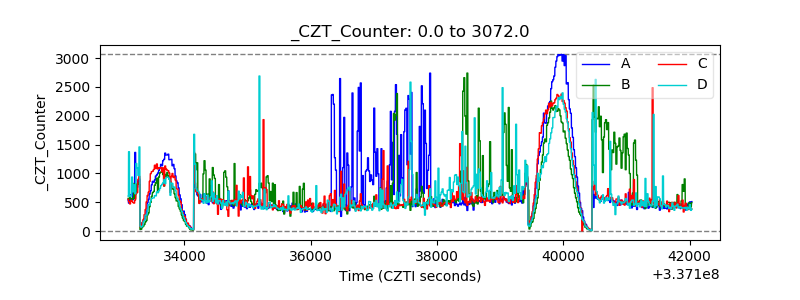 |
| +2.5 Volts monitor | 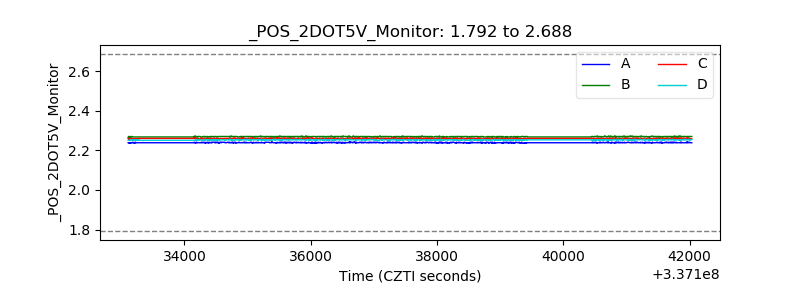 |
| +5 Volts monitor |  |
| _ROLL_ROT | 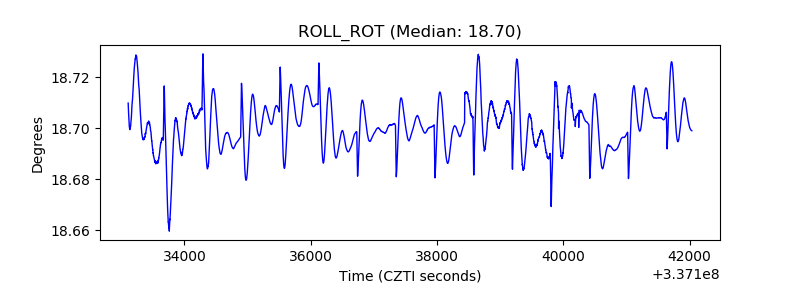 |
| _Roll_DEC | 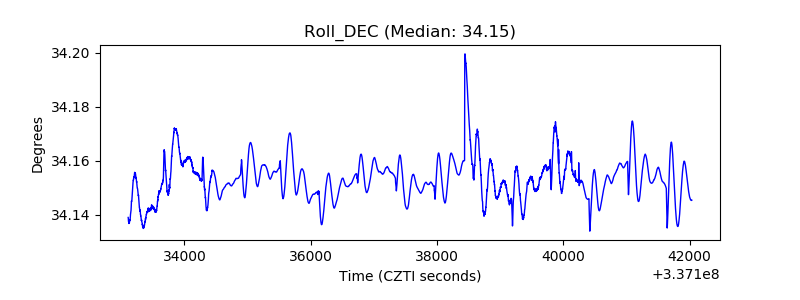 |
| _Roll_RA |  |
| Veto Counter | 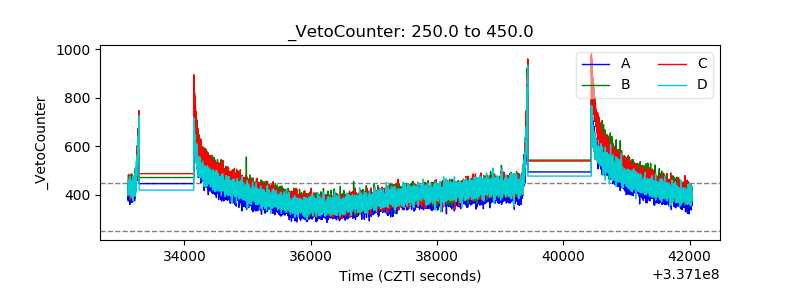 |