| Param | Original file | Final file |
|---|---|---|
| Filename | modeM0/AS1T03_223T01_9000003850_26733cztM0_level2.evt | modeM0/AS1T03_223T01_9000003850_26733cztM0_level2_quad_clean.evt |
| Size (bytes) | 1,102,619,520 | 150,416,640 |
| Size | 1.0 GB | 143.4 MB |
| Events in quadrant A | 5,517,367 | 993,289 |
| Events in quadrant B | 12,139,124 | 941,948 |
| Events in quadrant C | 5,823,196 | 961,004 |
| Events in quadrant D | 9,175,888 | 901,893 |
| Mode M9 | |||
|---|---|---|---|
| Quadrant | BADHDUFLAG | Total packets | Discarded packets |
| A | 0 | 23 | 2 |
| B | 0 | 23 | 1 |
| C | 0 | 23 | 5 |
| D | 0 | 23 | 3 |
| Mode M0 | |||
|---|---|---|---|
| Quadrant | BADHDUFLAG | Total packets | Discarded packets |
| A | 0 | 23164 | 0 |
| B | 0 | 43248 | 0 |
| C | 0 | 24053 | 0 |
| D | 0 | 34623 | 0 |
| Quadrant | Total seconds | Saturated seconds | Saturation percentage |
|---|---|---|---|
| A | 10927 | 58 | 0.530795% |
| B | 10895 | 2370 | 21.753098% |
| C | 10927 | 168 | 1.537476% |
| D | 10881 | 1004 | 9.227093% |
Noise dominated data is calculated using 1-second bins in cleaned event files. If a bin has >2000 counts, and if more than 50% of those come from <1% of pixels, then it is considered to be noise-dominated and hence unusable.
| Quadrant | # 1 sec bins | Bins with >0 counts | Bins with >2000 counts | High rate bins dominated by noise | Noise dominated (total time) | Noise dominated (detector-on time) | Marked lightcurve |
|---|---|---|---|---|---|---|---|
| A | 13635 | 10984 | 12 | 12 | 0.09% | 0.11% | 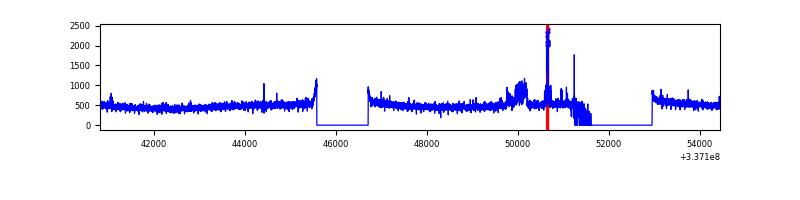 |
| B | 13636 | 10957 | 1775 | 1775 | 13.02% | 16.20% | 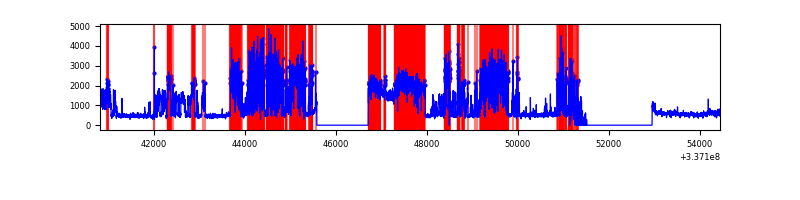 |
| C | 13636 | 10996 | 32 | 32 | 0.23% | 0.29% | 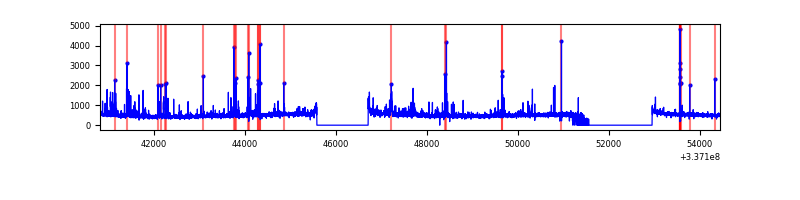 |
| D | 13635 | 10935 | 748 | 748 | 5.49% | 6.84% | 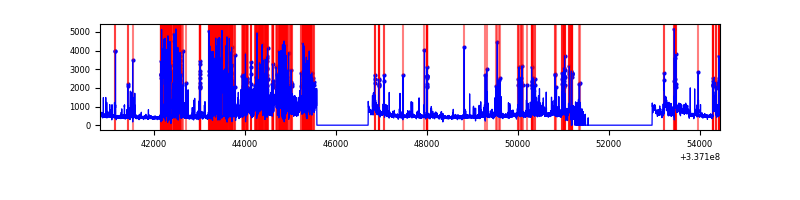 |
Top three noisy pixels from each quadrant. If the there are fewer than three noisy pixels in the level2.evt file, extra rows are filled as -1
| Pixel properties | Quadrant properties | ||||||
|---|---|---|---|---|---|---|---|
| Quadrant | DetID | PixID | Counts | Sigma | Mean | Median | Sigma |
| A | 11 | 29 | 180058 | 655.6 | 1380 | 1356 | 272.6 |
| A | 0 | 13 | 17240 | 58.27 | 1380 | 1356 | 272.6 |
| A | 13 | 254 | 16142 | 54.25 | 1380 | 1356 | 272.6 |
| B | 0 | 189 | 7114215 | 30339.88 | 1260 | 1232 | 234.4 |
| B | 3 | 112 | 55808 | 232.79 | 1260 | 1232 | 234.4 |
| B | 12 | 111 | 27964 | 114.02 | 1260 | 1232 | 234.4 |
| C | 4 | 254 | 343715 | 1130.64 | 1305 | 1313 | 302.8 |
| C | 14 | 238 | 211419 | 693.79 | 1305 | 1313 | 302.8 |
| C | 3 | 233 | 93483 | 304.35 | 1305 | 1313 | 302.8 |
| D | 1 | 52 | 3949608 | 12022.42 | 1255 | 1229 | 328.4 |
| D | 7 | 80 | 289734 | 878.47 | 1255 | 1229 | 328.4 |
| D | 2 | 250 | 81018 | 242.95 | 1255 | 1229 | 328.4 |
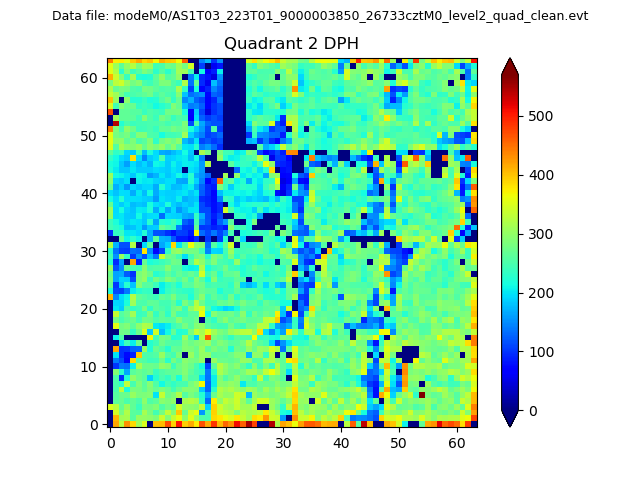
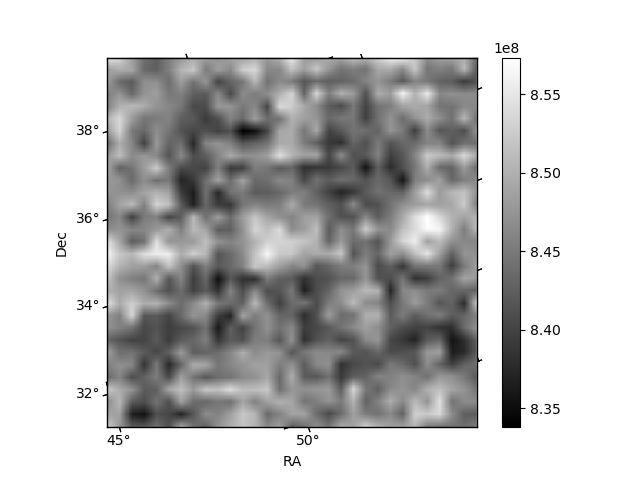
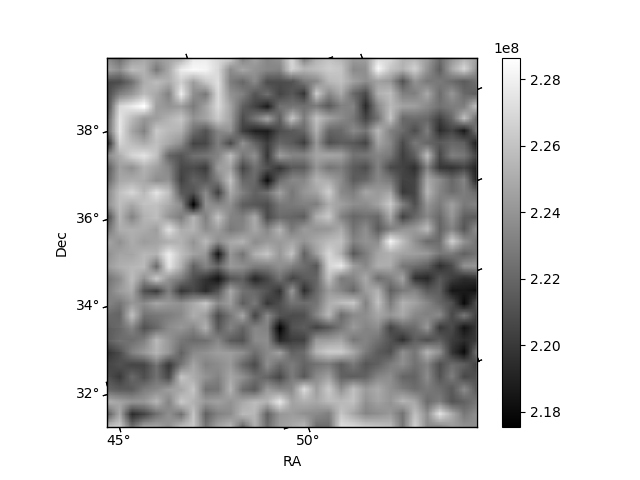
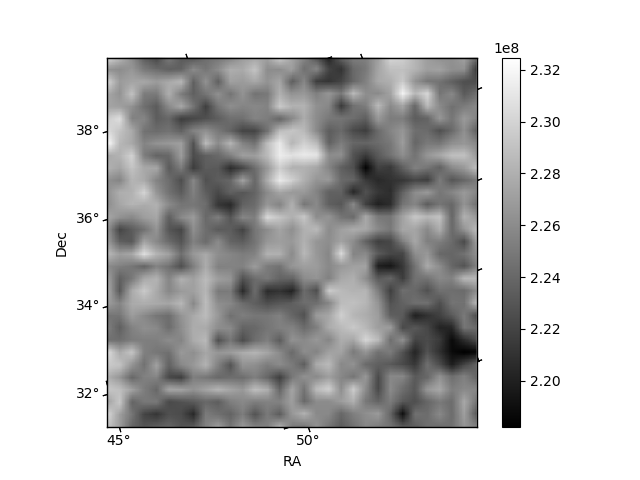
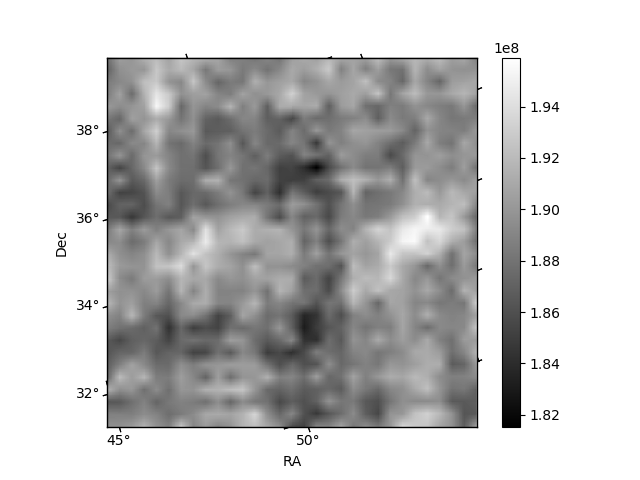
Histogram calculated using DETX and DETY for each event in the final _common_clean file
| Quadrant A | 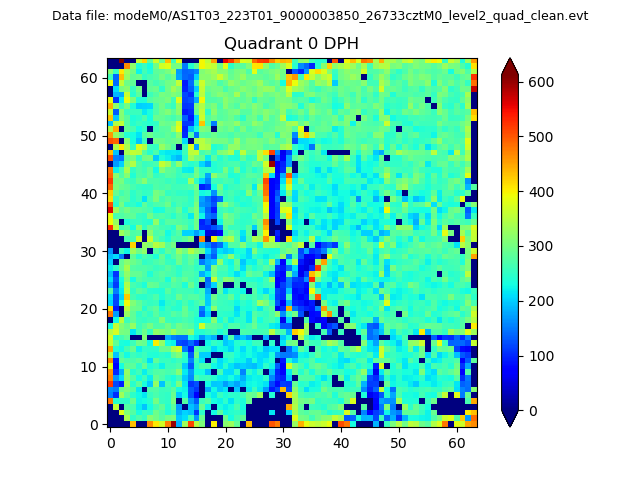 |
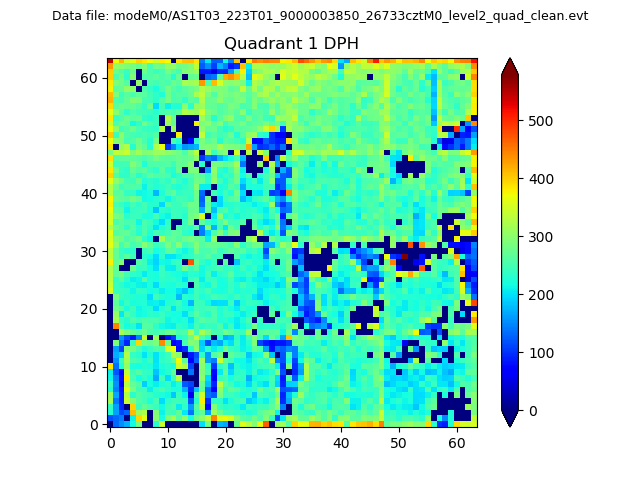 |
Quadrant B |
|---|---|---|---|
| Quadrant D | 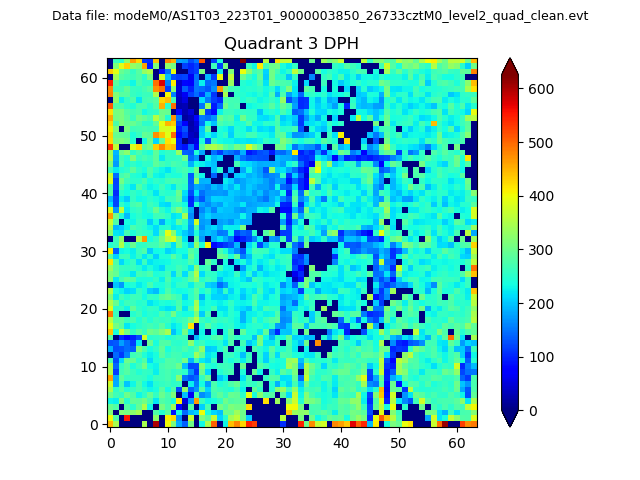 |
 |
Quadrant C |
| Plot type | Count rate plots | Images |
|---|---|---|
| Comparison with Poisson distribution Blue bars denote a histogram of data divided into 1 sec bins. Red curve is a Poisson curve with rate = median count rate of data. |
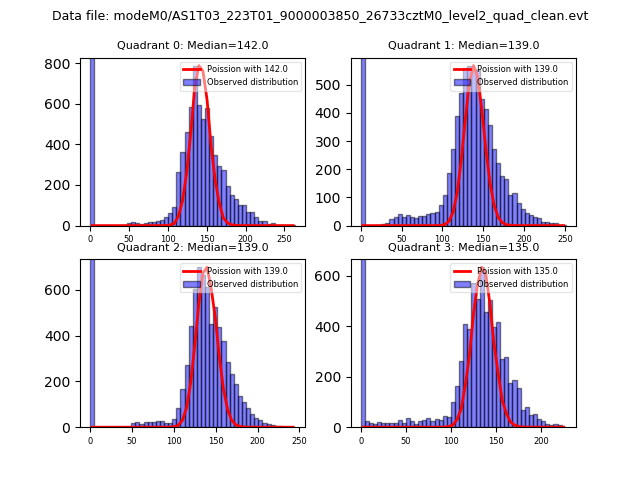 |
 |
| Quadrant-wise count rates Data is divided into 100 sec bins |
 |
|
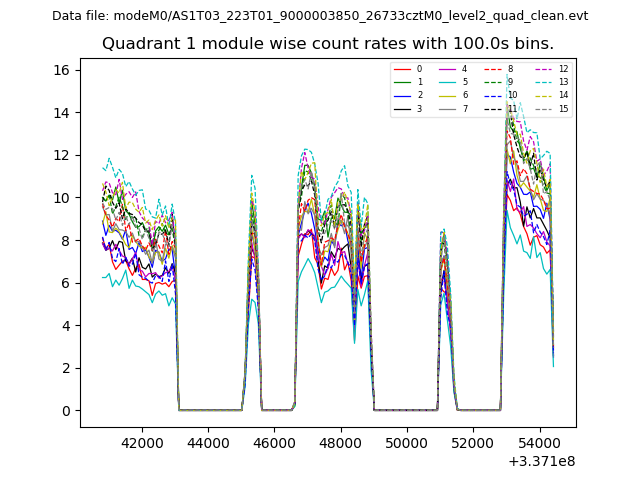
| Module-wise count rates for Quadrant A Data is divided into 100 sec bins |
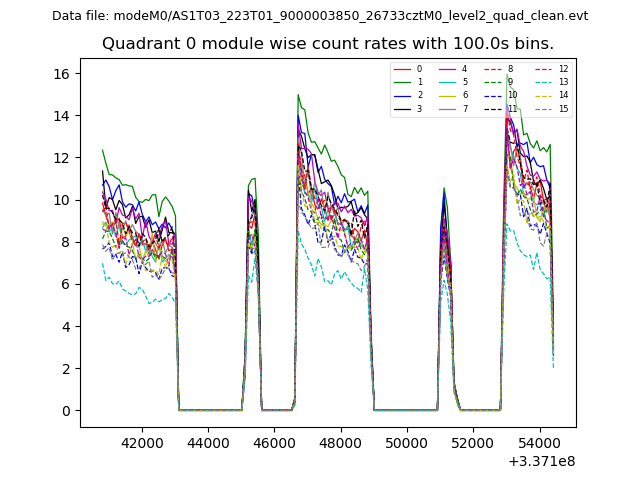 |
 |
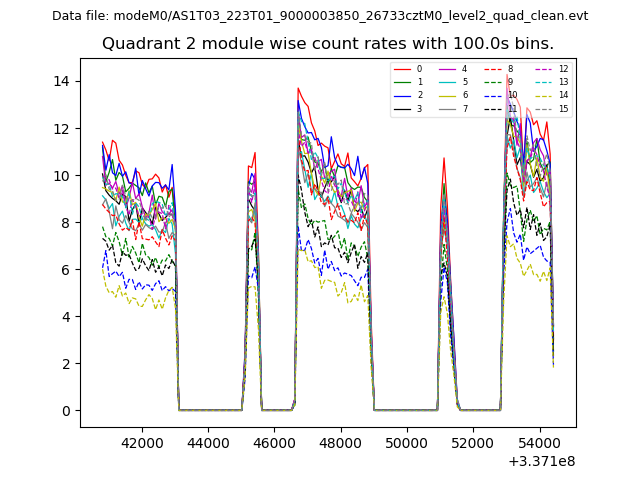
| Module-wise count rates for Quadrant B Data is divided into 100 sec bins |
 |
 |
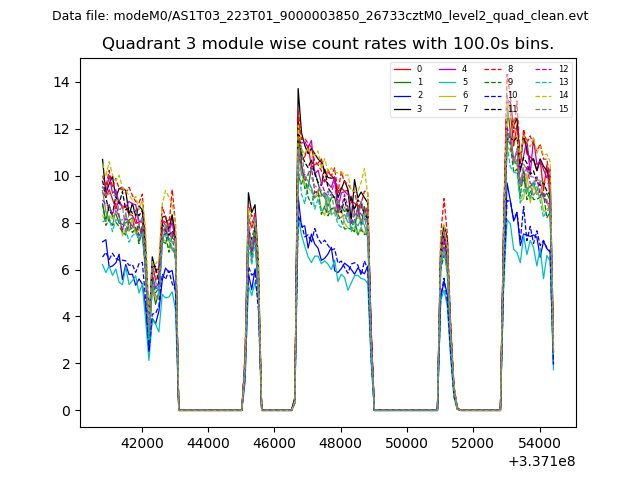
| Module-wise count rates for Quadrant C Data is divided into 100 sec bins |
 |
 |
| Module-wise count rates for Quadrant D Data is divided into 100 sec bins |
 |
 |
| Parameter | Plot |
|---|---|
| CZT HV Monitor | 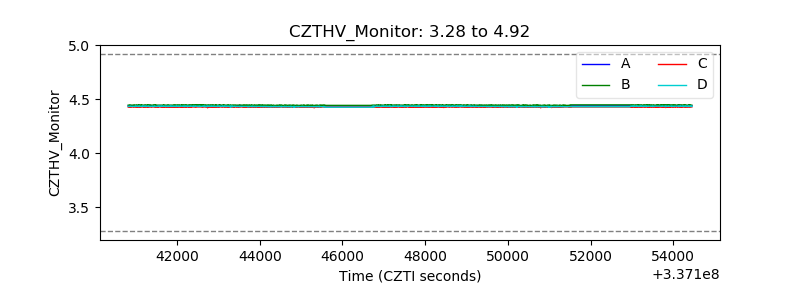 |
| D_VDD | 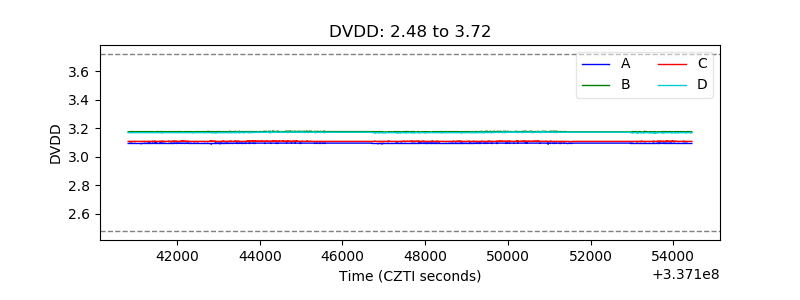 |
| Temperature 1 | 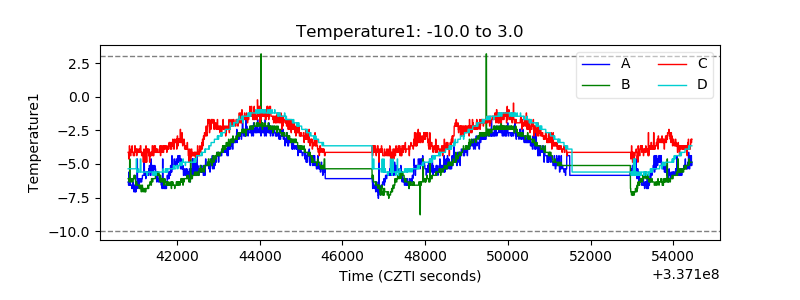 |
| Veto HV Monitor | 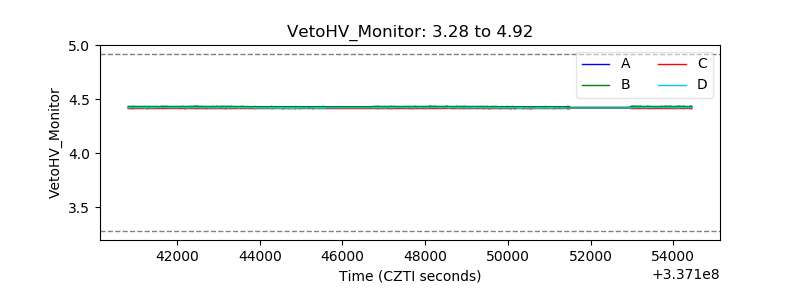 |
| Veto LLD |  |
| Alpha Counter |  |
| _CPM_Rate | 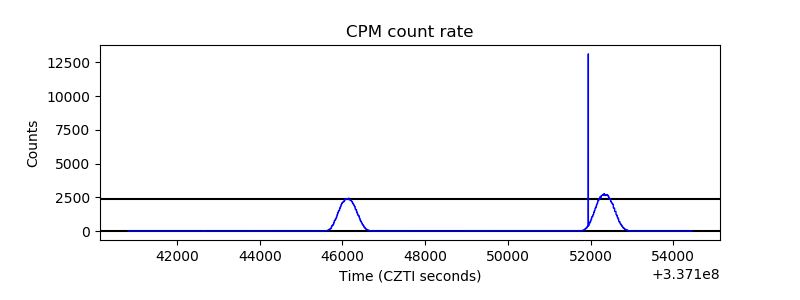 |
| CZT Counter | 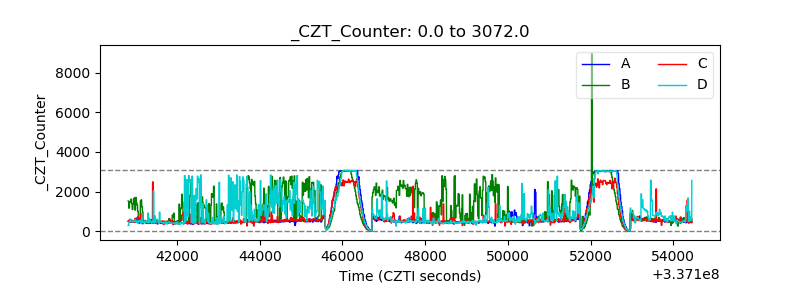 |
| +2.5 Volts monitor | 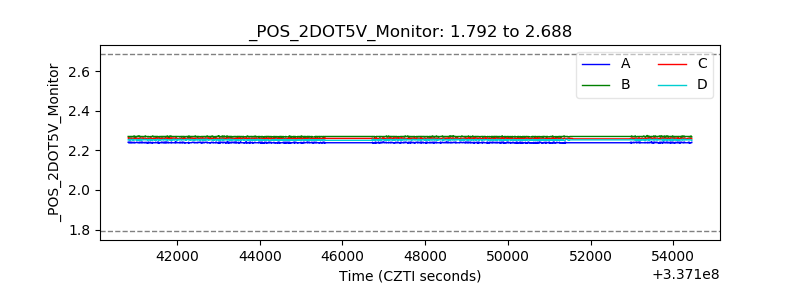 |
| +5 Volts monitor |  |
| _ROLL_ROT | 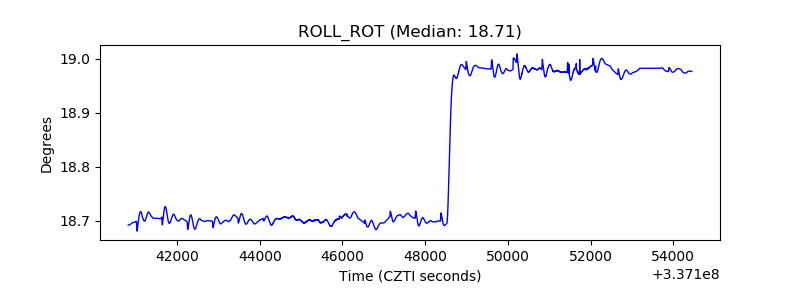 |
| _Roll_DEC | 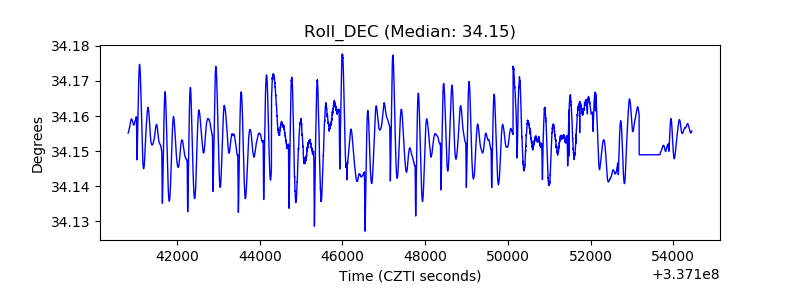 |
| _Roll_RA | 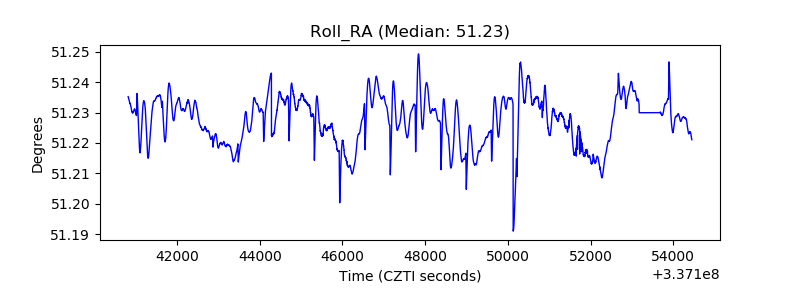 |
| Veto Counter | 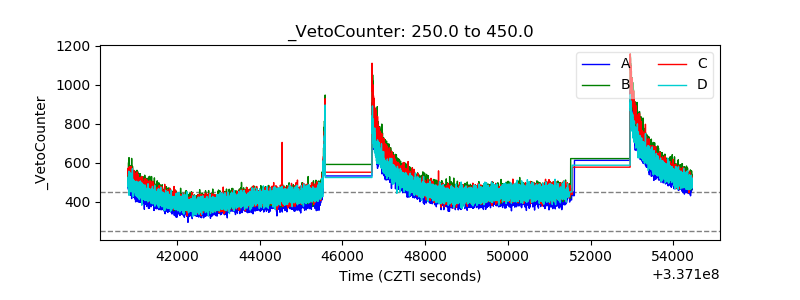 |