| Param | Original file | Final file |
|---|---|---|
| Filename | modeM0/AS1T03_223T01_9000003850_26734cztM0_level2.evt | modeM0/AS1T03_223T01_9000003850_26734cztM0_level2_quad_clean.evt |
| Size (bytes) | 548,470,080 | 91,022,400 |
| Size | 523.1 MB | 86.8 MB |
| Events in quadrant A | 3,161,010 | 608,330 |
| Events in quadrant B | 5,101,905 | 591,960 |
| Events in quadrant C | 3,156,452 | 582,090 |
| Events in quadrant D | 4,794,779 | 565,438 |
| Mode M9 | |||
|---|---|---|---|
| Quadrant | BADHDUFLAG | Total packets | Discarded packets |
| A | 0 | 13 | 0 |
| B | 0 | 13 | 0 |
| C | 0 | 13 | 0 |
| D | 0 | 13 | 0 |
| Mode M0 | |||
|---|---|---|---|
| Quadrant | BADHDUFLAG | Total packets | Discarded packets |
| A | 0 | 12734 | 0 |
| B | 0 | 18734 | 0 |
| C | 0 | 12704 | 0 |
| D | 0 | 18115 | 0 |
| Quadrant | Total seconds | Saturated seconds | Saturation percentage |
|---|---|---|---|
| A | 5850 | 56 | 0.957265% |
| B | 5850 | 904 | 15.452991% |
| C | 5850 | 107 | 1.829060% |
| D | 5851 | 381 | 6.511707% |
Noise dominated data is calculated using 1-second bins in cleaned event files. If a bin has >2000 counts, and if more than 50% of those come from <1% of pixels, then it is considered to be noise-dominated and hence unusable.
| Quadrant | # 1 sec bins | Bins with >0 counts | Bins with >2000 counts | High rate bins dominated by noise | Noise dominated (total time) | Noise dominated (detector-on time) | Marked lightcurve |
|---|---|---|---|---|---|---|---|
| A | 7145 | 5851 | 0 | 0 | 0.00% | 0.00% | 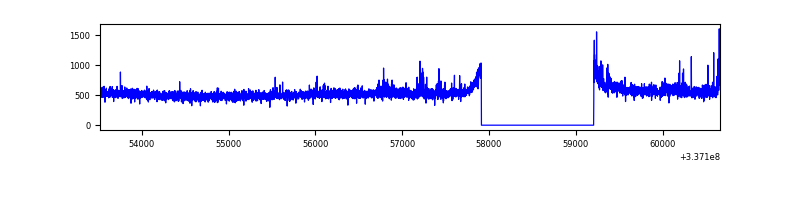 |
| B | 7145 | 5851 | 656 | 656 | 9.18% | 11.21% | 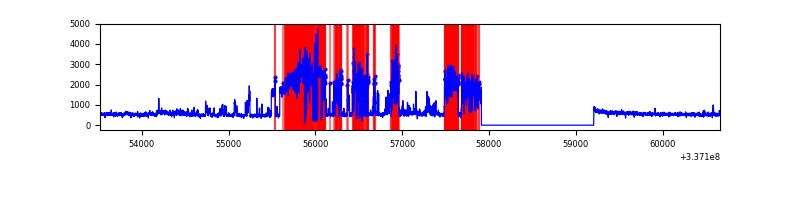 |
| C | 7145 | 5851 | 21 | 21 | 0.29% | 0.36% | 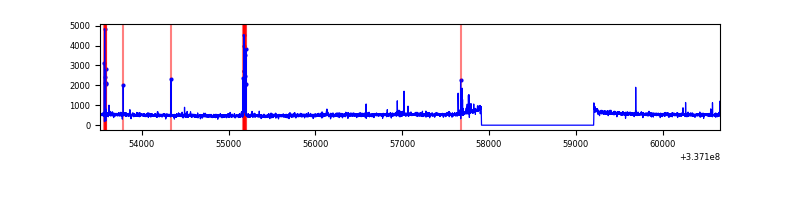 |
| D | 7146 | 5852 | 275 | 275 | 3.85% | 4.70% | 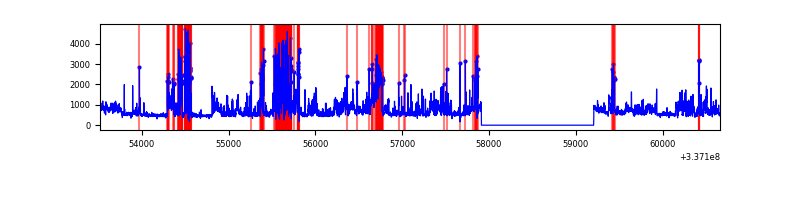 |
Top three noisy pixels from each quadrant. If the there are fewer than three noisy pixels in the level2.evt file, extra rows are filled as -1
| Pixel properties | Quadrant properties | ||||||
|---|---|---|---|---|---|---|---|
| Quadrant | DetID | PixID | Counts | Sigma | Mean | Median | Sigma |
| A | 0 | 13 | 90926 | 577.13 | 796 | 782 | 156.2 |
| A | 13 | 254 | 9131 | 53.45 | 796 | 782 | 156.2 |
| A | 0 | 226 | 6964 | 39.58 | 796 | 782 | 156.2 |
| B | 0 | 189 | 2112117 | 15293.43 | 733 | 716 | 138.1 |
| B | 10 | 246 | 96630 | 694.73 | 733 | 716 | 138.1 |
| B | 12 | 111 | 16076 | 111.26 | 733 | 716 | 138.1 |
| C | 14 | 238 | 122486 | 710.6 | 742 | 748 | 171.3 |
| C | 4 | 254 | 94482 | 547.14 | 742 | 748 | 171.3 |
| C | 15 | 208 | 33560 | 191.53 | 742 | 748 | 171.3 |
| D | 1 | 52 | 1628190 | 8863.03 | 738 | 719 | 183.6 |
| D | 12 | 233 | 307413 | 1670.22 | 738 | 719 | 183.6 |
| D | 2 | 250 | 74524 | 401.93 | 738 | 719 | 183.6 |
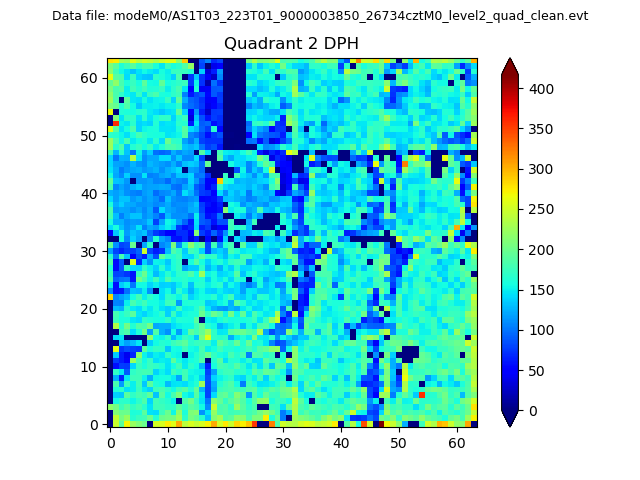
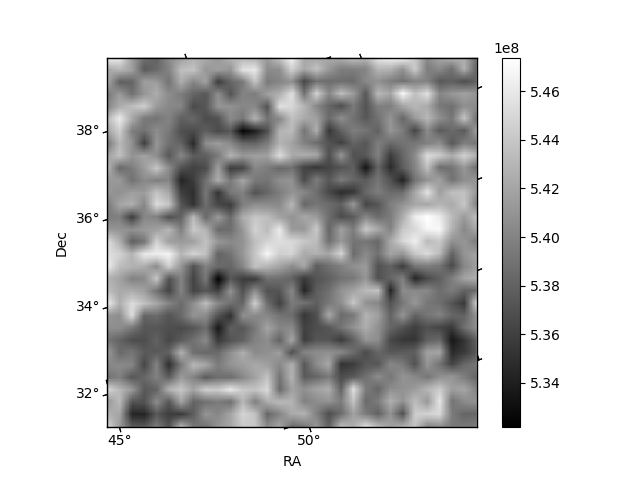
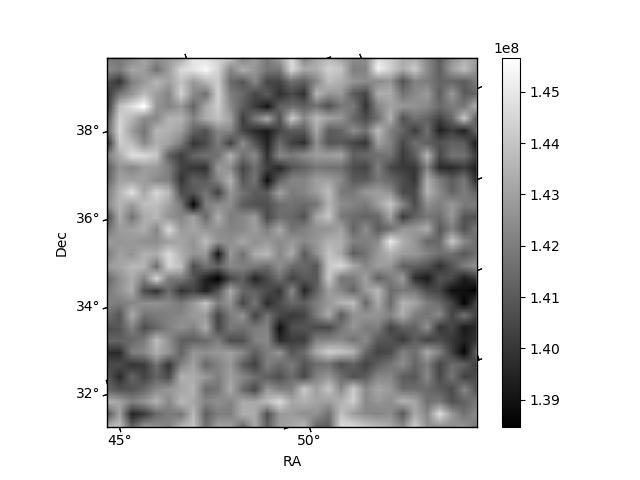
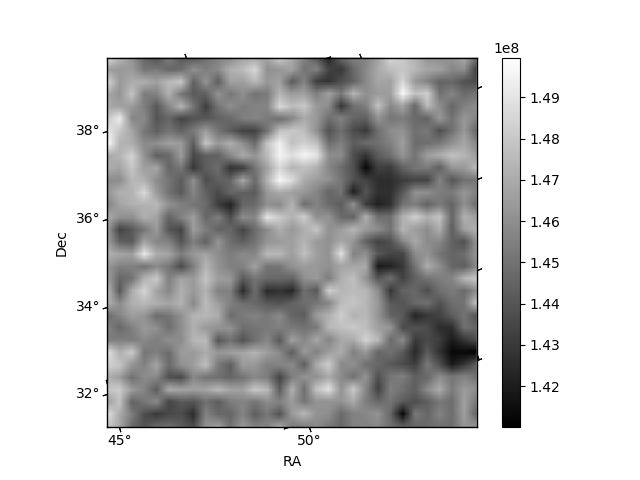
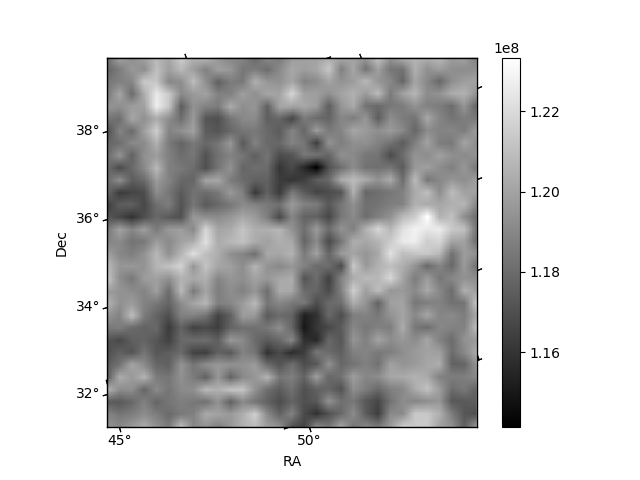
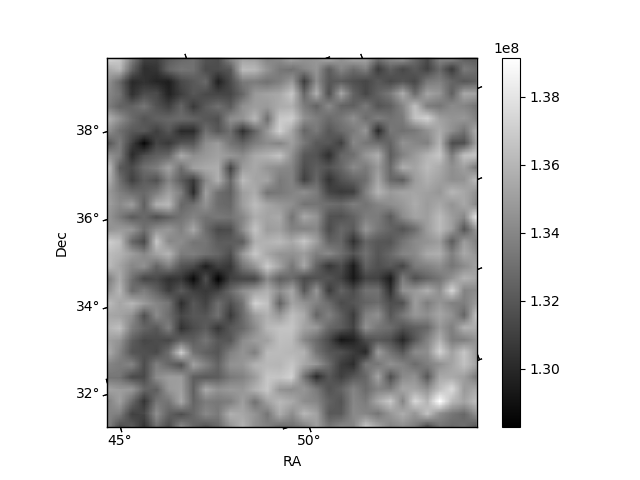
Histogram calculated using DETX and DETY for each event in the final _common_clean file
| Quadrant A | 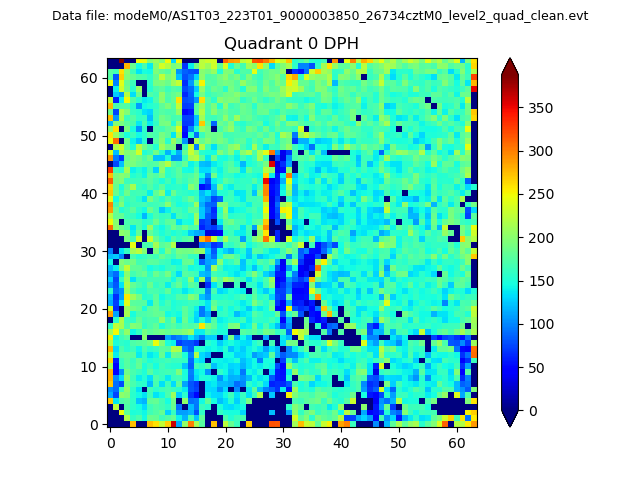 |
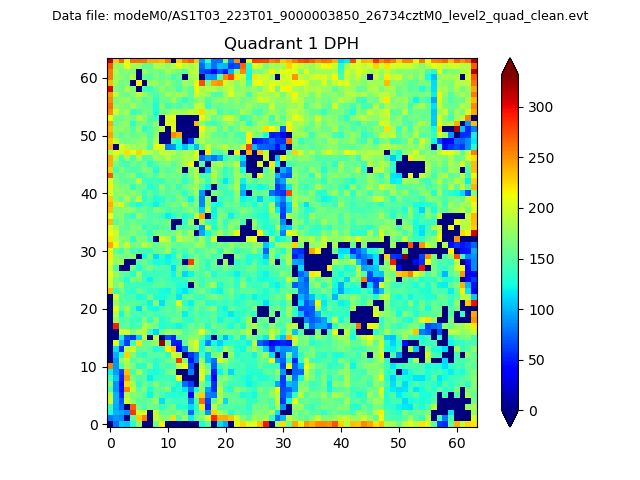 |
Quadrant B |
|---|---|---|---|
| Quadrant D | 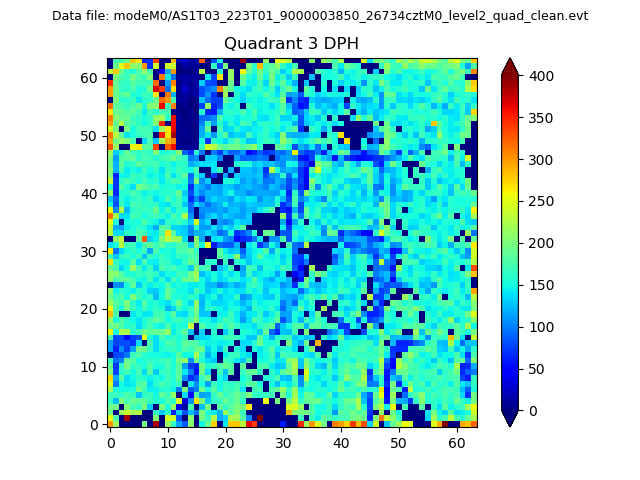 |
 |
Quadrant C |
| Plot type | Count rate plots | Images |
|---|---|---|
| Comparison with Poisson distribution Blue bars denote a histogram of data divided into 1 sec bins. Red curve is a Poisson curve with rate = median count rate of data. |
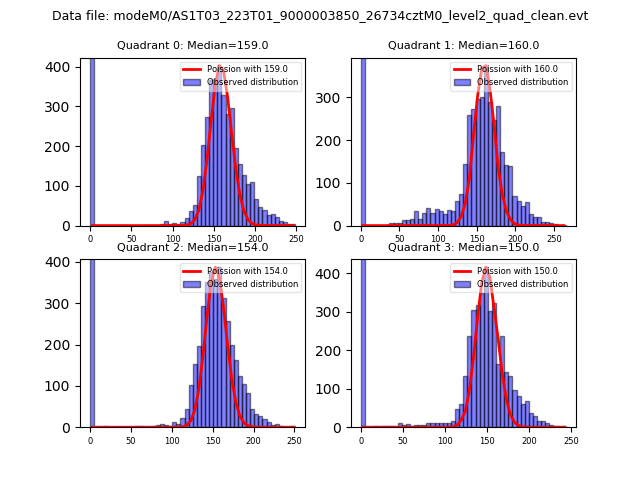 |
 |
| Quadrant-wise count rates Data is divided into 100 sec bins |
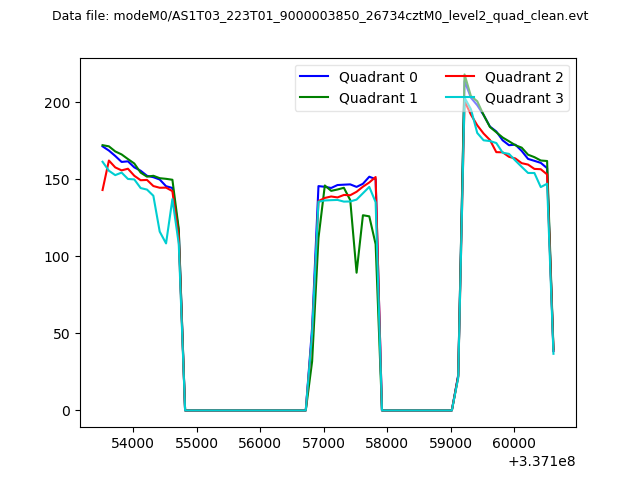 |
|
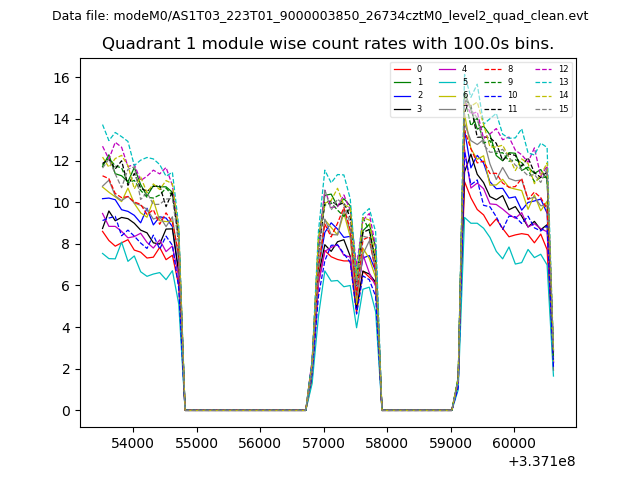
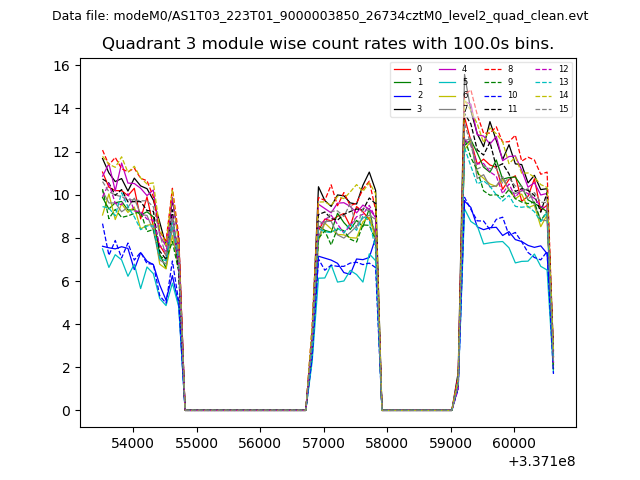
| Module-wise count rates for Quadrant A Data is divided into 100 sec bins |
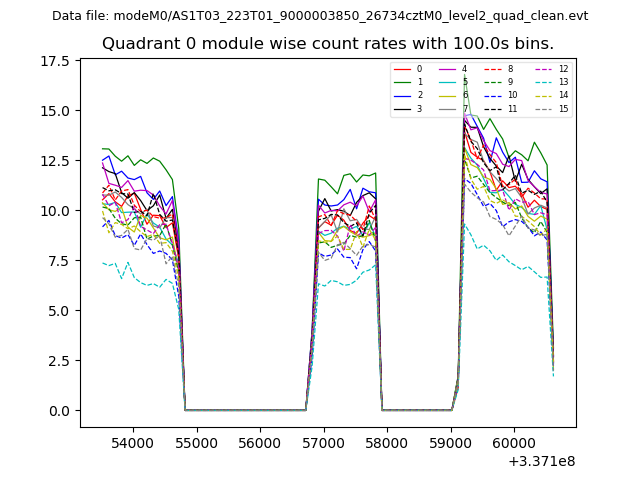 |
 |
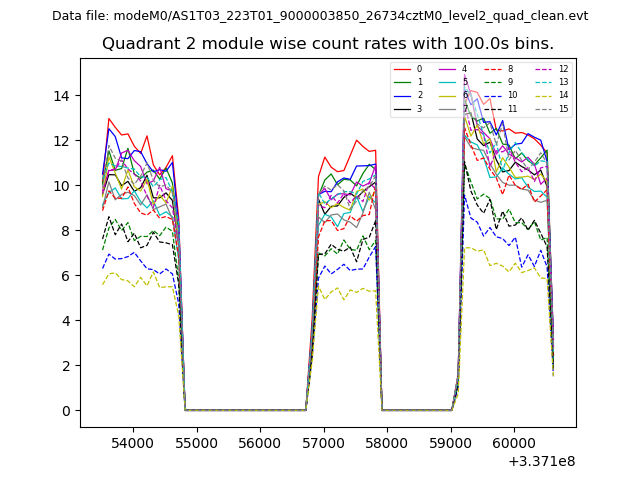
| Module-wise count rates for Quadrant B Data is divided into 100 sec bins |
 |
 |
| Module-wise count rates for Quadrant C Data is divided into 100 sec bins |
 |
 |
| Module-wise count rates for Quadrant D Data is divided into 100 sec bins |
 |
 |
| Parameter | Plot |
|---|---|
| CZT HV Monitor | 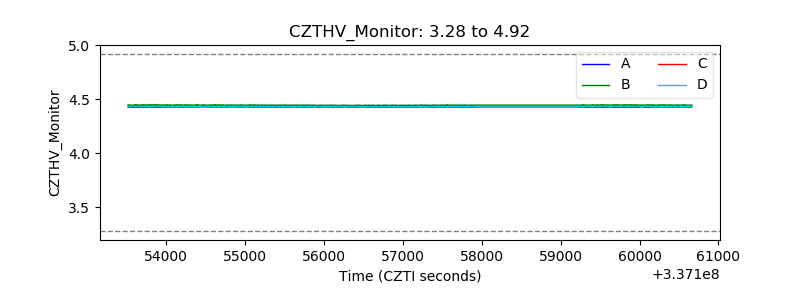 |
| D_VDD | 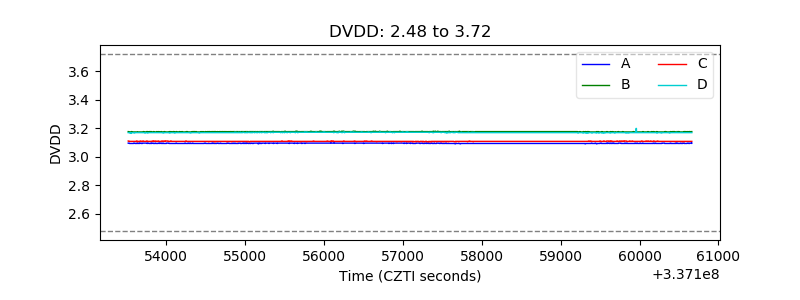 |
| Temperature 1 | 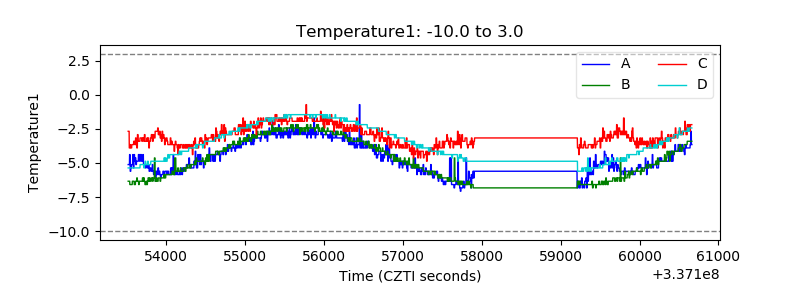 |
| Veto HV Monitor | 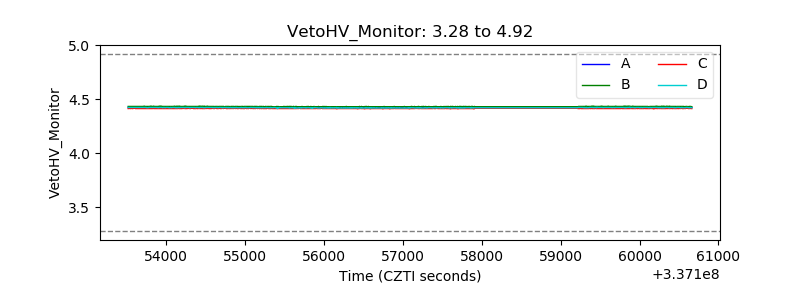 |
| Veto LLD | 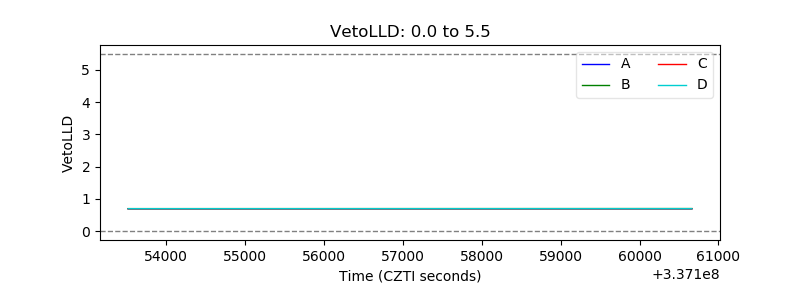 |
| Alpha Counter | 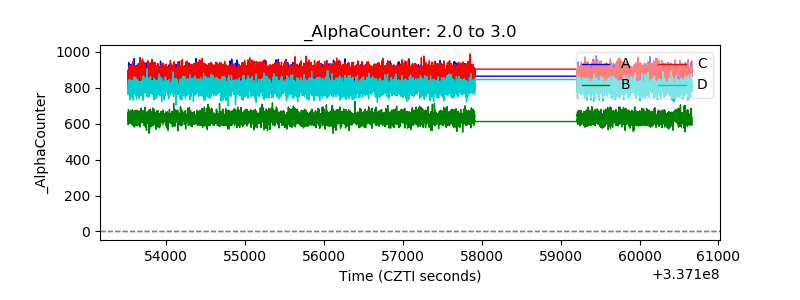 |
| _CPM_Rate | 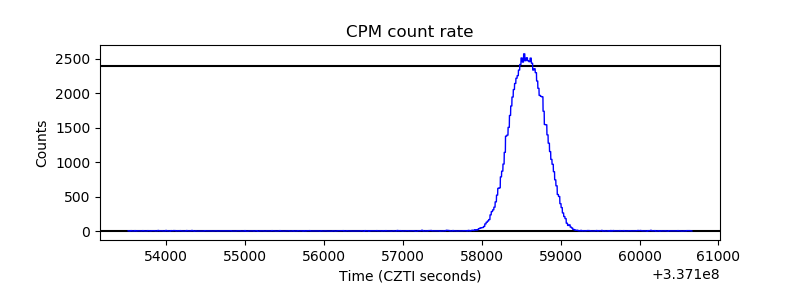 |
| CZT Counter | 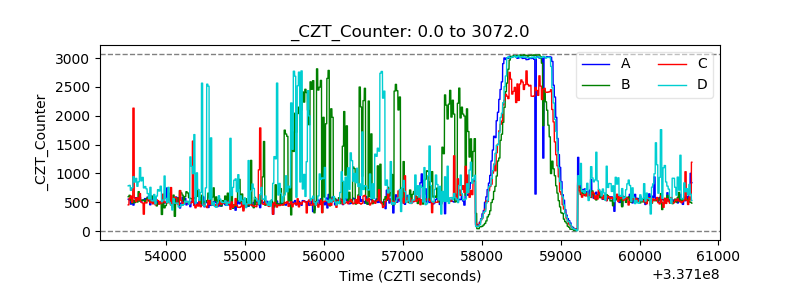 |
| +2.5 Volts monitor | 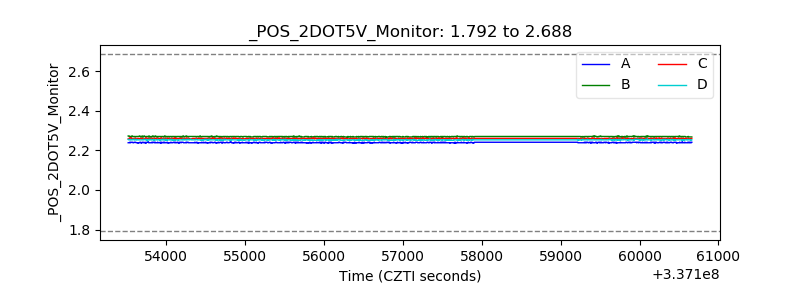 |
| +5 Volts monitor |  |
| _ROLL_ROT | 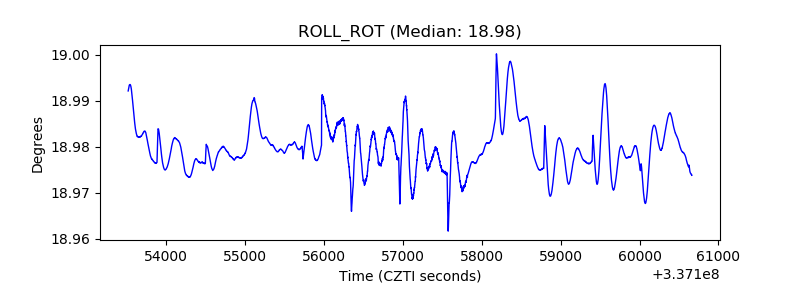 |
| _Roll_DEC | 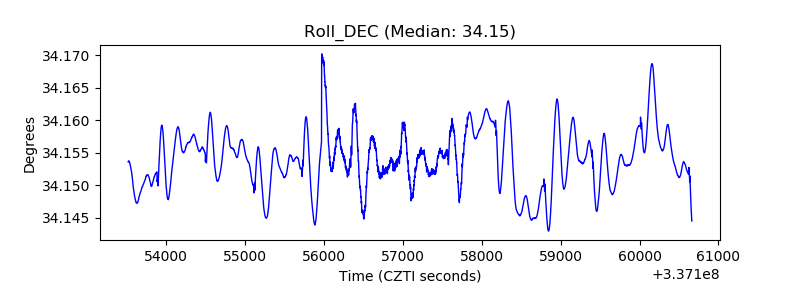 |
| _Roll_RA | 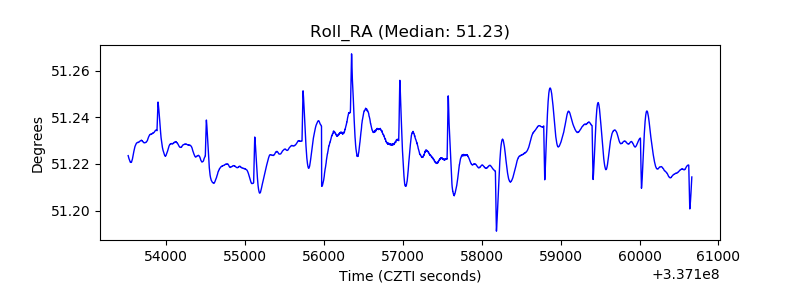 |
| Veto Counter | 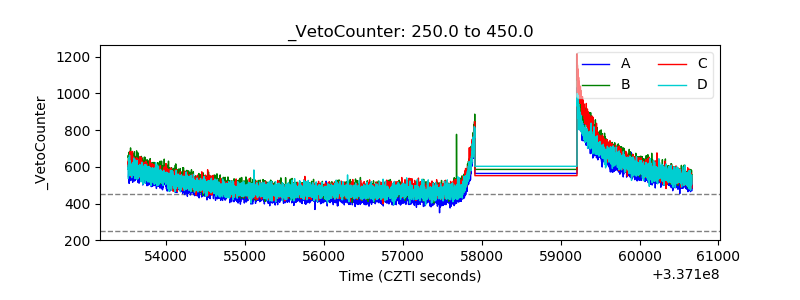 |