| Param | Original file | Final file |
|---|---|---|
| Filename | modeM0/AS1T03_223T01_9000003850_26735cztM0_level2.evt | modeM0/AS1T03_223T01_9000003850_26735cztM0_level2_quad_clean.evt |
| Size (bytes) | 514,082,880 | 91,198,080 |
| Size | 490.3 MB | 87.0 MB |
| Events in quadrant A | 3,579,728 | 600,040 |
| Events in quadrant B | 3,500,483 | 601,806 |
| Events in quadrant C | 3,253,539 | 574,796 |
| Events in quadrant D | 4,825,310 | 562,710 |
| Mode M9 | |||
|---|---|---|---|
| Quadrant | BADHDUFLAG | Total packets | Discarded packets |
| A | 0 | 13 | 0 |
| B | 0 | 13 | 0 |
| C | 0 | 13 | 0 |
| D | 0 | 13 | 0 |
| Mode M0 | |||
|---|---|---|---|
| Quadrant | BADHDUFLAG | Total packets | Discarded packets |
| A | 0 | 14292 | 0 |
| B | 0 | 13832 | 0 |
| C | 0 | 12915 | 0 |
| D | 0 | 18292 | 0 |
| Quadrant | Total seconds | Saturated seconds | Saturation percentage |
|---|---|---|---|
| A | 6044 | 72 | 1.191264% |
| B | 6045 | 111 | 1.836228% |
| C | 6045 | 90 | 1.488834% |
| D | 6044 | 389 | 6.436135% |
Noise dominated data is calculated using 1-second bins in cleaned event files. If a bin has >2000 counts, and if more than 50% of those come from <1% of pixels, then it is considered to be noise-dominated and hence unusable.
| Quadrant | # 1 sec bins | Bins with >0 counts | Bins with >2000 counts | High rate bins dominated by noise | Noise dominated (total time) | Noise dominated (detector-on time) | Marked lightcurve |
|---|---|---|---|---|---|---|---|
| A | 7359 | 6045 | 0 | 0 | 0.00% | 0.00% | 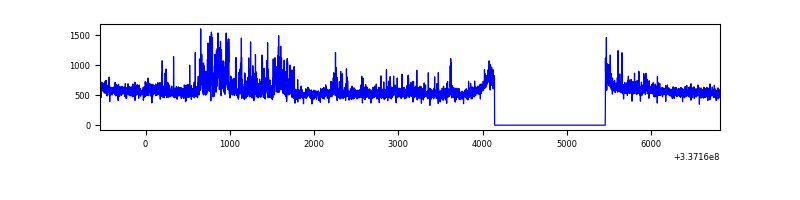 |
| B | 7360 | 6046 | 25 | 25 | 0.34% | 0.41% | 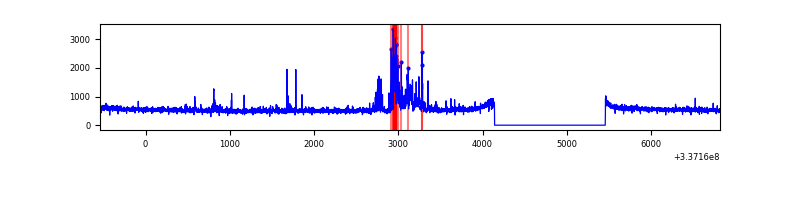 |
| C | 7360 | 6046 | 2 | 2 | 0.03% | 0.03% | 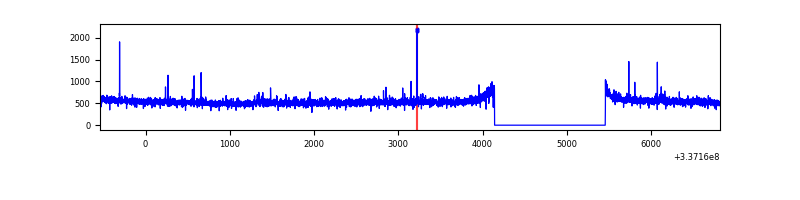 |
| D | 7359 | 6045 | 261 | 261 | 3.55% | 4.32% | 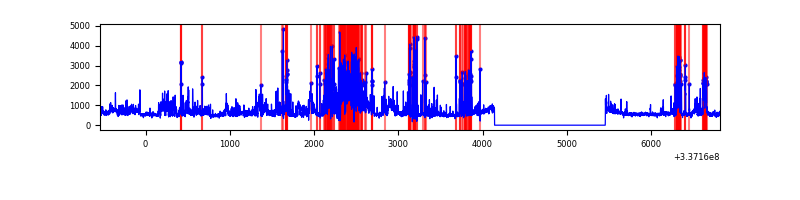 |
Top three noisy pixels from each quadrant. If the there are fewer than three noisy pixels in the level2.evt file, extra rows are filled as -1
| Pixel properties | Quadrant properties | ||||||
|---|---|---|---|---|---|---|---|
| Quadrant | DetID | PixID | Counts | Sigma | Mean | Median | Sigma |
| A | 0 | 13 | 342819 | 2052.41 | 840 | 825 | 166.6 |
| A | 13 | 254 | 9625 | 52.81 | 840 | 825 | 166.6 |
| A | 0 | 226 | 7462 | 39.83 | 840 | 825 | 166.6 |
| B | 10 | 246 | 241532 | 1582.79 | 818 | 801 | 152.1 |
| B | 3 | 112 | 32886 | 210.96 | 818 | 801 | 152.1 |
| B | 12 | 111 | 17760 | 111.5 | 818 | 801 | 152.1 |
| C | 14 | 238 | 129340 | 712.43 | 786 | 792 | 180.4 |
| C | 3 | 233 | 34307 | 185.74 | 786 | 792 | 180.4 |
| C | 15 | 208 | 27651 | 148.86 | 786 | 792 | 180.4 |
| D | 1 | 52 | 1256577 | 5957.27 | 788 | 774 | 210.8 |
| D | 12 | 233 | 335648 | 1588.57 | 788 | 774 | 210.8 |
| D | 2 | 250 | 231718 | 1095.55 | 788 | 774 | 210.8 |
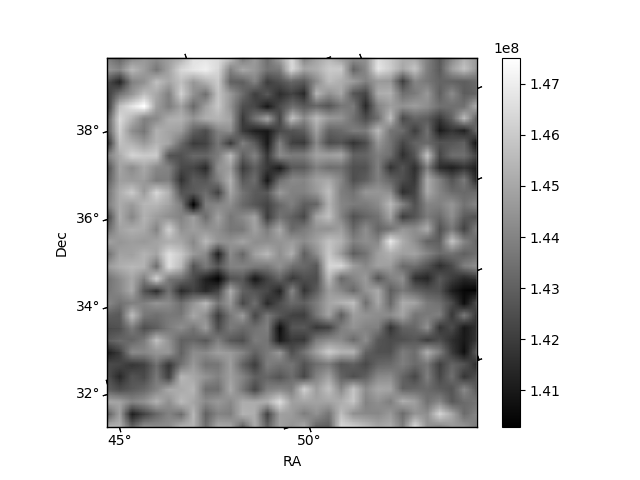
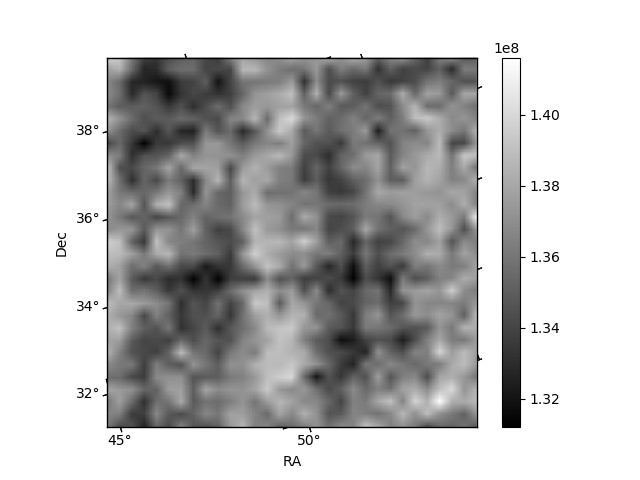
Histogram calculated using DETX and DETY for each event in the final _common_clean file
| Quadrant A | 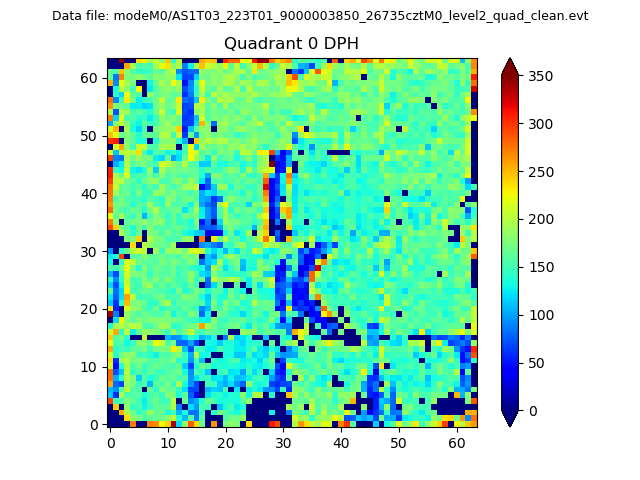 |
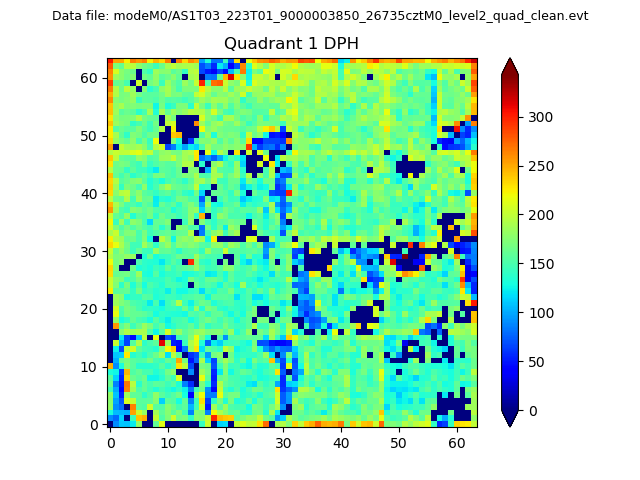 |
Quadrant B |
|---|---|---|---|
| Quadrant D |  |
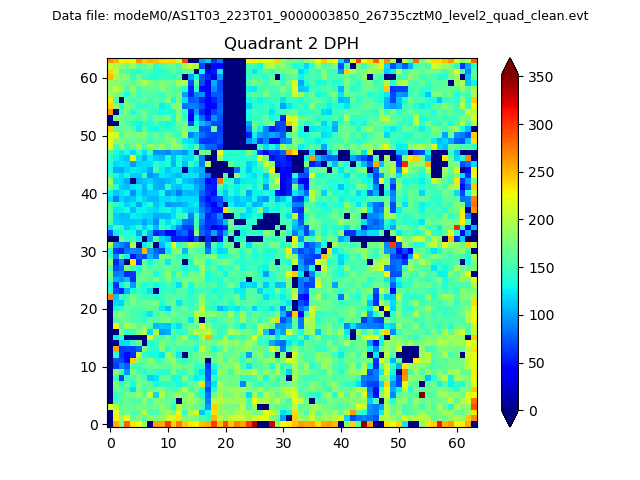 |
Quadrant C |
| Plot type | Count rate plots | Images |
|---|---|---|
| Comparison with Poisson distribution Blue bars denote a histogram of data divided into 1 sec bins. Red curve is a Poisson curve with rate = median count rate of data. |
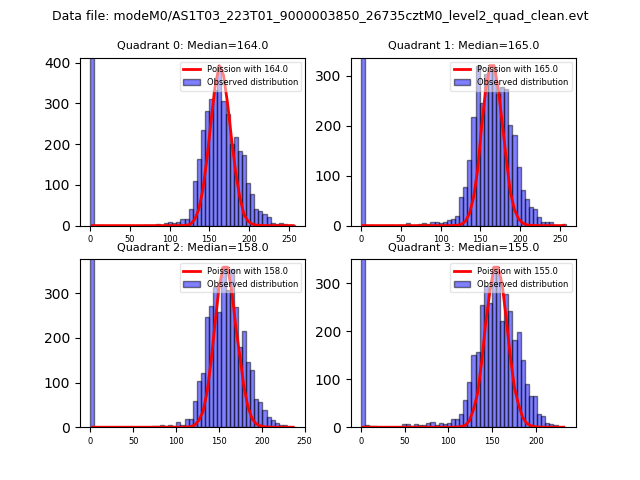 |
 |
| Quadrant-wise count rates Data is divided into 100 sec bins |
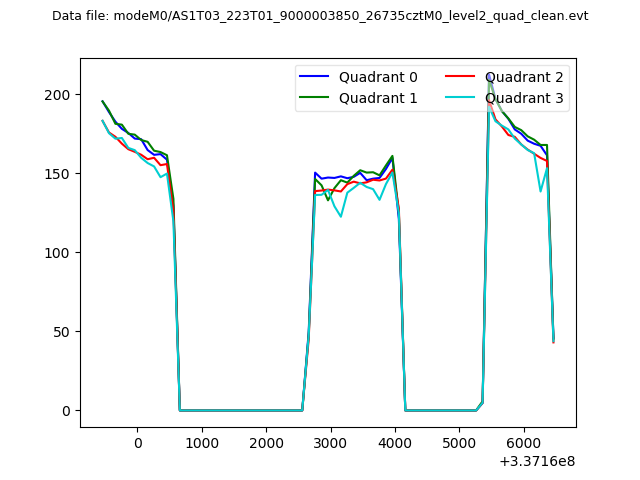 |
|
| Module-wise count rates for Quadrant A Data is divided into 100 sec bins |
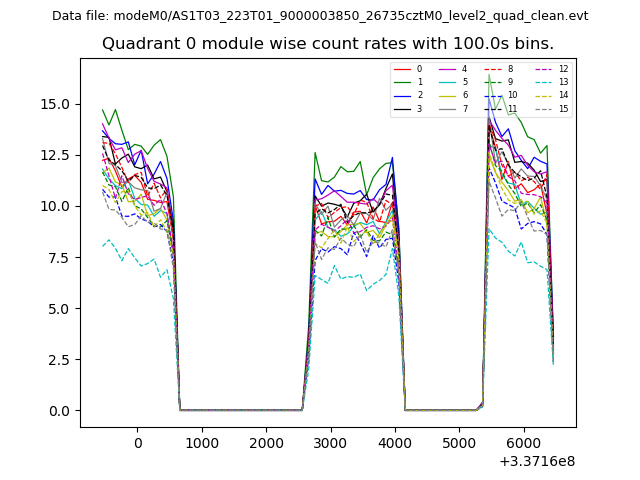 |
 |
| Module-wise count rates for Quadrant B Data is divided into 100 sec bins |
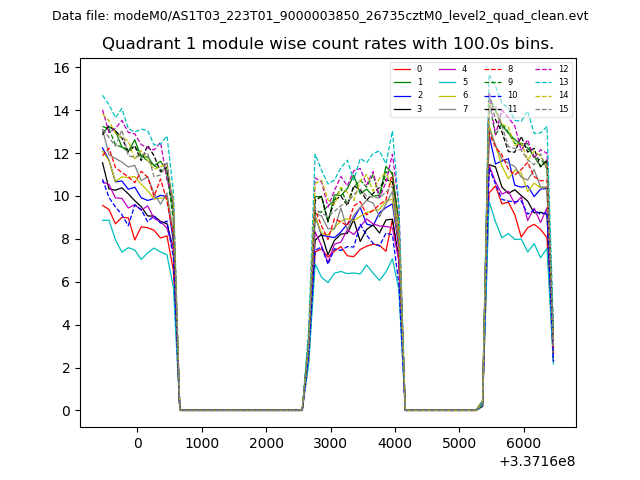 |
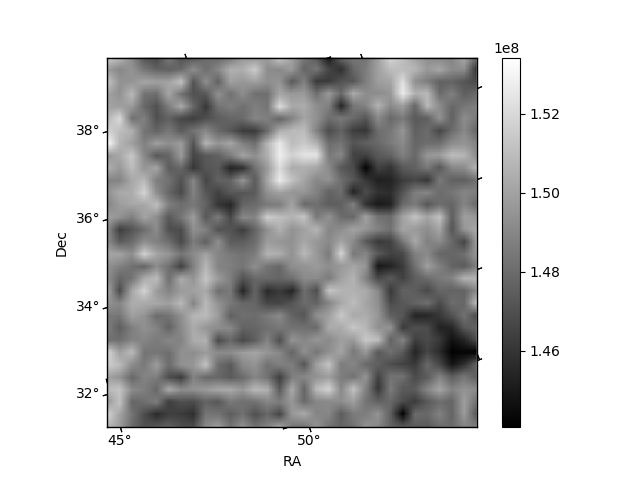 |
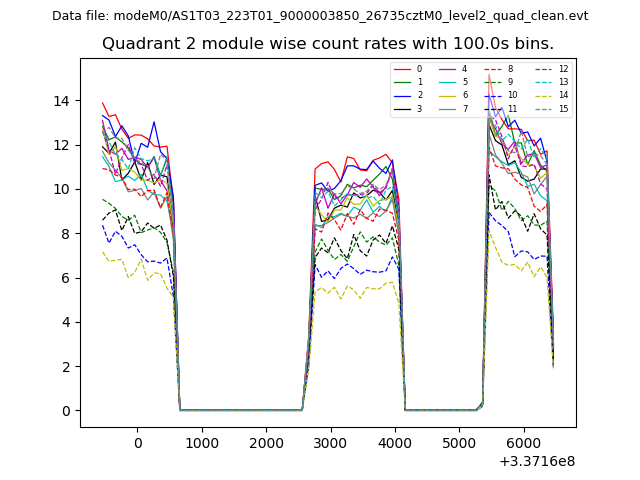
| Module-wise count rates for Quadrant C Data is divided into 100 sec bins |
 |
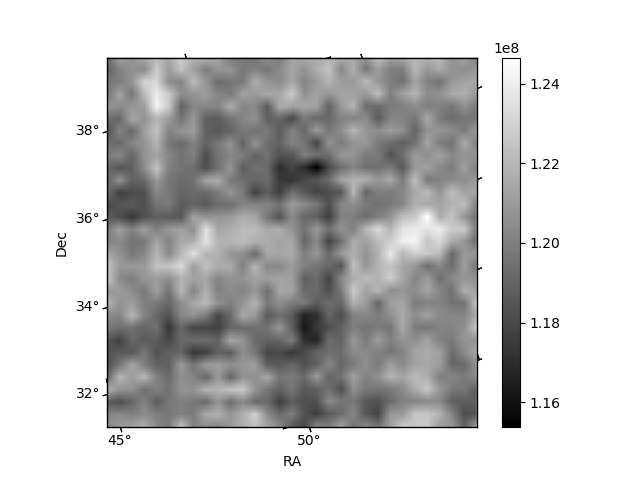 |
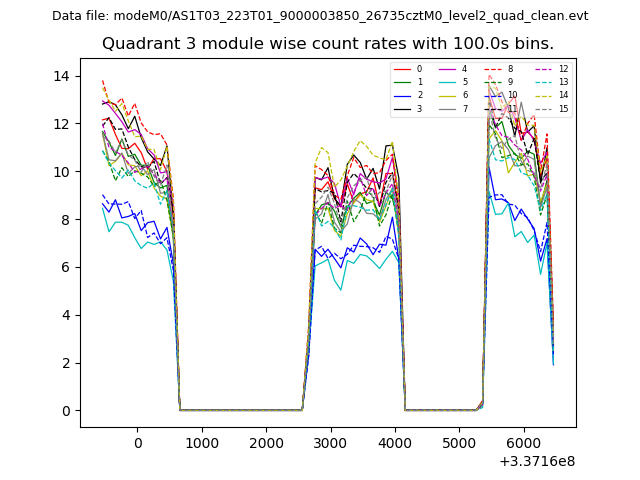
| Module-wise count rates for Quadrant D Data is divided into 100 sec bins |
 |
 |
| Parameter | Plot |
|---|---|
| CZT HV Monitor | 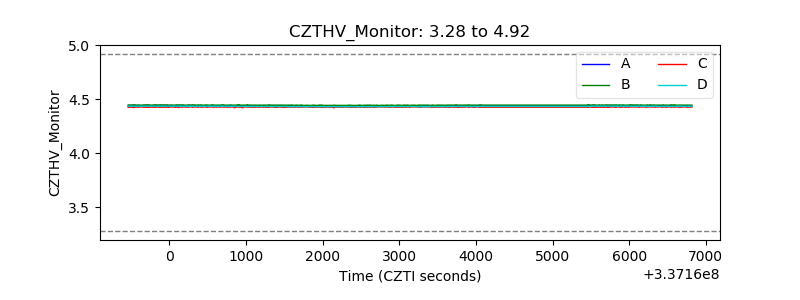 |
| D_VDD | 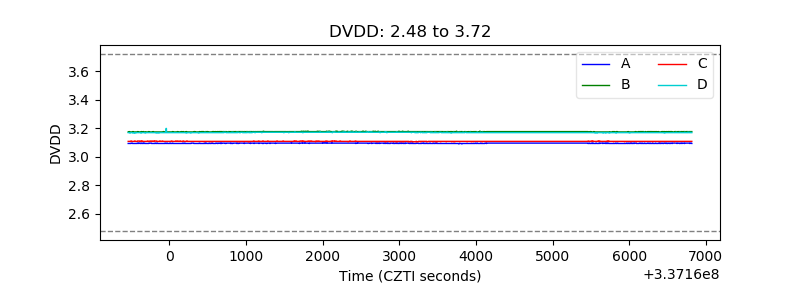 |
| Temperature 1 | 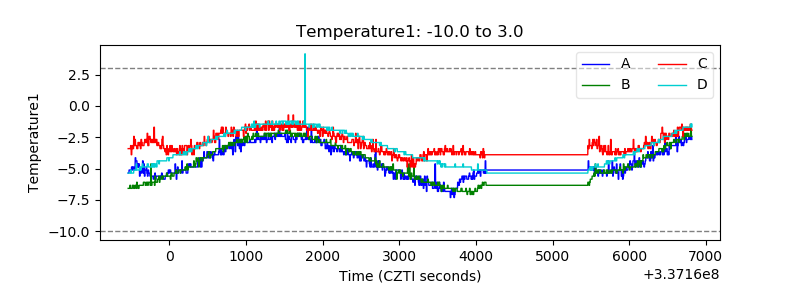 |
| Veto HV Monitor | 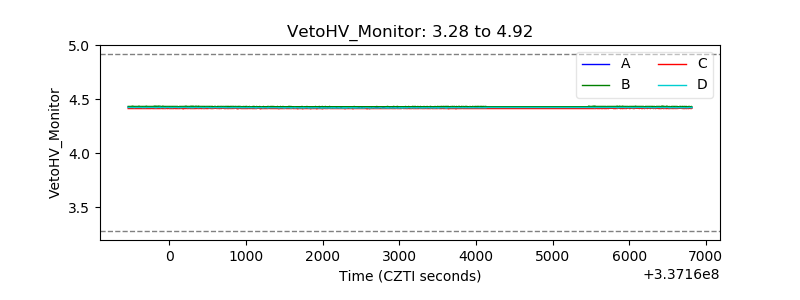 |
| Veto LLD | 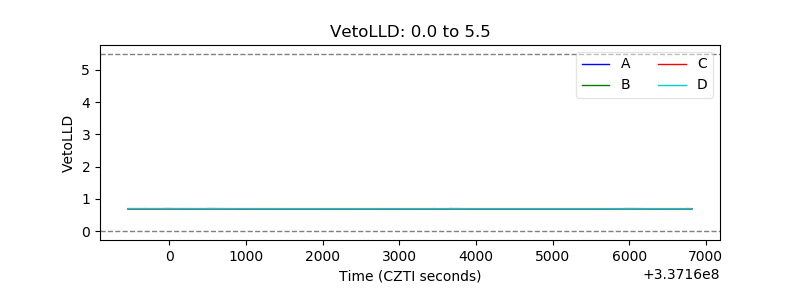 |
| Alpha Counter | 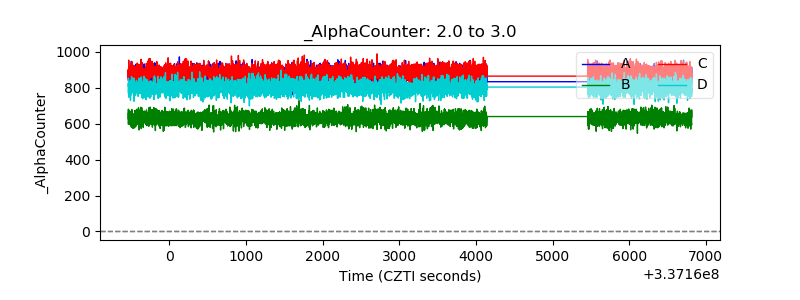 |
| _CPM_Rate |  |
| CZT Counter | 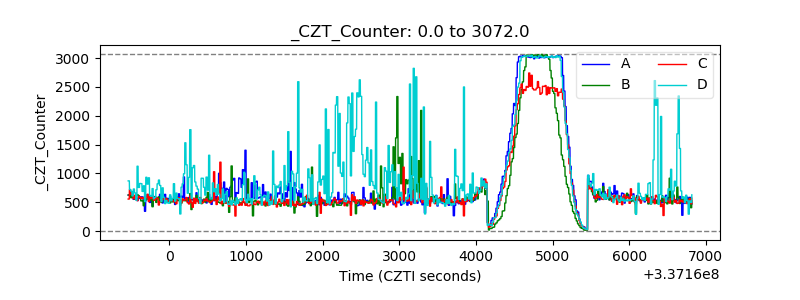 |
| +2.5 Volts monitor |  |
| +5 Volts monitor |  |
| _ROLL_ROT | 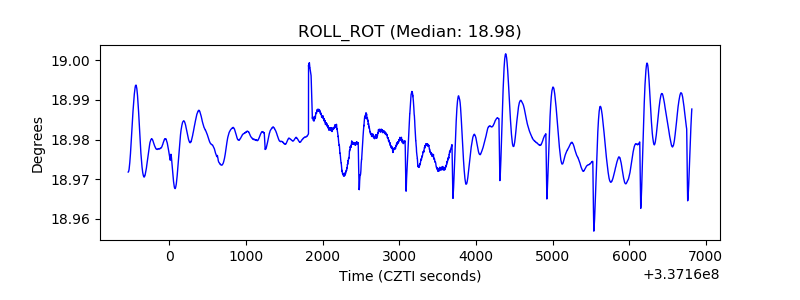 |
| _Roll_DEC | 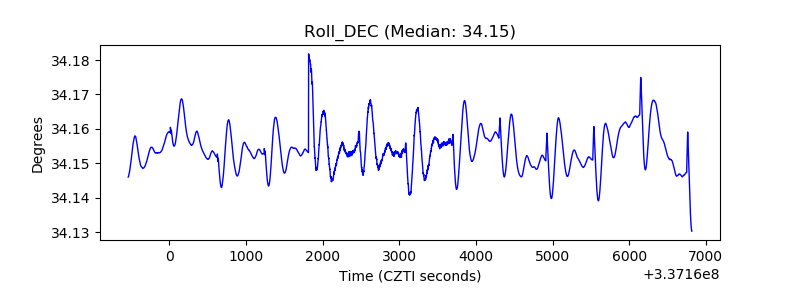 |
| _Roll_RA | 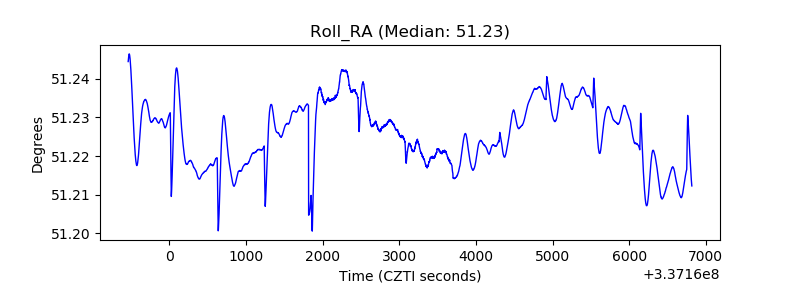 |
| Veto Counter | 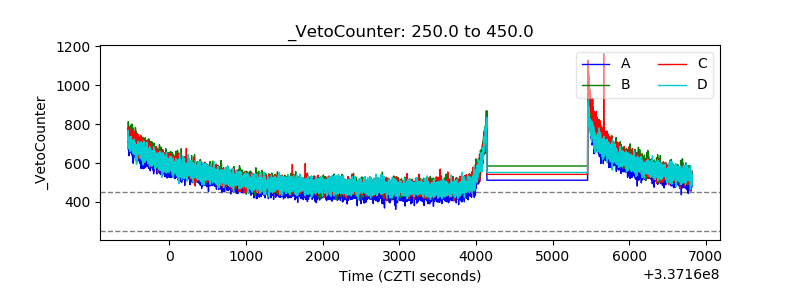 |