| Param | Original file | Final file |
|---|---|---|
| Filename | modeM0/AS1T03_223T01_9000003850_26737cztM0_level2.evt | modeM0/AS1T03_223T01_9000003850_26737cztM0_level2_quad_clean.evt |
| Size (bytes) | 567,374,400 | 80,118,720 |
| Size | 541.1 MB | 76.4 MB |
| Events in quadrant A | 3,518,920 | 498,043 |
| Events in quadrant B | 3,710,467 | 504,514 |
| Events in quadrant C | 3,555,092 | 486,725 |
| Events in quadrant D | 5,934,351 | 459,615 |
| Mode M9 | |||
|---|---|---|---|
| Quadrant | BADHDUFLAG | Total packets | Discarded packets |
| A | 0 | 10 | 0 |
| B | 0 | 11 | 0 |
| C | 0 | 11 | 0 |
| D | 0 | 11 | 0 |
| Mode M0 | |||
|---|---|---|---|
| Quadrant | BADHDUFLAG | Total packets | Discarded packets |
| A | 0 | 14353 | 0 |
| B | 0 | 14912 | 0 |
| C | 0 | 14411 | 0 |
| D | 0 | 21975 | 0 |
| Quadrant | Total seconds | Saturated seconds | Saturation percentage |
|---|---|---|---|
| A | 6848 | 130 | 1.898364% |
| B | 6848 | 191 | 2.789136% |
| C | 6848 | 160 | 2.336449% |
| D | 6848 | 781 | 11.404790% |
Noise dominated data is calculated using 1-second bins in cleaned event files. If a bin has >2000 counts, and if more than 50% of those come from <1% of pixels, then it is considered to be noise-dominated and hence unusable.
| Quadrant | # 1 sec bins | Bins with >0 counts | Bins with >2000 counts | High rate bins dominated by noise | Noise dominated (total time) | Noise dominated (detector-on time) | Marked lightcurve |
|---|---|---|---|---|---|---|---|
| A | 7838 | 6849 | 0 | 0 | 0.00% | 0.00% | 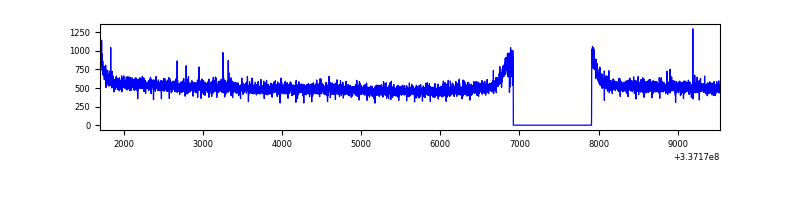 |
| B | 7838 | 6849 | 35 | 35 | 0.45% | 0.51% | 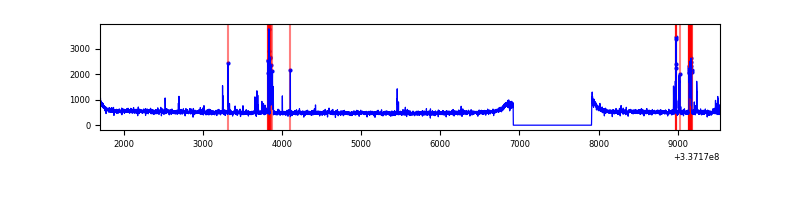 |
| C | 7838 | 6849 | 4 | 4 | 0.05% | 0.06% | 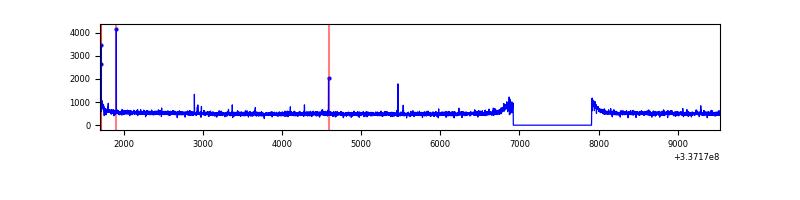 |
| D | 7838 | 6849 | 560 | 560 | 7.14% | 8.18% | 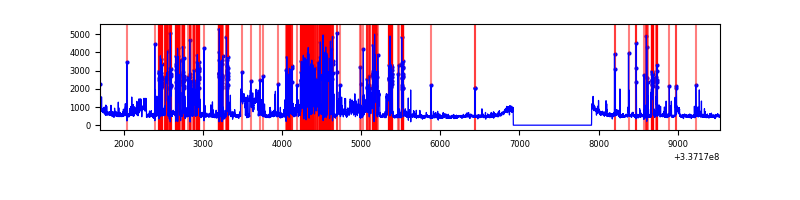 |
Top three noisy pixels from each quadrant. If the there are fewer than three noisy pixels in the level2.evt file, extra rows are filled as -1
| Pixel properties | Quadrant properties | ||||||
|---|---|---|---|---|---|---|---|
| Quadrant | DetID | PixID | Counts | Sigma | Mean | Median | Sigma |
| A | 13 | 254 | 9698 | 48.57 | 911 | 893 | 181.3 |
| A | 3 | 137 | 8279 | 40.74 | 911 | 893 | 181.3 |
| A | 0 | 226 | 7756 | 37.86 | 911 | 893 | 181.3 |
| B | 0 | 189 | 86745 | 510.67 | 893 | 873 | 168.2 |
| B | 10 | 246 | 74612 | 438.51 | 893 | 873 | 168.2 |
| B | 3 | 112 | 47740 | 278.71 | 893 | 873 | 168.2 |
| C | 14 | 238 | 139433 | 689.9 | 863 | 868 | 200.8 |
| C | 15 | 208 | 25571 | 122.99 | 863 | 868 | 200.8 |
| C | 3 | 233 | 22333 | 106.87 | 863 | 868 | 200.8 |
| D | 1 | 52 | 2512573 | 11453.01 | 837 | 818 | 219.3 |
| D | 12 | 233 | 126687 | 573.93 | 837 | 818 | 219.3 |
| D | 13 | 168 | 41221 | 184.23 | 837 | 818 | 219.3 |
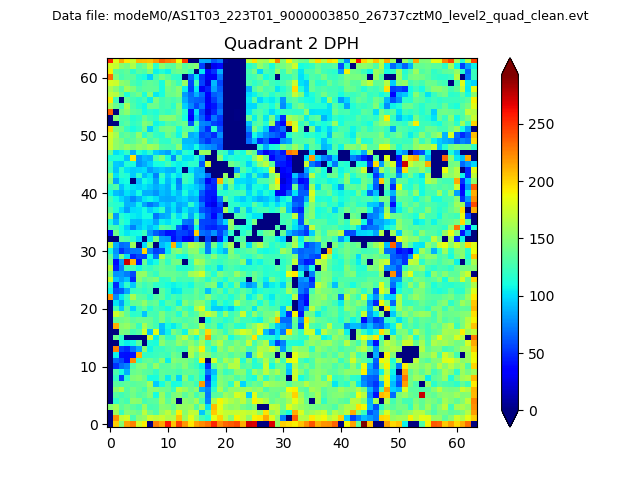
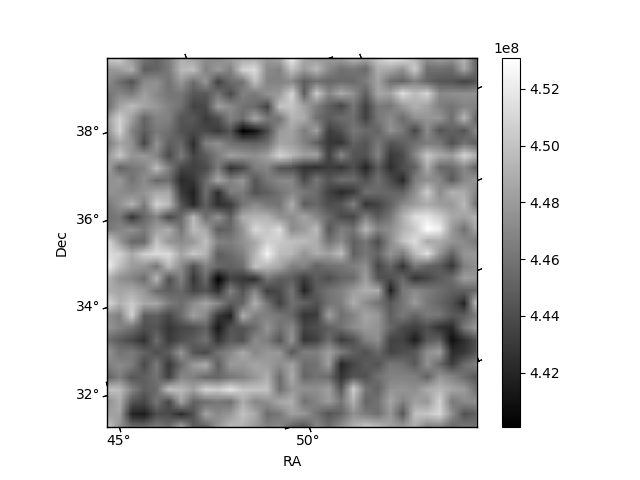
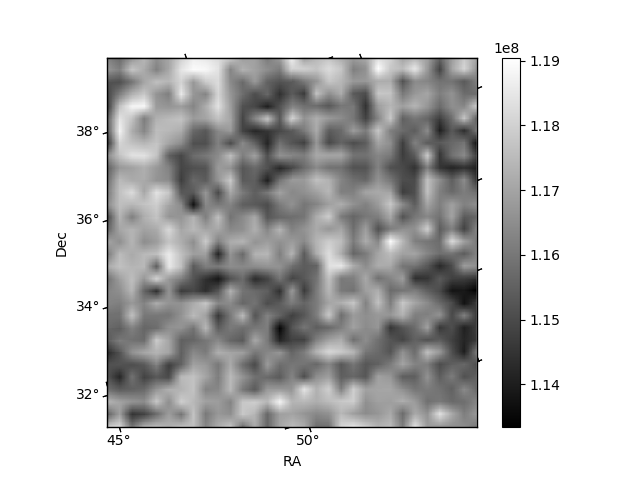
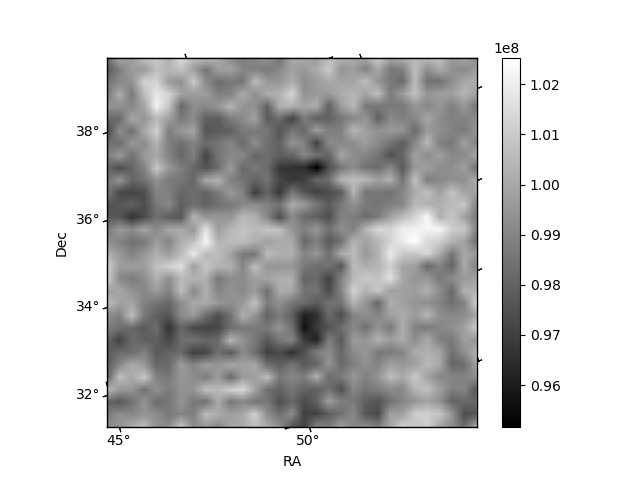
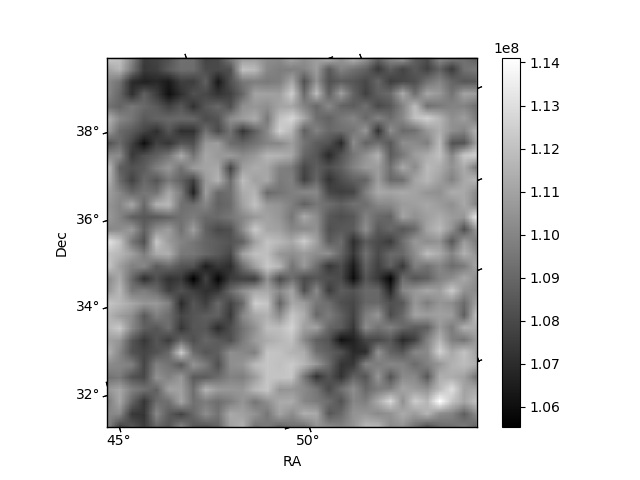
Histogram calculated using DETX and DETY for each event in the final _common_clean file
| Quadrant A | 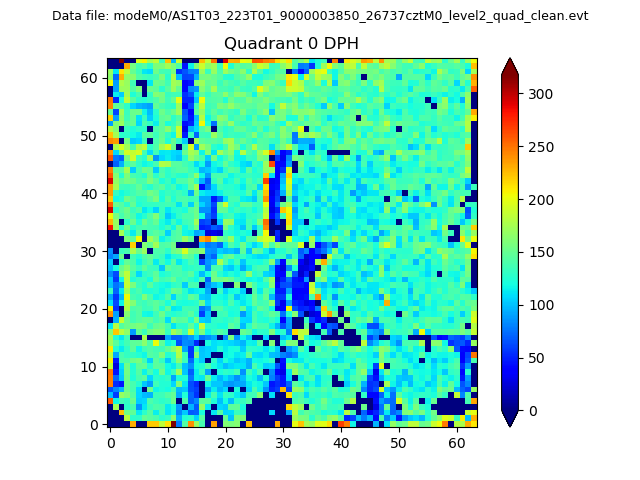 |
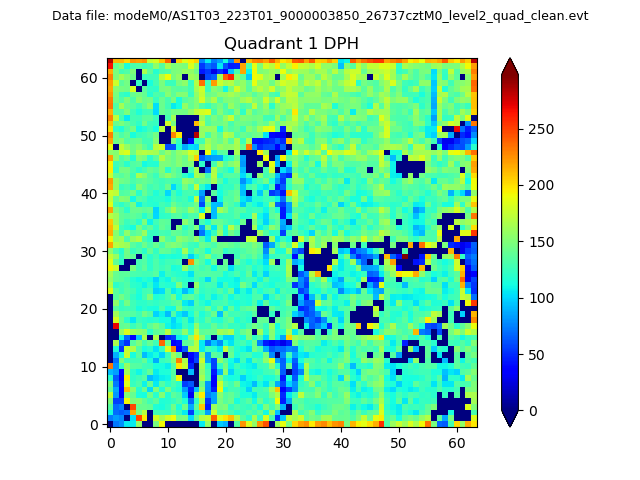 |
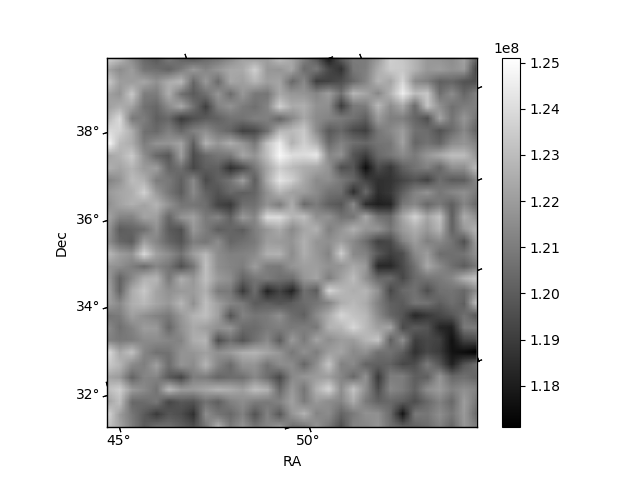
Quadrant B |
|---|---|---|---|
| Quadrant D | 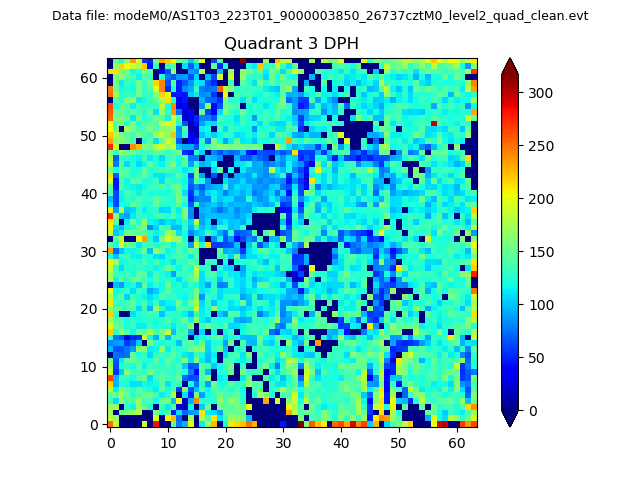 |
 |
Quadrant C |
| Plot type | Count rate plots | Images |
|---|---|---|
| Comparison with Poisson distribution Blue bars denote a histogram of data divided into 1 sec bins. Red curve is a Poisson curve with rate = median count rate of data. |
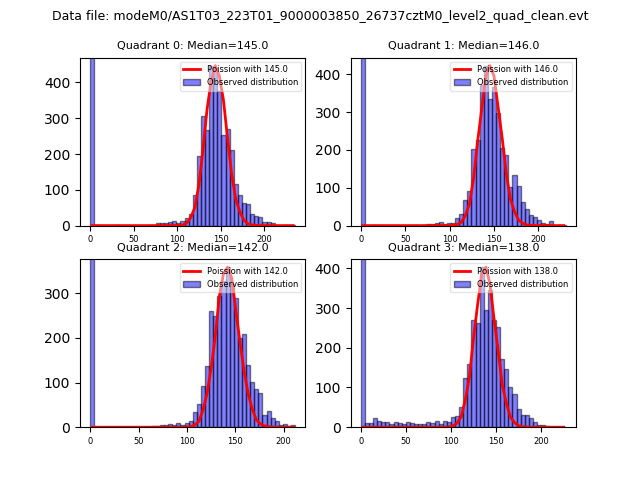 |
 |
| Quadrant-wise count rates Data is divided into 100 sec bins |
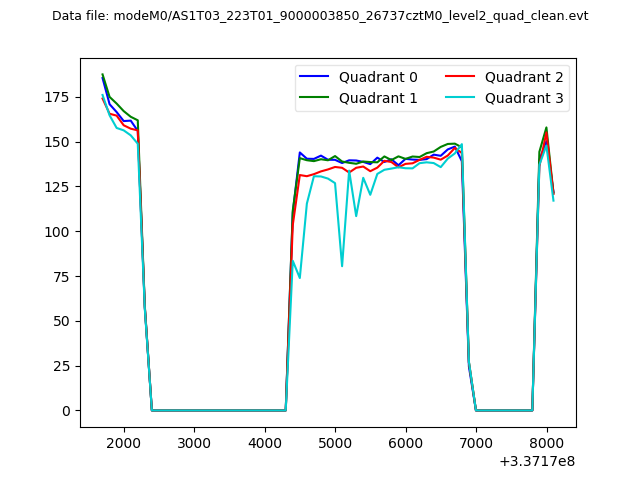 |
|
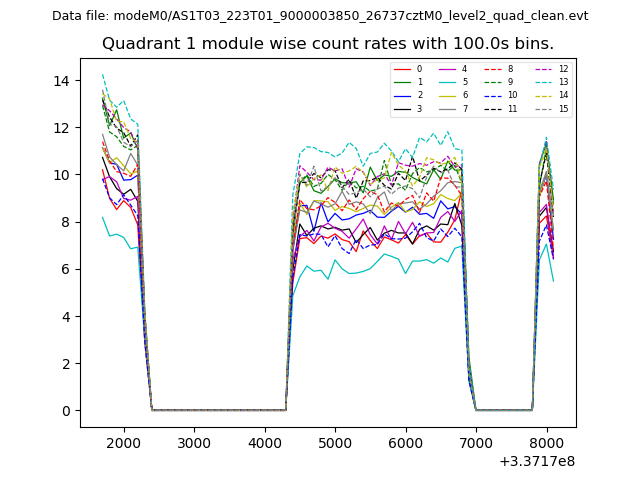
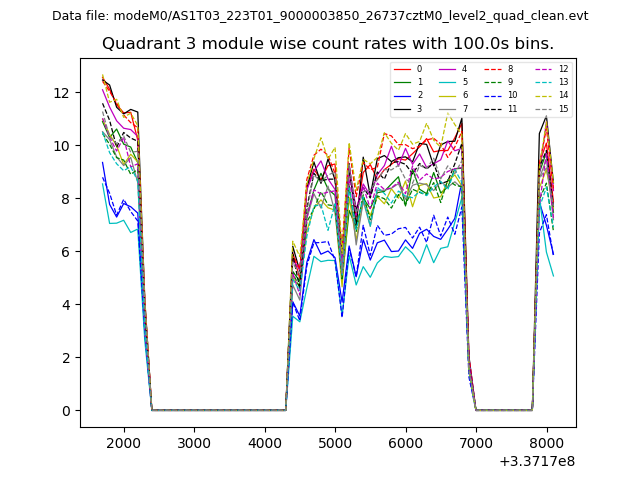
| Module-wise count rates for Quadrant A Data is divided into 100 sec bins |
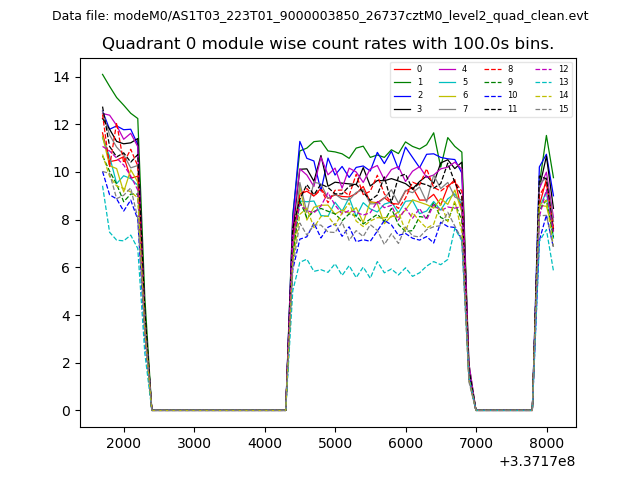 |
 |
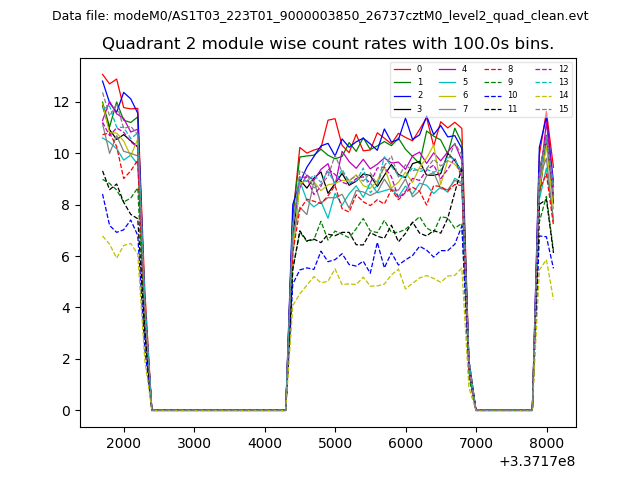
| Module-wise count rates for Quadrant B Data is divided into 100 sec bins |
 |
 |
| Module-wise count rates for Quadrant C Data is divided into 100 sec bins |
 |
 |
| Module-wise count rates for Quadrant D Data is divided into 100 sec bins |
 |
 |
| Parameter | Plot |
|---|---|
| CZT HV Monitor | 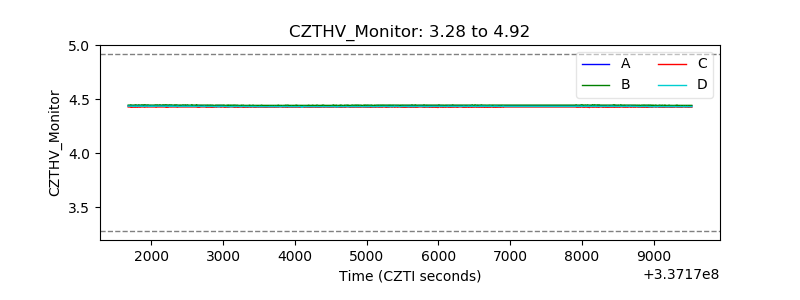 |
| D_VDD | 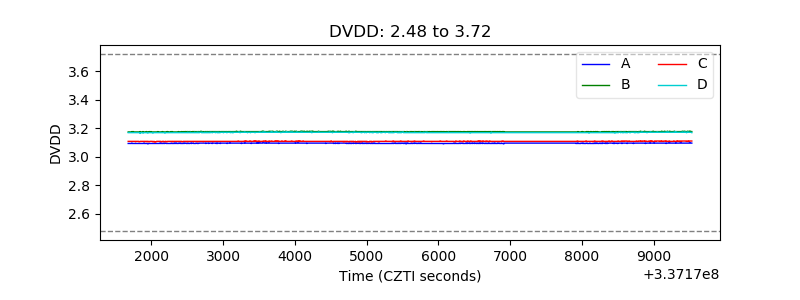 |
| Temperature 1 | 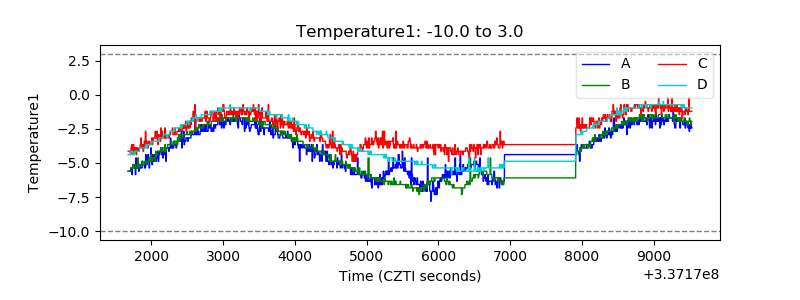 |
| Veto HV Monitor | 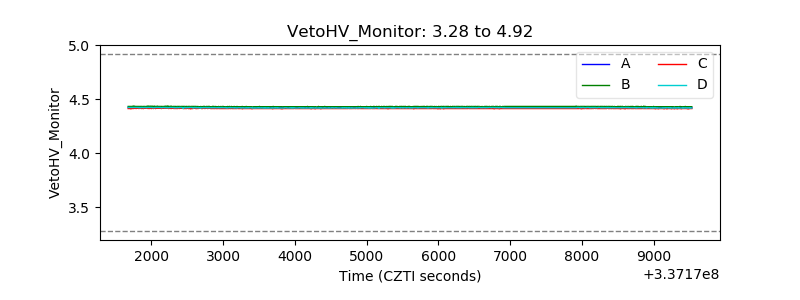 |
| Veto LLD | 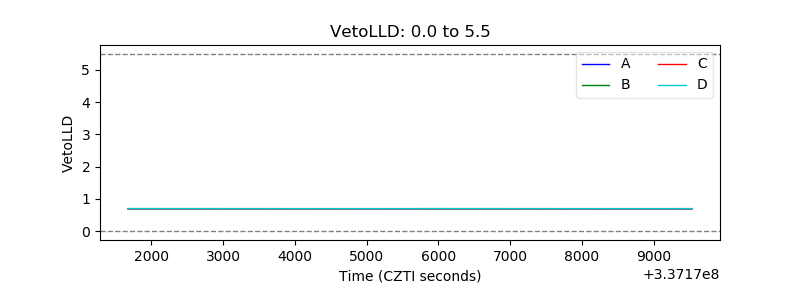 |
| Alpha Counter | 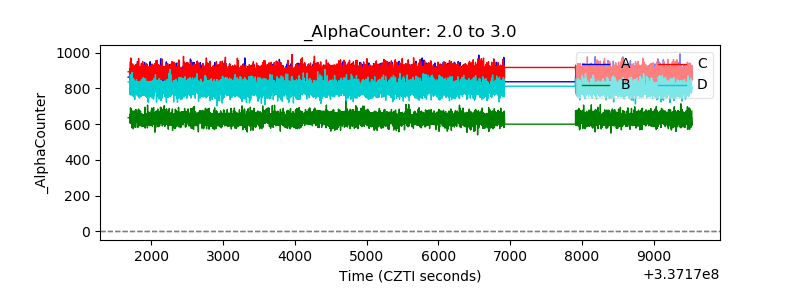 |
| _CPM_Rate | 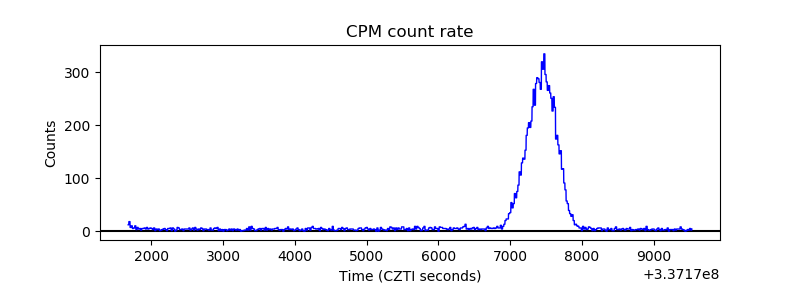 |
| CZT Counter | 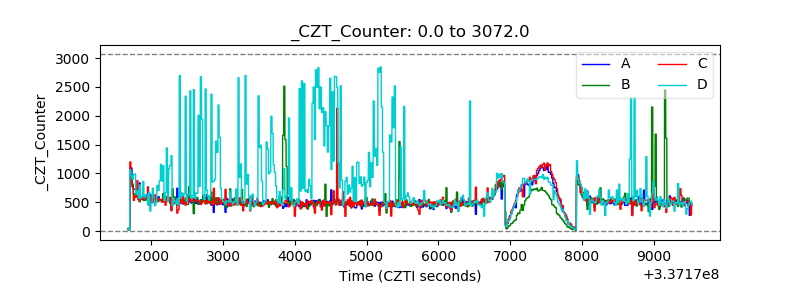 |
| +2.5 Volts monitor | 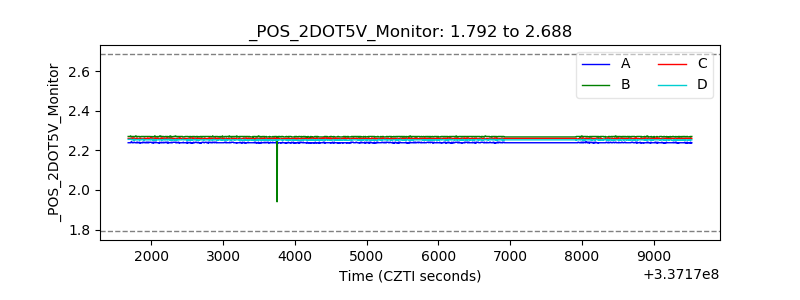 |
| +5 Volts monitor | 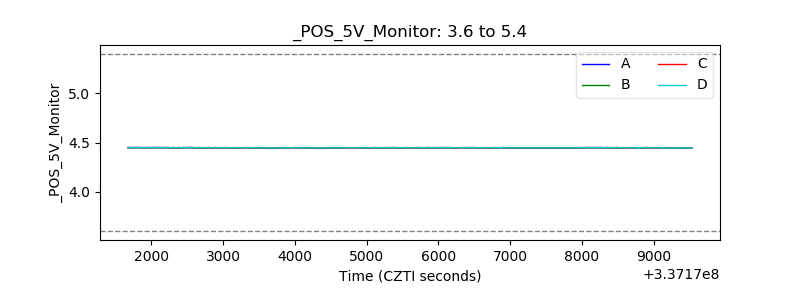 |
| _ROLL_ROT | 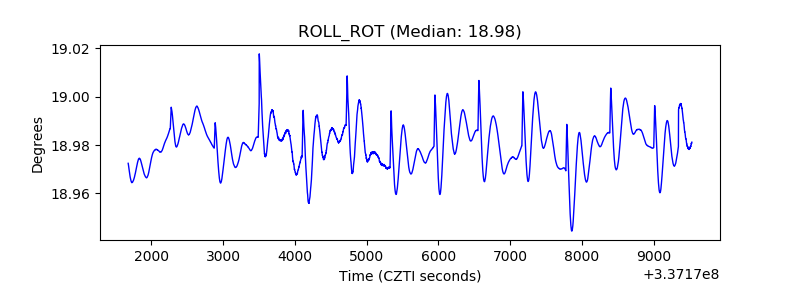 |
| _Roll_DEC |  |
| _Roll_RA | 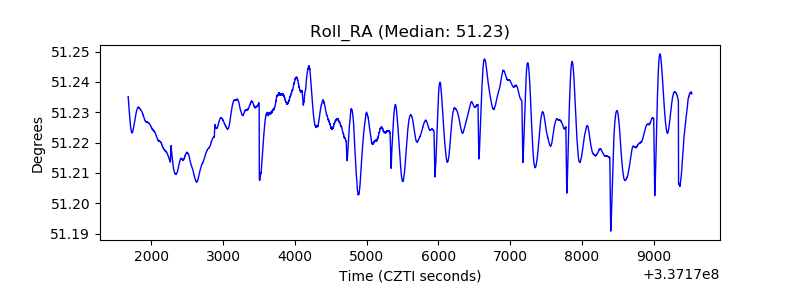 |
| Veto Counter | 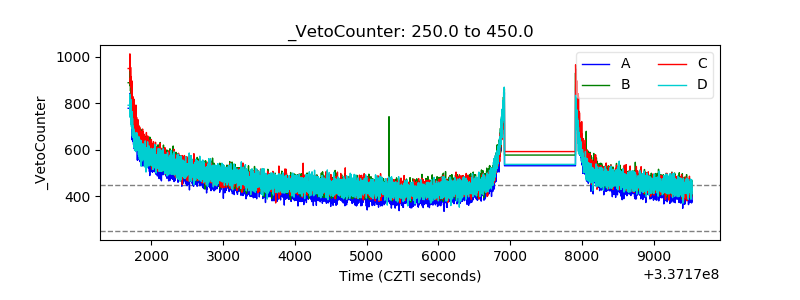 |