| Param | Original file | Final file |
|---|---|---|
| Filename | modeM0/AS1T03_223T01_9000003850_26738cztM0_level2.evt | modeM0/AS1T03_223T01_9000003850_26738cztM0_level2_quad_clean.evt |
| Size (bytes) | 519,456,960 | 72,636,480 |
| Size | 495.4 MB | 69.3 MB |
| Events in quadrant A | 3,453,103 | 435,895 |
| Events in quadrant B | 3,588,664 | 437,885 |
| Events in quadrant C | 3,415,593 | 426,819 |
| Events in quadrant D | 4,807,397 | 419,412 |
| Mode M9 | |||
|---|---|---|---|
| Quadrant | BADHDUFLAG | Total packets | Discarded packets |
| A | 0 | 6 | 0 |
| B | 0 | 6 | 0 |
| C | 0 | 6 | 0 |
| D | 0 | 6 | 0 |
| Mode M0 | |||
|---|---|---|---|
| Quadrant | BADHDUFLAG | Total packets | Discarded packets |
| A | 0 | 14411 | 0 |
| B | 0 | 14817 | 0 |
| C | 0 | 14233 | 0 |
| D | 0 | 18793 | 0 |
| Quadrant | Total seconds | Saturated seconds | Saturation percentage |
|---|---|---|---|
| A | 6878 | 127 | 1.846467% |
| B | 6878 | 179 | 2.602501% |
| C | 6878 | 174 | 2.529805% |
| D | 6878 | 307 | 4.463507% |
Noise dominated data is calculated using 1-second bins in cleaned event files. If a bin has >2000 counts, and if more than 50% of those come from <1% of pixels, then it is considered to be noise-dominated and hence unusable.
| Quadrant | # 1 sec bins | Bins with >0 counts | Bins with >2000 counts | High rate bins dominated by noise | Noise dominated (total time) | Noise dominated (detector-on time) | Marked lightcurve |
|---|---|---|---|---|---|---|---|
| A | 7498 | 6879 | 0 | 0 | 0.00% | 0.00% | 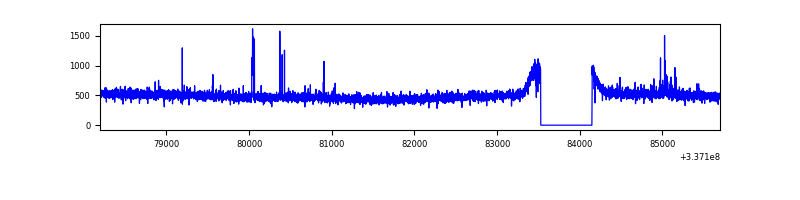 |
| B | 7498 | 6878 | 27 | 27 | 0.36% | 0.39% | 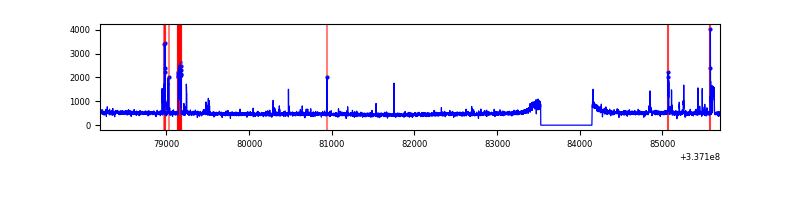 |
| C | 7498 | 6879 | 3 | 3 | 0.04% | 0.04% | 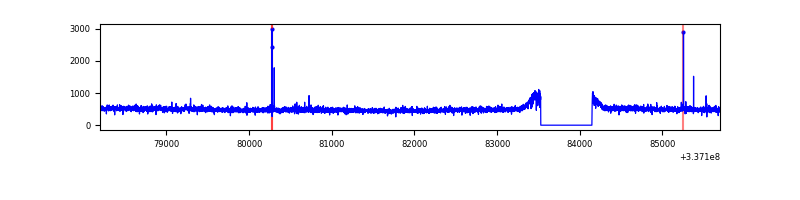 |
| D | 7498 | 6879 | 137 | 137 | 1.83% | 1.99% | 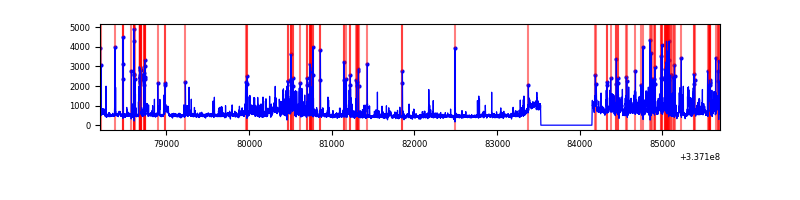 |
Top three noisy pixels from each quadrant. If the there are fewer than three noisy pixels in the level2.evt file, extra rows are filled as -1
| Pixel properties | Quadrant properties | ||||||
|---|---|---|---|---|---|---|---|
| Quadrant | DetID | PixID | Counts | Sigma | Mean | Median | Sigma |
| A | 6 | 16 | 42830 | 237.75 | 876 | 857 | 176.5 |
| A | 0 | 13 | 27596 | 151.46 | 876 | 857 | 176.5 |
| A | 13 | 254 | 11487 | 60.21 | 876 | 857 | 176.5 |
| B | 0 | 189 | 145734 | 879.89 | 860 | 839 | 164.7 |
| B | 3 | 112 | 47897 | 285.76 | 860 | 839 | 164.7 |
| B | 10 | 246 | 23614 | 138.3 | 860 | 839 | 164.7 |
| C | 14 | 238 | 134619 | 684.02 | 831 | 833 | 195.6 |
| C | 15 | 208 | 20941 | 102.81 | 831 | 833 | 195.6 |
| C | 3 | 233 | 16803 | 81.65 | 831 | 833 | 195.6 |
| D | 1 | 52 | 842318 | 3841.96 | 835 | 814 | 219.0 |
| D | 7 | 80 | 283306 | 1289.74 | 835 | 814 | 219.0 |
| D | 2 | 250 | 246224 | 1120.44 | 835 | 814 | 219.0 |
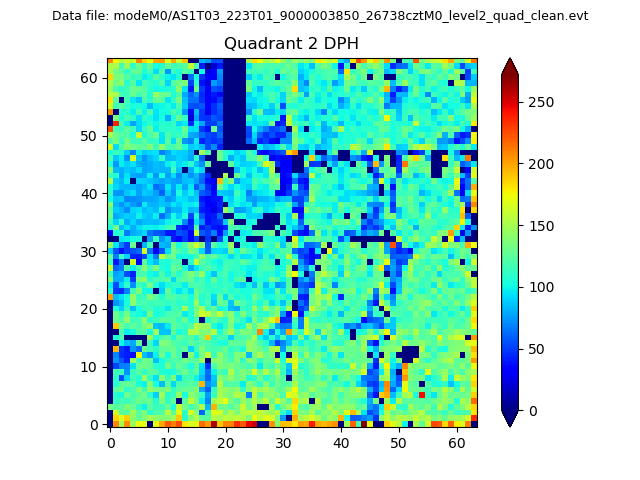
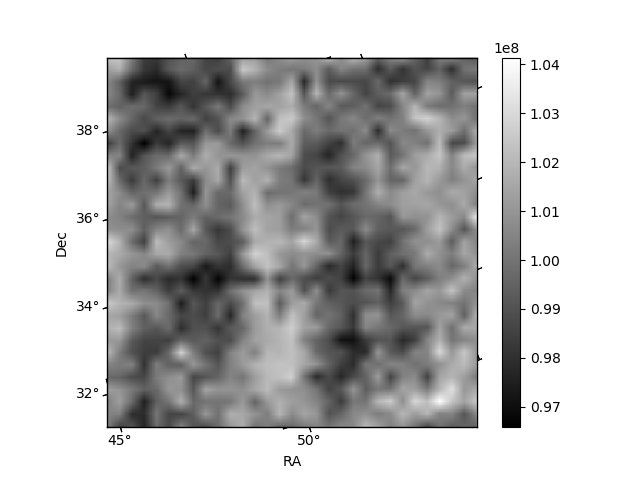
Histogram calculated using DETX and DETY for each event in the final _common_clean file
| Quadrant A |  |
 |
Quadrant B |
|---|---|---|---|
| Quadrant D | 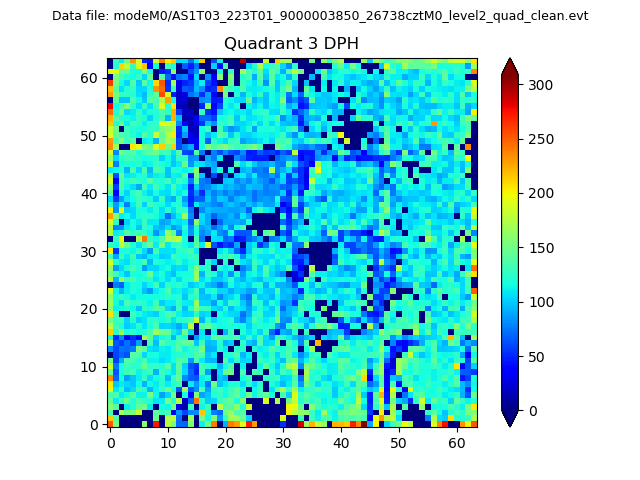 |
 |
Quadrant C |
| Plot type | Count rate plots | Images |
|---|---|---|
| Comparison with Poisson distribution Blue bars denote a histogram of data divided into 1 sec bins. Red curve is a Poisson curve with rate = median count rate of data. |
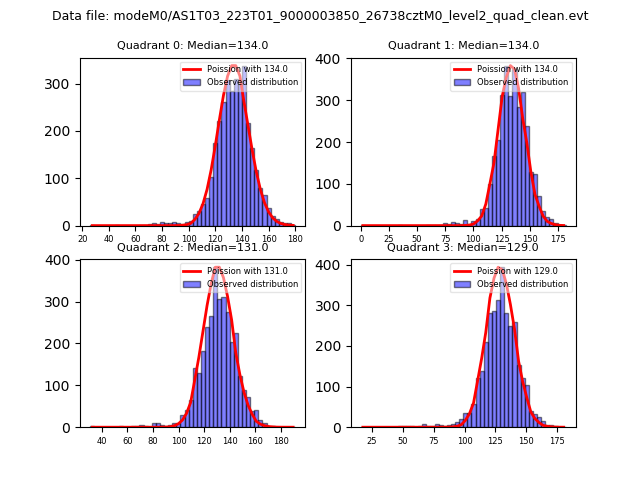 |
 |
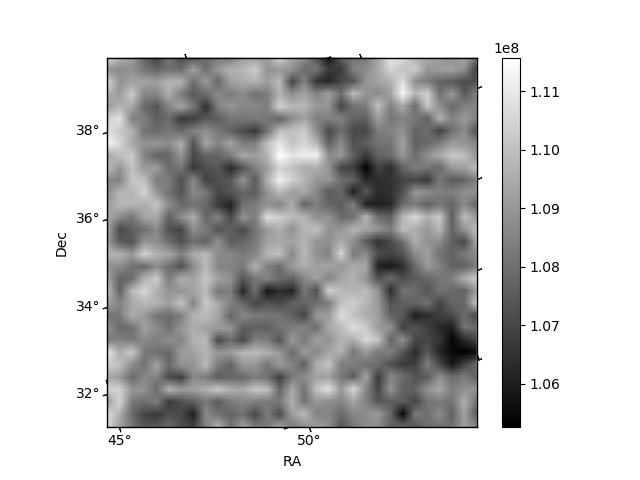
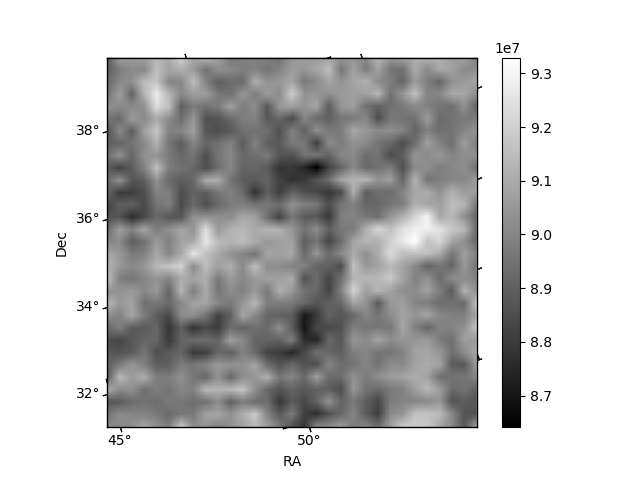
| Quadrant-wise count rates Data is divided into 100 sec bins |
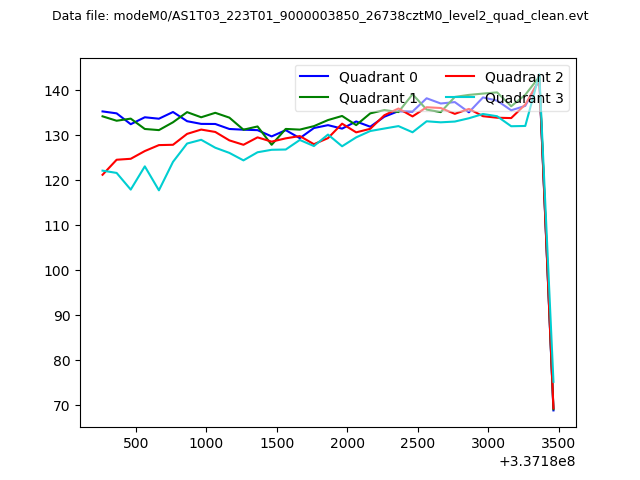 |
|
| Module-wise count rates for Quadrant A Data is divided into 100 sec bins |
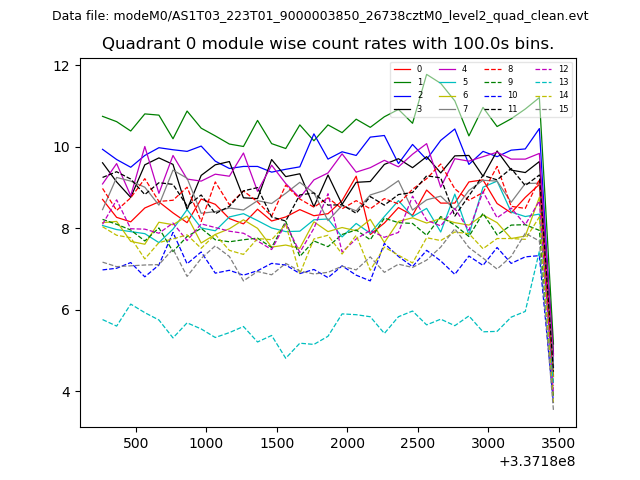 |
 |
| Module-wise count rates for Quadrant B Data is divided into 100 sec bins |
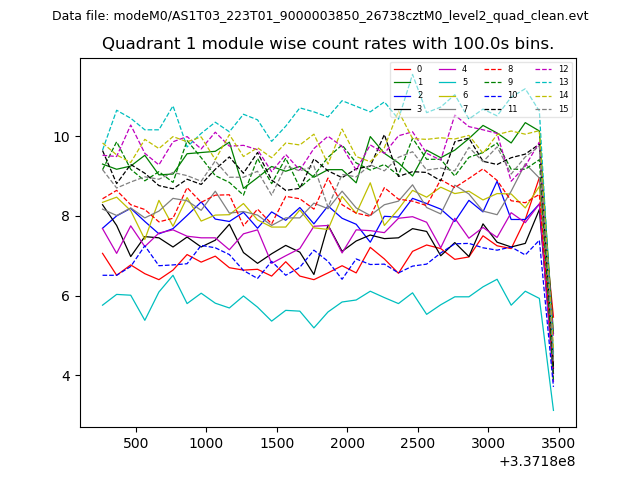 |
 |
| Module-wise count rates for Quadrant C Data is divided into 100 sec bins |
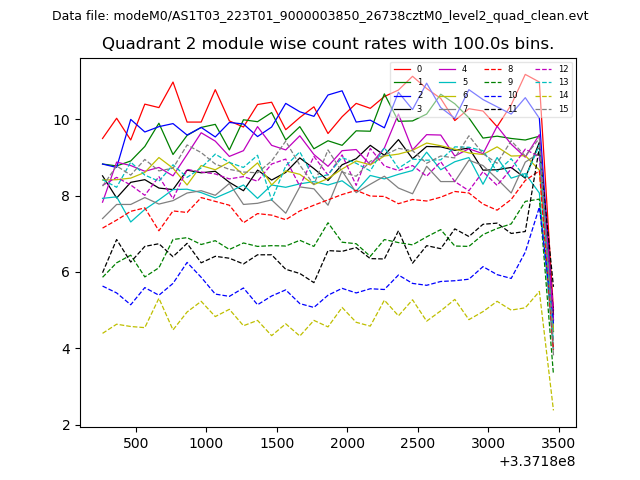 |
 |
| Module-wise count rates for Quadrant D Data is divided into 100 sec bins |
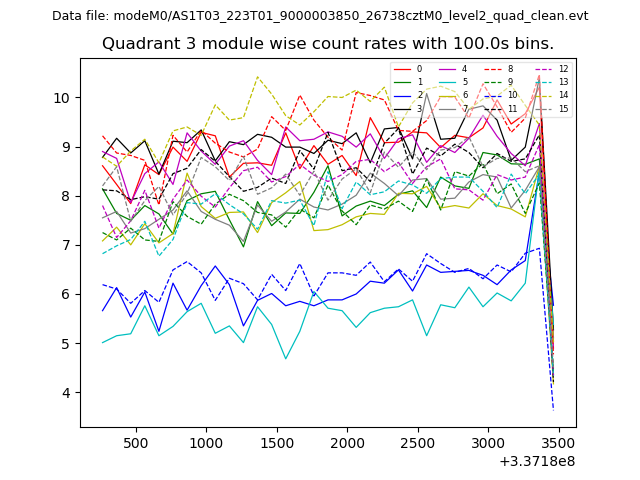 |
 |
| Parameter | Plot |
|---|---|
| CZT HV Monitor | 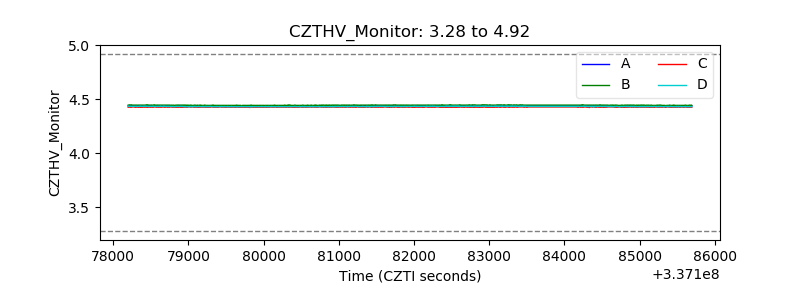 |
| D_VDD | 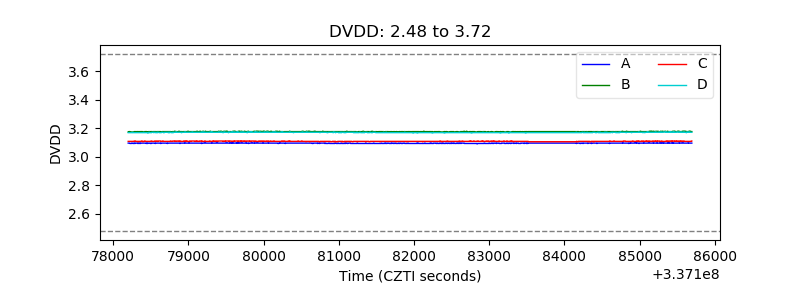 |
| Temperature 1 | 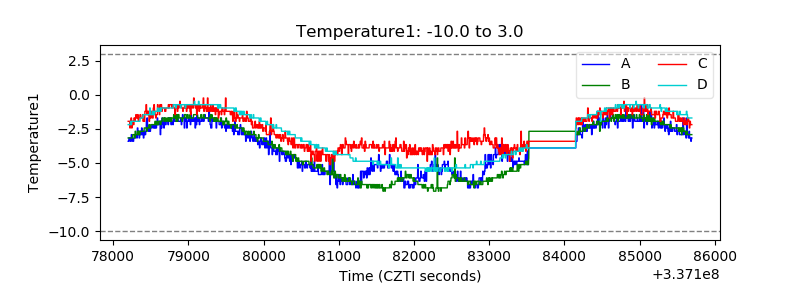 |
| Veto HV Monitor |  |
| Veto LLD | 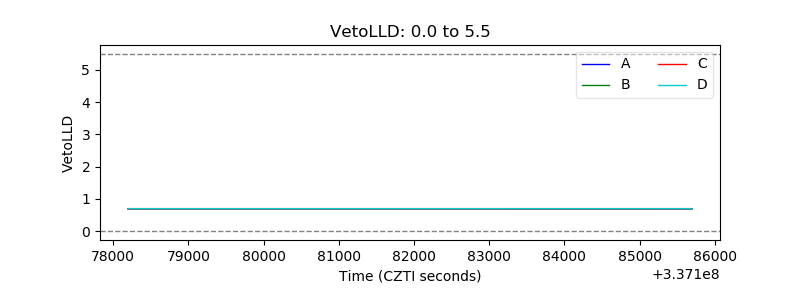 |
| Alpha Counter | 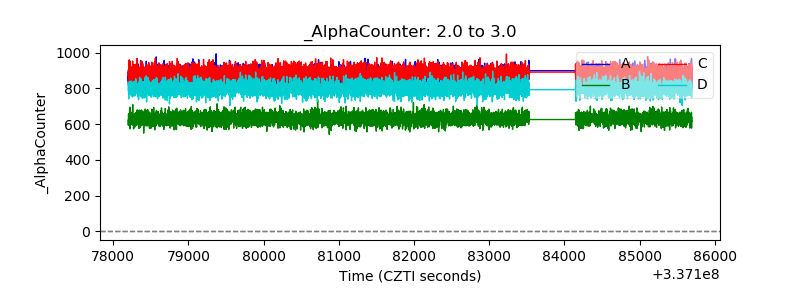 |
| _CPM_Rate |  |
| CZT Counter | 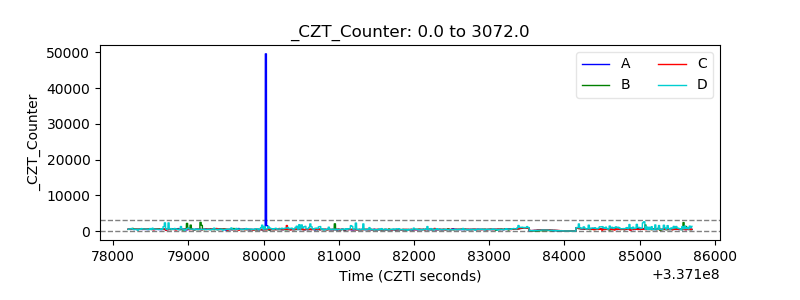 |
| +2.5 Volts monitor |  |
| +5 Volts monitor |  |
| _ROLL_ROT | 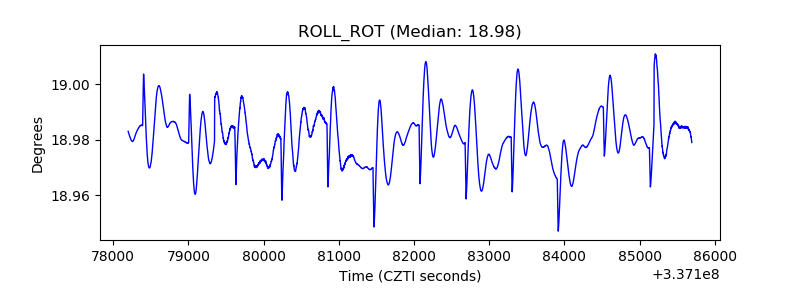 |
| _Roll_DEC |  |
| _Roll_RA | 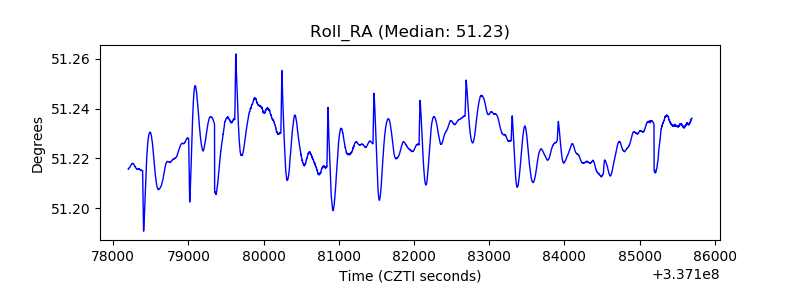 |
| Veto Counter | 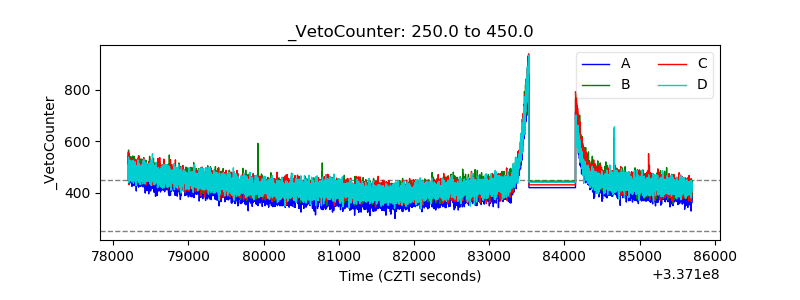 |