| Param | Original file | Final file |
|---|---|---|
| Filename | modeM0/AS1T03_223T01_9000003850_26739cztM0_level2.evt | modeM0/AS1T03_223T01_9000003850_26739cztM0_level2_quad_clean.evt |
| Size (bytes) | 593,136,000 | 80,694,720 |
| Size | 565.7 MB | 77.0 MB |
| Events in quadrant A | 3,708,448 | 488,471 |
| Events in quadrant B | 4,107,969 | 494,709 |
| Events in quadrant C | 3,747,661 | 479,660 |
| Events in quadrant D | 5,889,781 | 457,779 |
| Mode M9 | |||
|---|---|---|---|
| Quadrant | BADHDUFLAG | Total packets | Discarded packets |
| A | 0 | 4 | 0 |
| B | 0 | 5 | 0 |
| C | 0 | 5 | 0 |
| D | 0 | 5 | 0 |
| Mode M0 | |||
|---|---|---|---|
| Quadrant | BADHDUFLAG | Total packets | Discarded packets |
| A | 0 | 15700 | 0 |
| B | 0 | 16890 | 0 |
| C | 0 | 15720 | 0 |
| D | 0 | 22522 | 0 |
| Quadrant | Total seconds | Saturated seconds | Saturation percentage |
|---|---|---|---|
| A | 7513 | 130 | 1.730334% |
| B | 7513 | 250 | 3.327566% |
| C | 7513 | 199 | 2.648742% |
| D | 7512 | 485 | 6.456337% |
Noise dominated data is calculated using 1-second bins in cleaned event files. If a bin has >2000 counts, and if more than 50% of those come from <1% of pixels, then it is considered to be noise-dominated and hence unusable.
| Quadrant | # 1 sec bins | Bins with >0 counts | Bins with >2000 counts | High rate bins dominated by noise | Noise dominated (total time) | Noise dominated (detector-on time) | Marked lightcurve |
|---|---|---|---|---|---|---|---|
| A | 7833 | 7515 | 0 | 0 | 0.00% | 0.00% |  |
| B | 7833 | 7515 | 72 | 72 | 0.92% | 0.96% |  |
| C | 7833 | 7515 | 5 | 5 | 0.06% | 0.07% |  |
| D | 7832 | 7514 | 258 | 258 | 3.29% | 3.43% |  |
Top three noisy pixels from each quadrant. If the there are fewer than three noisy pixels in the level2.evt file, extra rows are filled as -1
| Pixel properties | Quadrant properties | ||||||
|---|---|---|---|---|---|---|---|
| Quadrant | DetID | PixID | Counts | Sigma | Mean | Median | Sigma |
| A | 0 | 13 | 53243 | 273.22 | 945 | 923 | 191.5 |
| A | 13 | 254 | 12514 | 60.53 | 945 | 923 | 191.5 |
| A | 4 | 2 | 9352 | 44.02 | 945 | 923 | 191.5 |
| B | 0 | 189 | 374252 | 2114.23 | 929 | 905 | 176.6 |
| B | 10 | 246 | 48633 | 270.28 | 929 | 905 | 176.6 |
| B | 15 | 33 | 30566 | 167.97 | 929 | 905 | 176.6 |
| C | 14 | 238 | 144182 | 676.88 | 900 | 904 | 211.7 |
| C | 2 | 16 | 46921 | 217.4 | 900 | 904 | 211.7 |
| C | 3 | 233 | 27912 | 127.59 | 900 | 904 | 211.7 |
| D | 1 | 52 | 1378794 | 5745.07 | 890 | 872 | 239.8 |
| D | 7 | 80 | 571921 | 2380.92 | 890 | 872 | 239.8 |
| D | 2 | 250 | 294724 | 1225.18 | 890 | 872 | 239.8 |
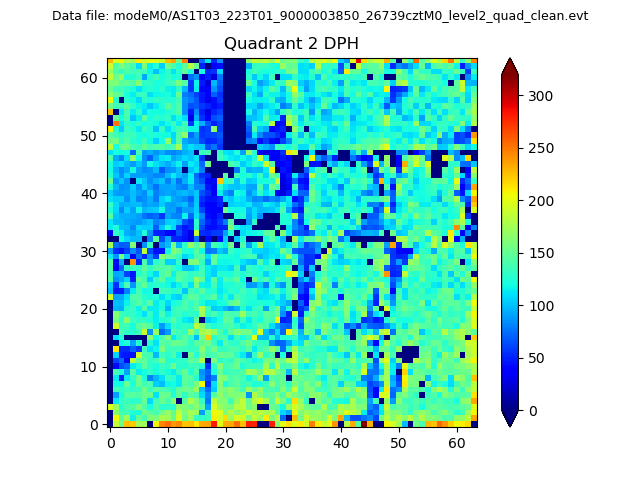
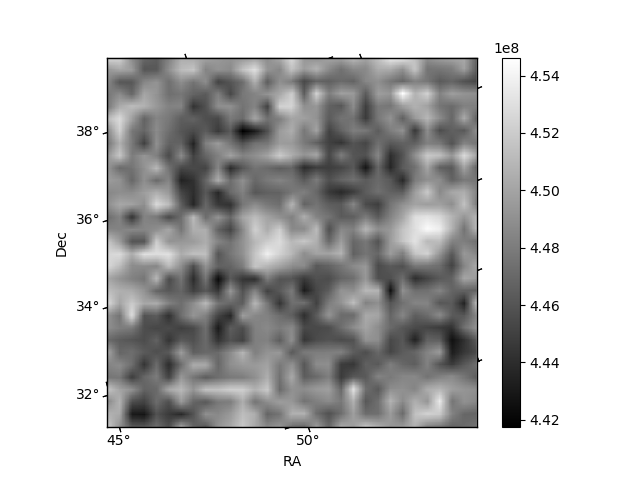
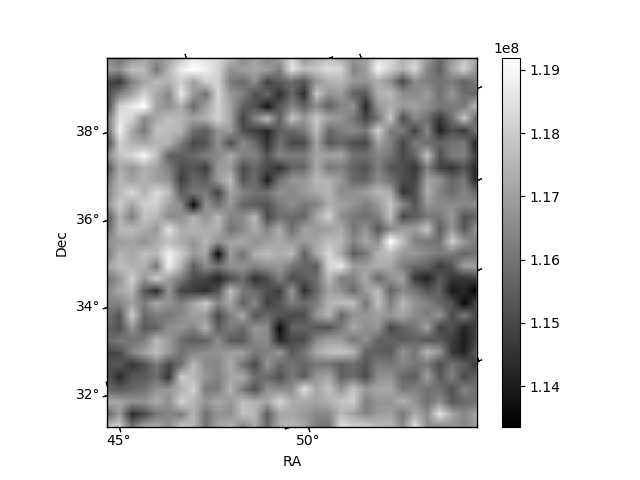
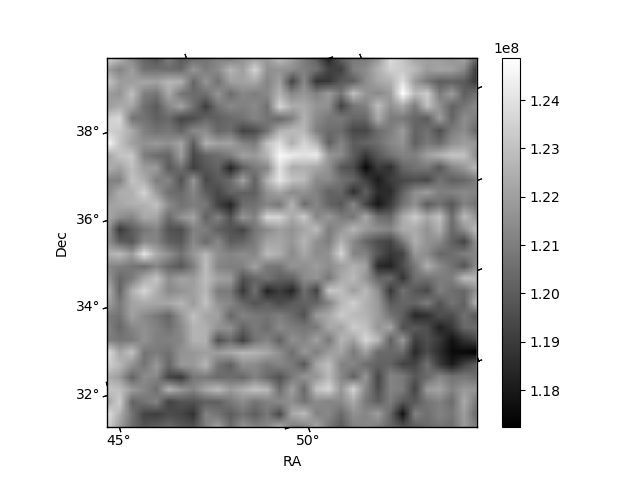
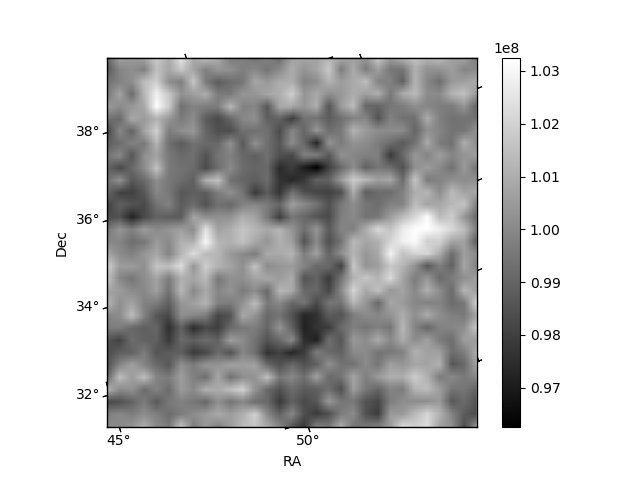
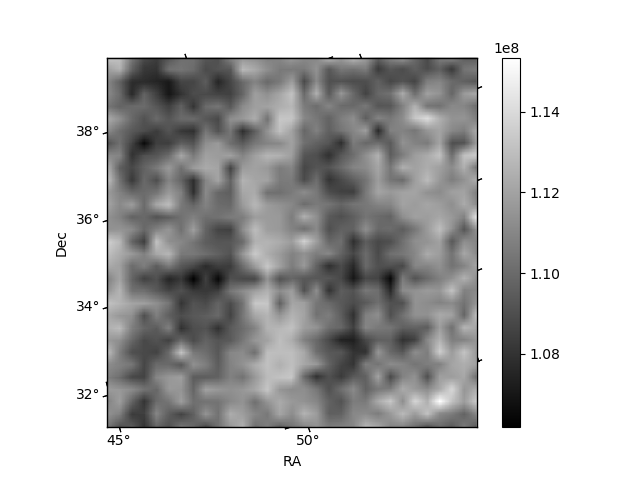
Histogram calculated using DETX and DETY for each event in the final _common_clean file
| Quadrant A | 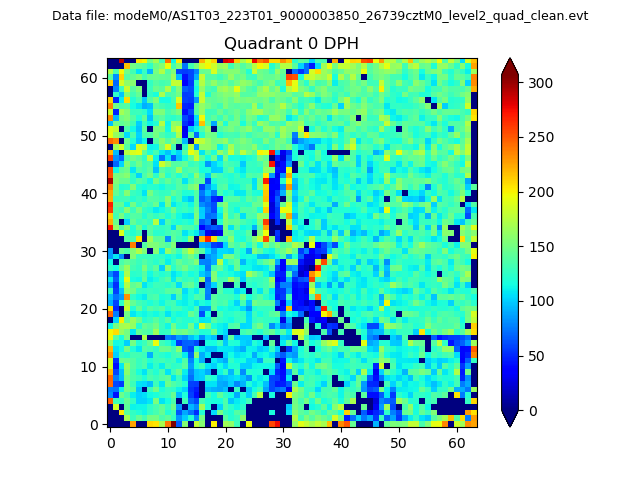 |
 |
Quadrant B |
|---|---|---|---|
| Quadrant D | 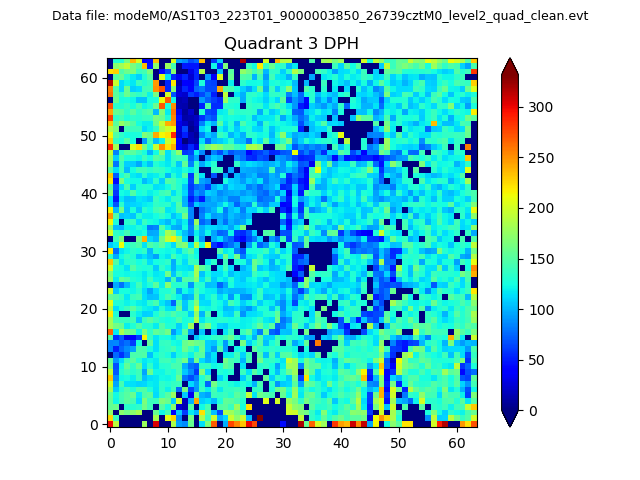 |
 |
Quadrant C |
| Plot type | Count rate plots | Images |
|---|---|---|
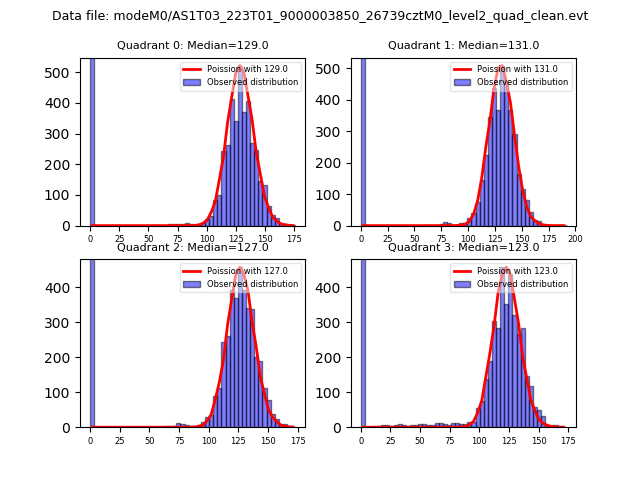
| Comparison with Poisson distribution Blue bars denote a histogram of data divided into 1 sec bins. Red curve is a Poisson curve with rate = median count rate of data. |
 |
 |
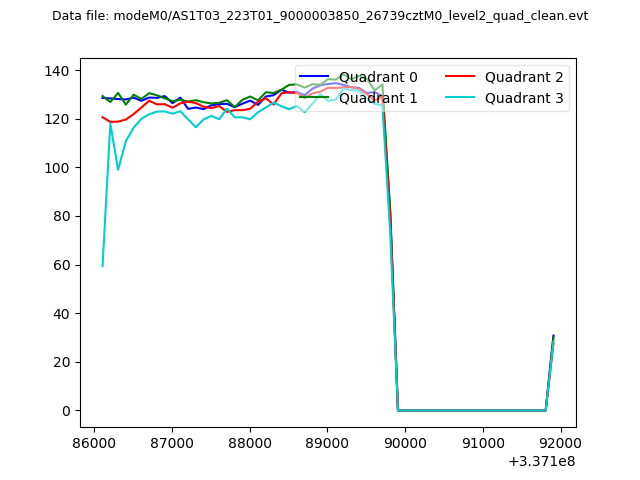
| Quadrant-wise count rates Data is divided into 100 sec bins |
 |
|
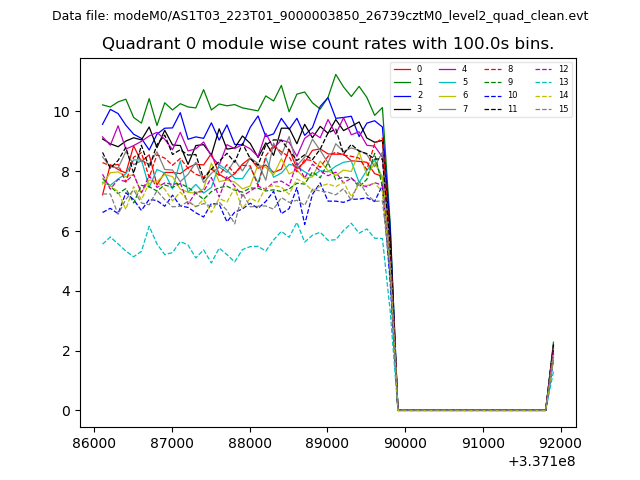
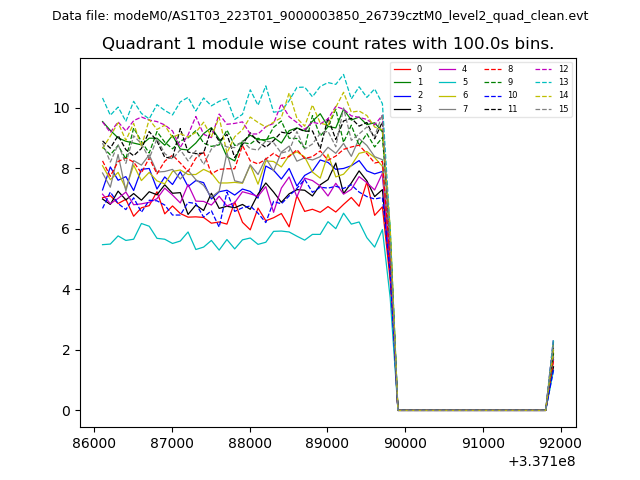
| Module-wise count rates for Quadrant A Data is divided into 100 sec bins |
 |
 |
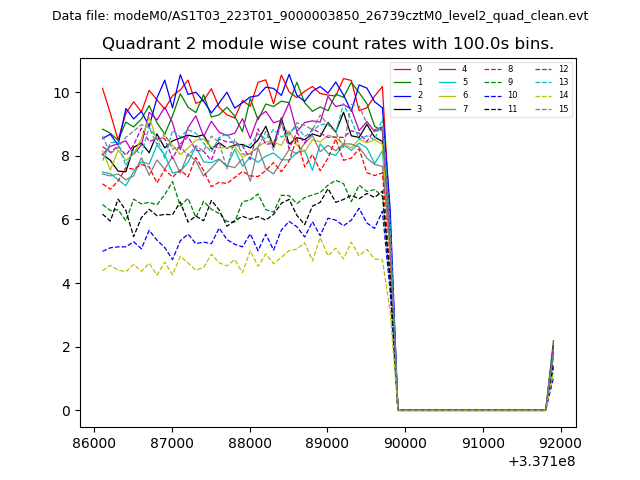
| Module-wise count rates for Quadrant B Data is divided into 100 sec bins |
 |
 |
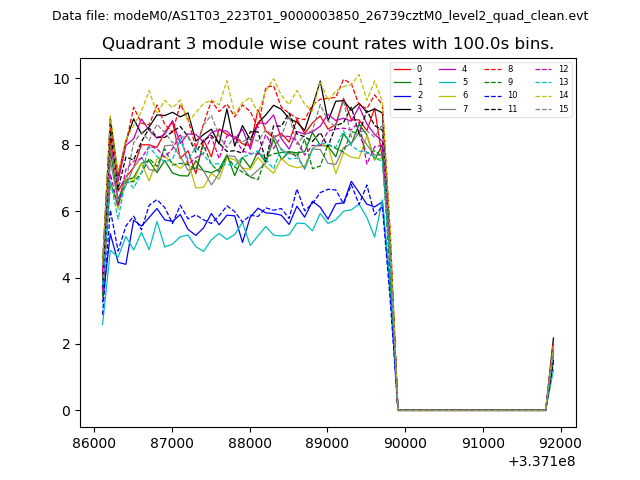
| Module-wise count rates for Quadrant C Data is divided into 100 sec bins |
 |
 |
| Module-wise count rates for Quadrant D Data is divided into 100 sec bins |
 |
 |
| Parameter | Plot |
|---|---|
| CZT HV Monitor | 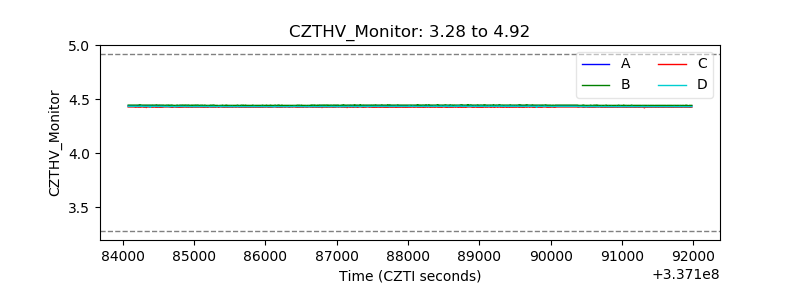 |
| D_VDD | 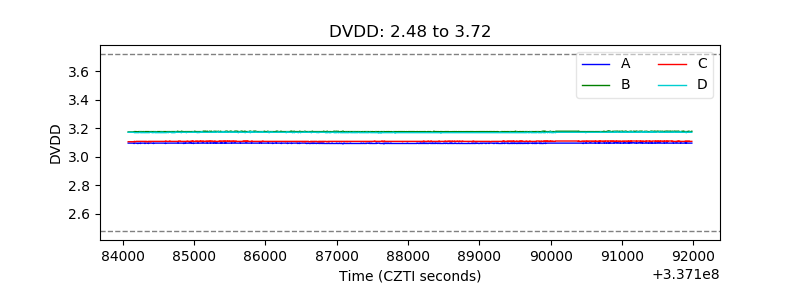 |
| Temperature 1 | 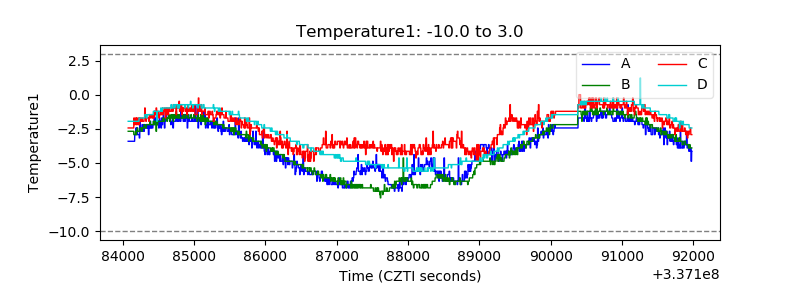 |
| Veto HV Monitor | 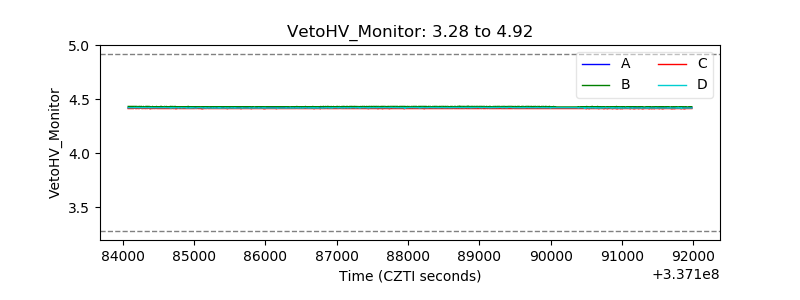 |
| Veto LLD | 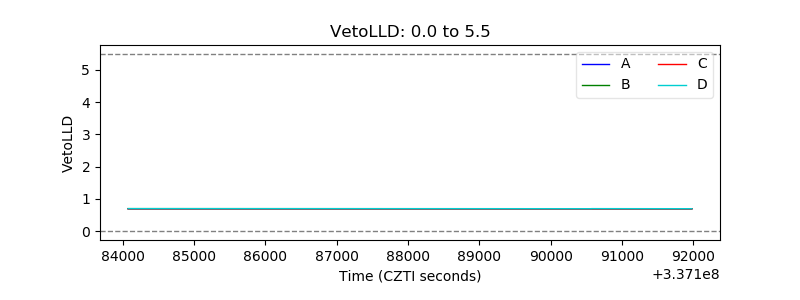 |
| Alpha Counter | 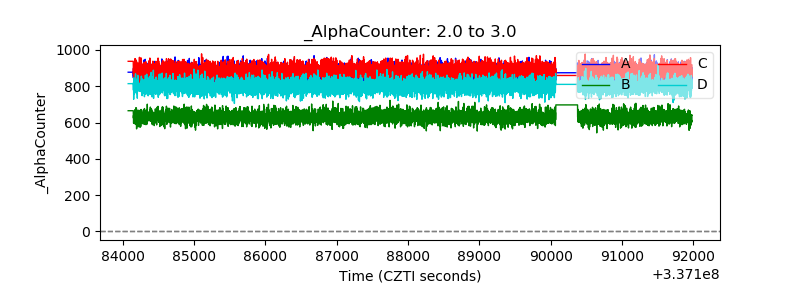 |
| _CPM_Rate | 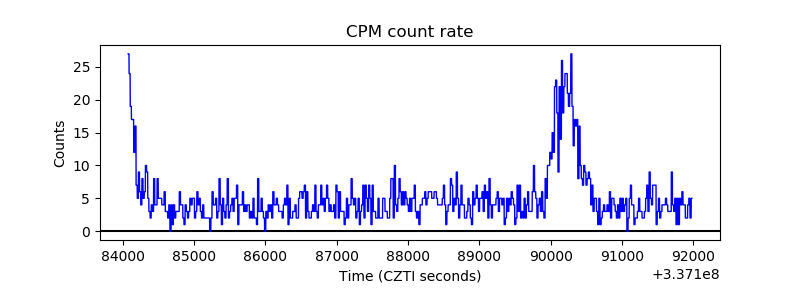 |
| CZT Counter | 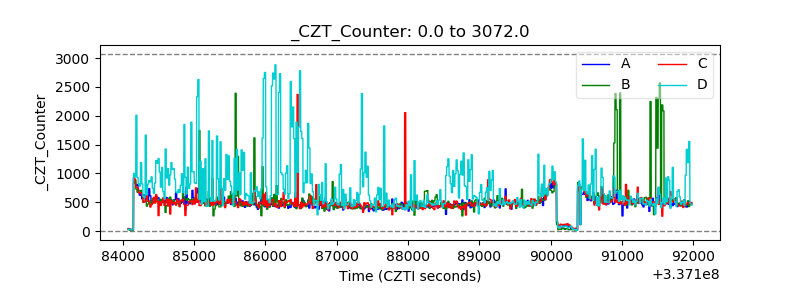 |
| +2.5 Volts monitor | 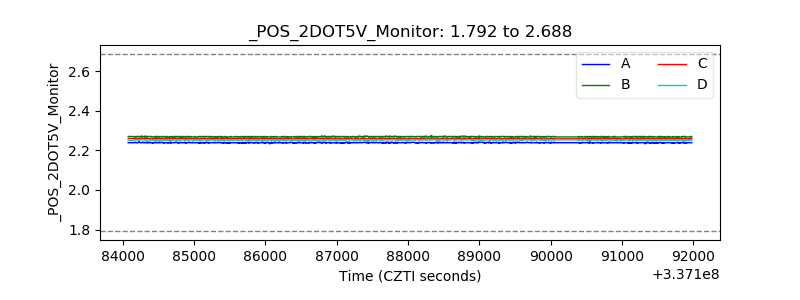 |
| +5 Volts monitor | 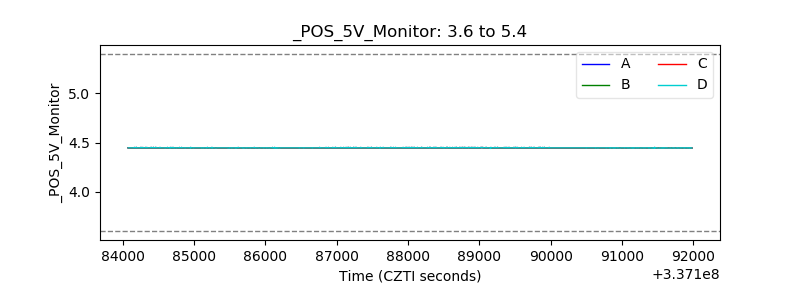 |
| _ROLL_ROT | 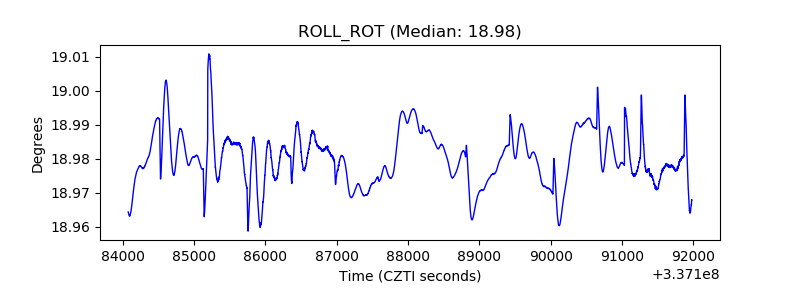 |
| _Roll_DEC | 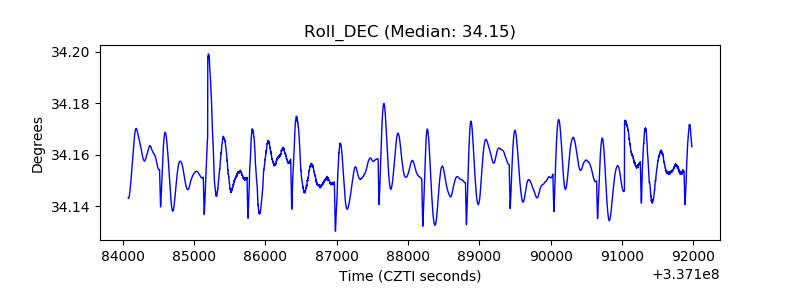 |
| _Roll_RA | 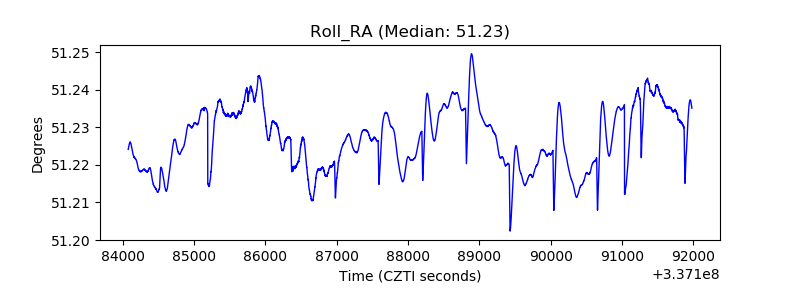 |
| Veto Counter | 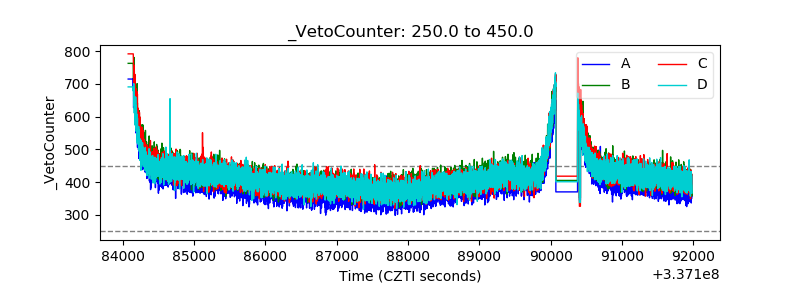 |