| Param | Original file | Final file |
|---|---|---|
| Filename | modeM0/AS1T03_223T01_9000003850_26740cztM0_level2.evt | modeM0/AS1T03_223T01_9000003850_26740cztM0_level2_quad_clean.evt |
| Size (bytes) | 721,465,920 | 92,018,880 |
| Size | 688.0 MB | 87.8 MB |
| Events in quadrant A | 3,945,659 | 569,523 |
| Events in quadrant B | 5,951,973 | 566,577 |
| Events in quadrant C | 4,072,964 | 558,432 |
| Events in quadrant D | 7,333,490 | 531,631 |
| Mode M9 | |||
|---|---|---|---|
| Quadrant | BADHDUFLAG | Total packets | Discarded packets |
| A | 0 | 7 | 0 |
| B | 0 | 7 | 0 |
| C | 0 | 7 | 0 |
| D | 0 | 7 | 0 |
| Mode M0 | |||
|---|---|---|---|
| Quadrant | BADHDUFLAG | Total packets | Discarded packets |
| A | 0 | 16832 | 0 |
| B | 0 | 22877 | 0 |
| C | 0 | 17086 | 0 |
| D | 0 | 27243 | 0 |
| Quadrant | Total seconds | Saturated seconds | Saturation percentage |
|---|---|---|---|
| A | 8065 | 187 | 2.318661% |
| B | 8065 | 838 | 10.390577% |
| C | 8065 | 267 | 3.310601% |
| D | 8065 | 912 | 11.308122% |
Noise dominated data is calculated using 1-second bins in cleaned event files. If a bin has >2000 counts, and if more than 50% of those come from <1% of pixels, then it is considered to be noise-dominated and hence unusable.
| Quadrant | # 1 sec bins | Bins with >0 counts | Bins with >2000 counts | High rate bins dominated by noise | Noise dominated (total time) | Noise dominated (detector-on time) | Marked lightcurve |
|---|---|---|---|---|---|---|---|
| A | 8680 | 8068 | 0 | 0 | 0.00% | 0.00% | 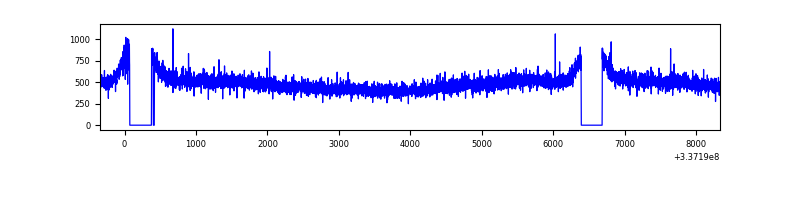 |
| B | 8680 | 8068 | 429 | 429 | 4.94% | 5.32% | 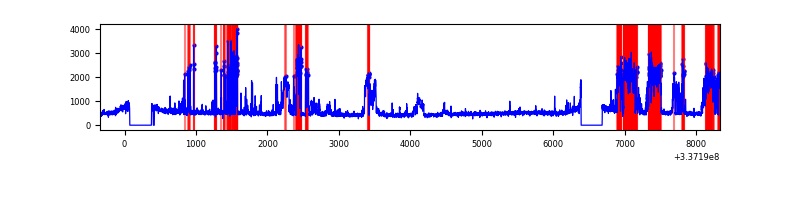 |
| C | 8680 | 8068 | 10 | 10 | 0.12% | 0.12% | 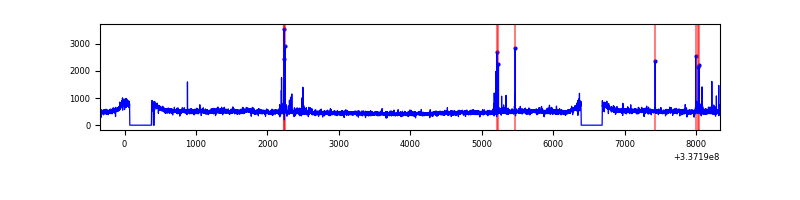 |
| D | 8680 | 8068 | 546 | 546 | 6.29% | 6.77% | 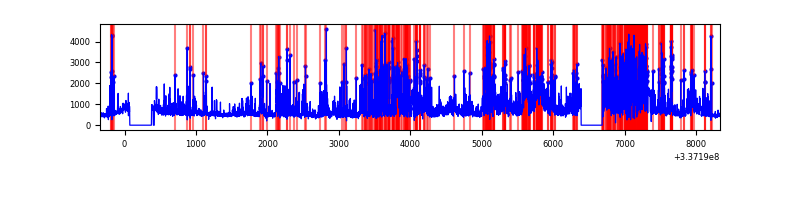 |
Top three noisy pixels from each quadrant. If the there are fewer than three noisy pixels in the level2.evt file, extra rows are filled as -1
| Pixel properties | Quadrant properties | ||||||
|---|---|---|---|---|---|---|---|
| Quadrant | DetID | PixID | Counts | Sigma | Mean | Median | Sigma |
| A | 13 | 254 | 13399 | 60.15 | 1017 | 993 | 206.2 |
| A | 0 | 13 | 9899 | 43.18 | 1017 | 993 | 206.2 |
| A | 3 | 137 | 9870 | 43.04 | 1017 | 993 | 206.2 |
| B | 0 | 189 | 2001242 | 10659.32 | 982 | 956 | 187.7 |
| B | 10 | 246 | 36963 | 191.88 | 982 | 956 | 187.7 |
| B | 15 | 33 | 24530 | 125.62 | 982 | 956 | 187.7 |
| C | 14 | 238 | 152806 | 667.47 | 968 | 968 | 227.5 |
| C | 2 | 16 | 66119 | 286.4 | 968 | 968 | 227.5 |
| C | 3 | 233 | 42753 | 183.68 | 968 | 968 | 227.5 |
| D | 1 | 52 | 1889688 | 7428.16 | 943 | 922 | 254.3 |
| D | 7 | 80 | 1143901 | 4495.12 | 943 | 922 | 254.3 |
| D | 12 | 233 | 270346 | 1059.59 | 943 | 922 | 254.3 |
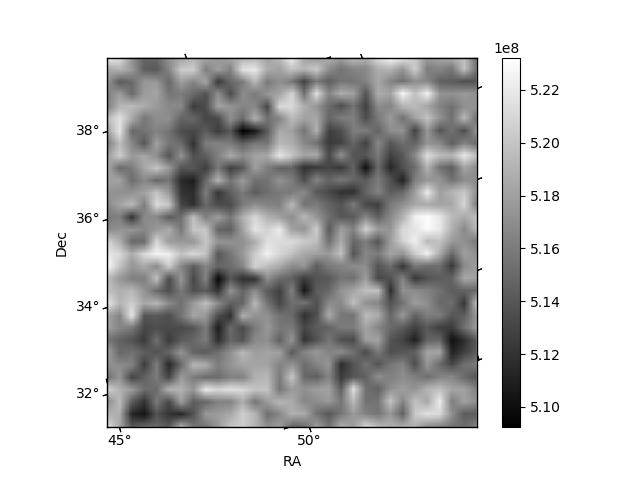
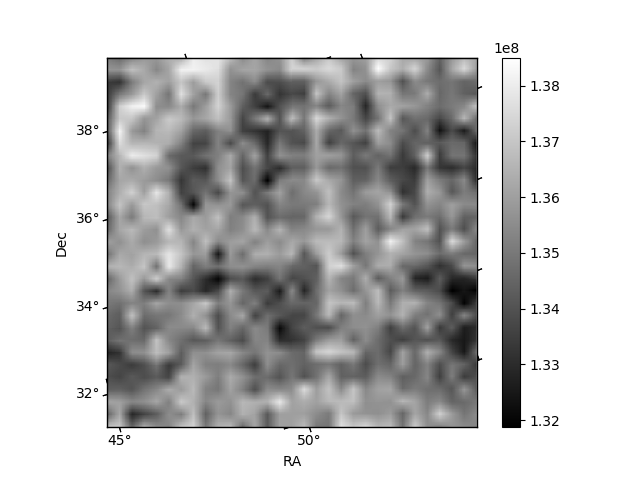
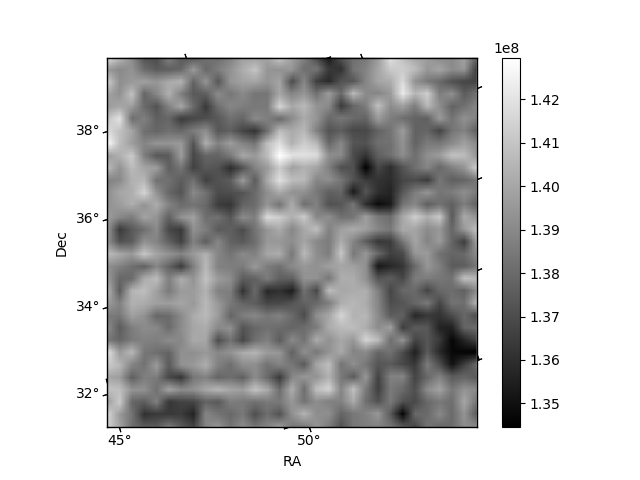
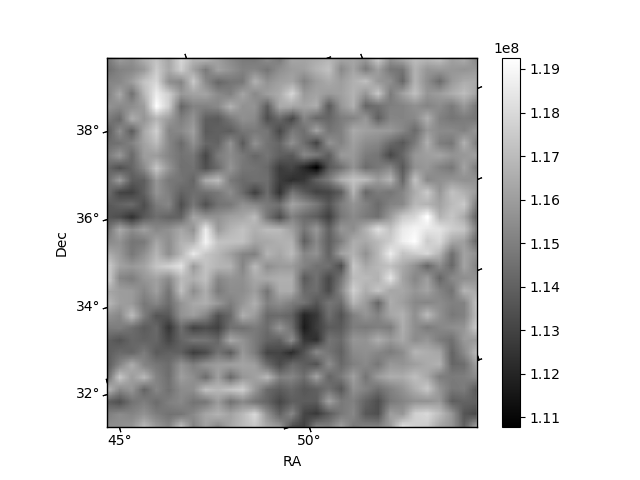
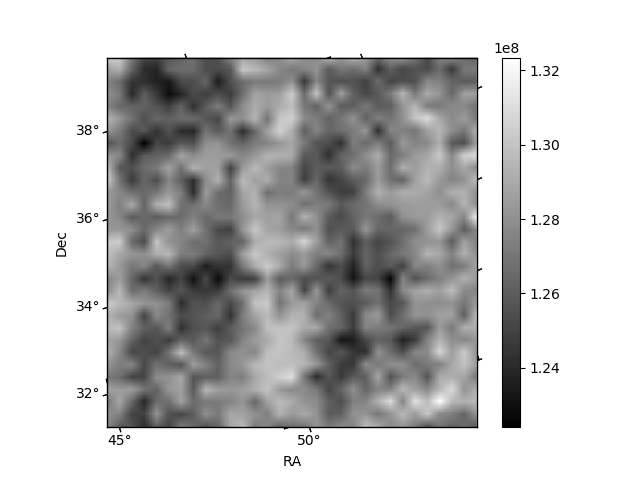
Histogram calculated using DETX and DETY for each event in the final _common_clean file
| Quadrant A | 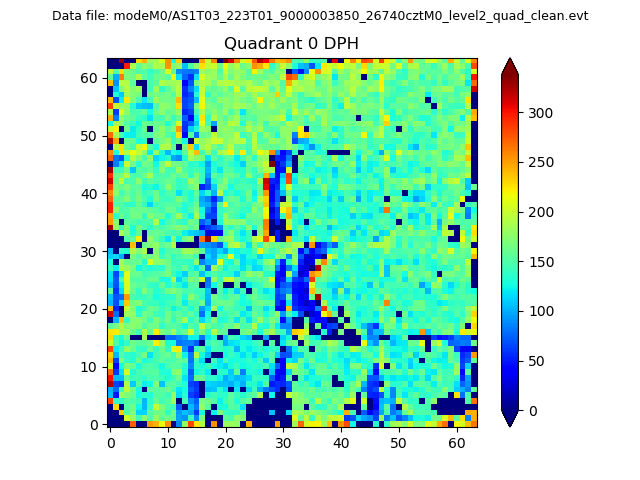 |
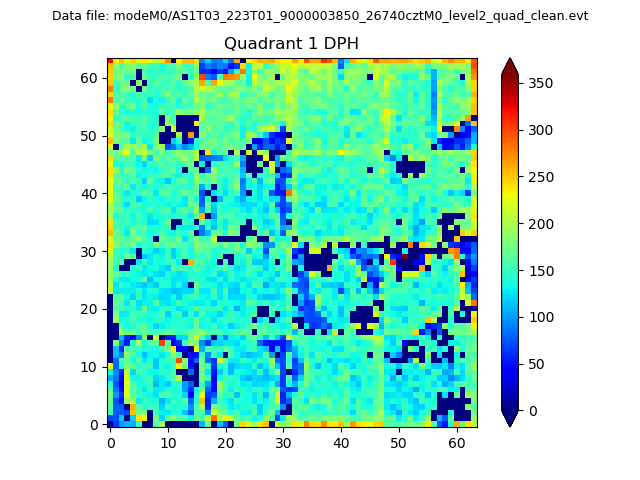 |
Quadrant B |
|---|---|---|---|
| Quadrant D | 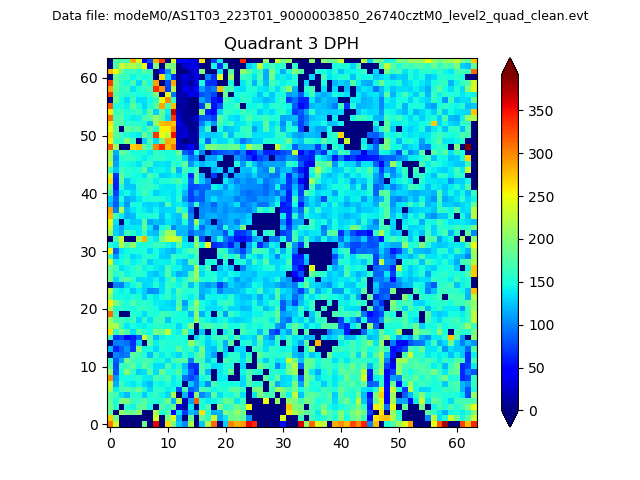 |
 |
Quadrant C |
| Plot type | Count rate plots | Images |
|---|---|---|
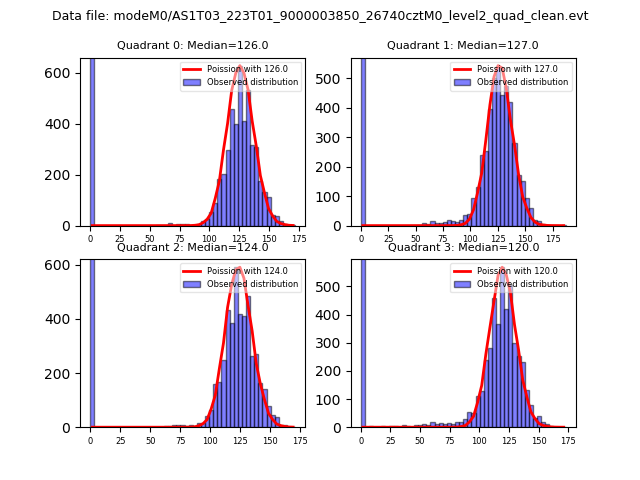
| Comparison with Poisson distribution Blue bars denote a histogram of data divided into 1 sec bins. Red curve is a Poisson curve with rate = median count rate of data. |
 |
 |
| Quadrant-wise count rates Data is divided into 100 sec bins |
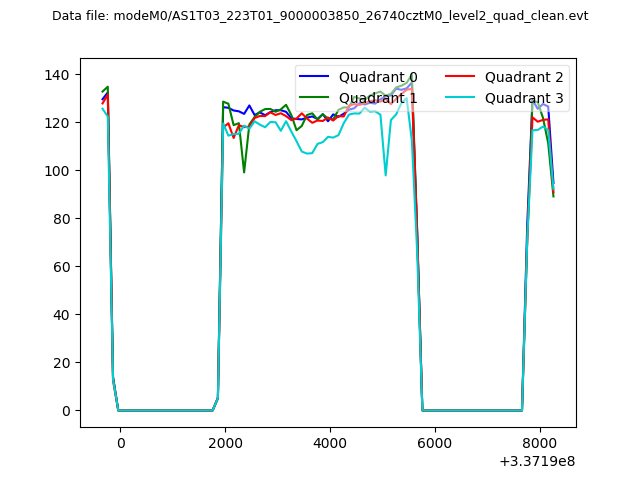 |
|
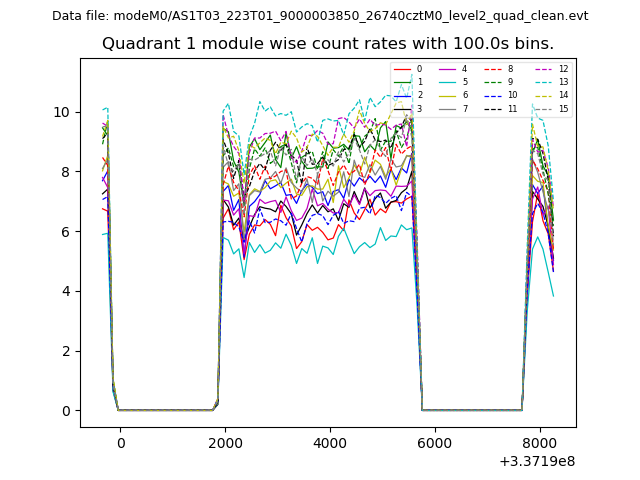
| Module-wise count rates for Quadrant A Data is divided into 100 sec bins |
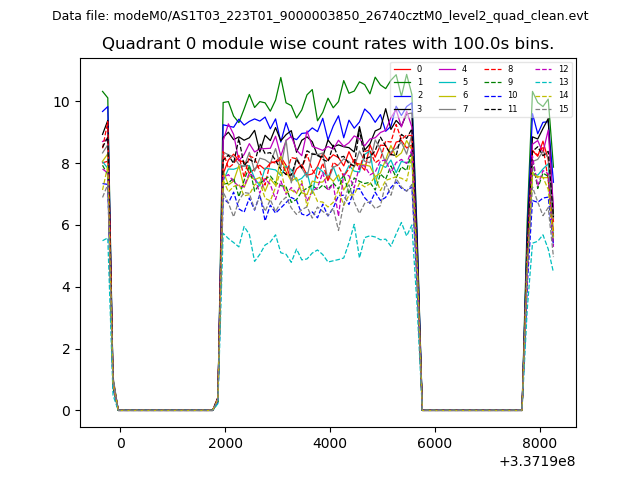 |
 |
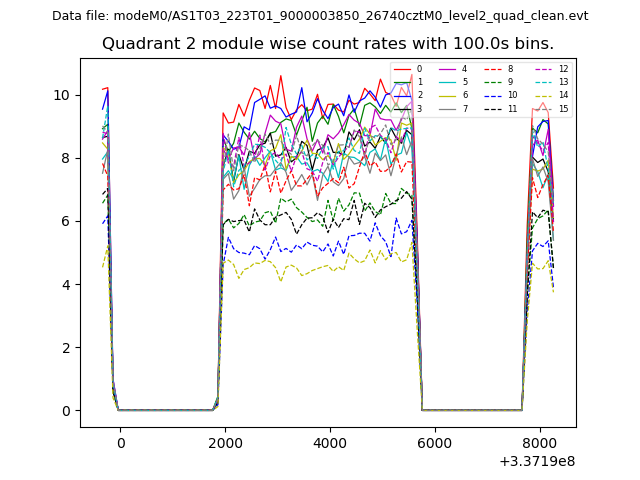
| Module-wise count rates for Quadrant B Data is divided into 100 sec bins |
 |
 |
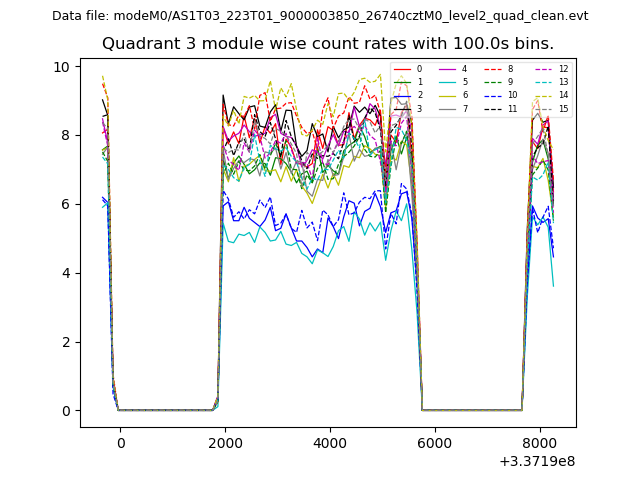
| Module-wise count rates for Quadrant C Data is divided into 100 sec bins |
 |
 |
| Module-wise count rates for Quadrant D Data is divided into 100 sec bins |
 |
 |
| Parameter | Plot |
|---|---|
| CZT HV Monitor | 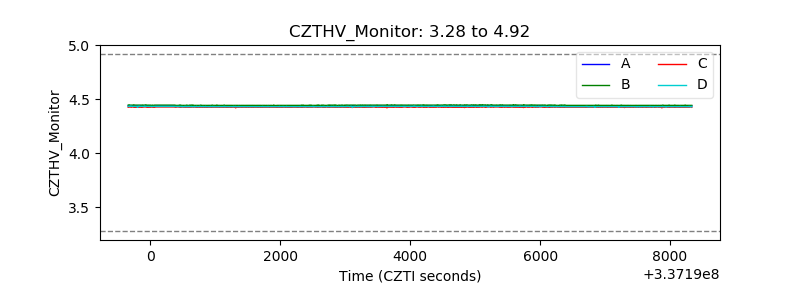 |
| D_VDD | 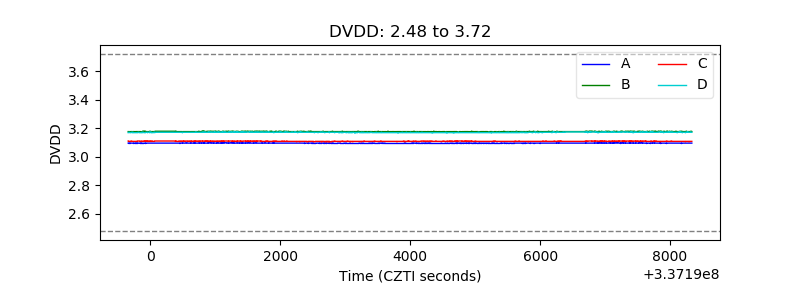 |
| Temperature 1 | 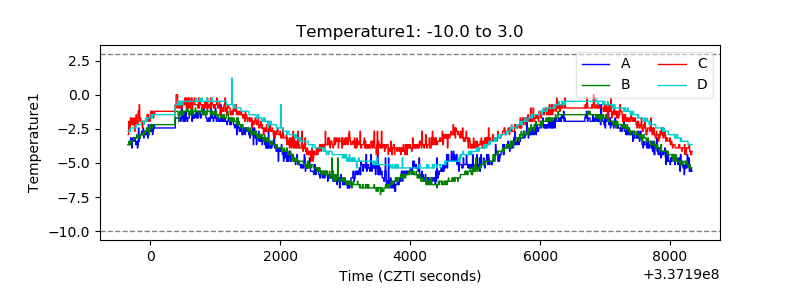 |
| Veto HV Monitor | 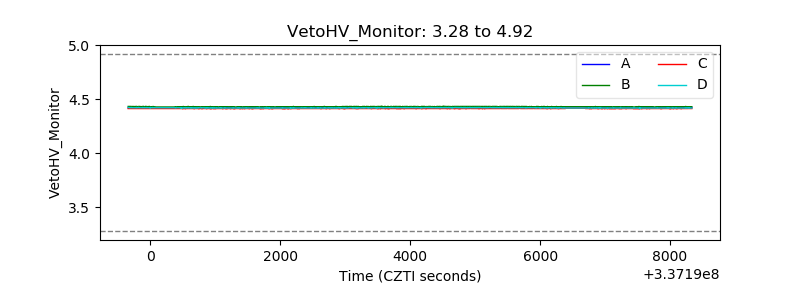 |
| Veto LLD | 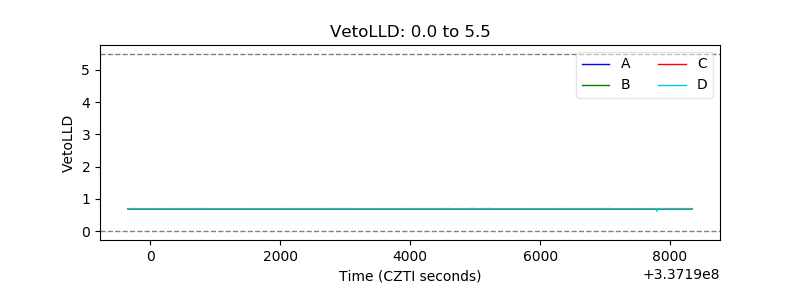 |
| Alpha Counter | 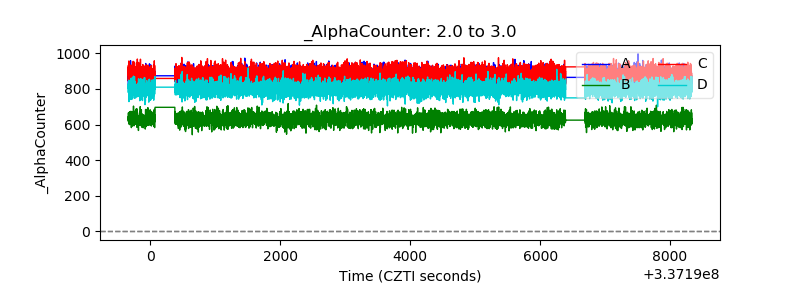 |
| _CPM_Rate | 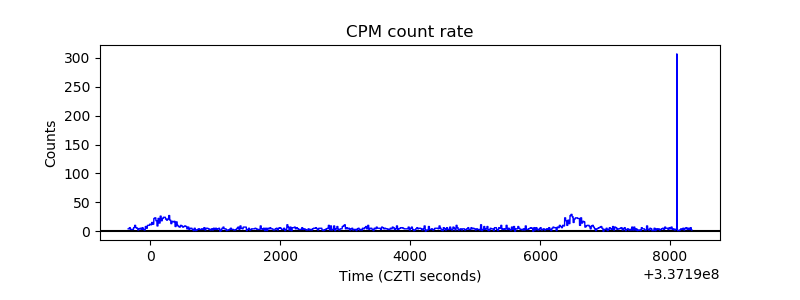 |
| CZT Counter | 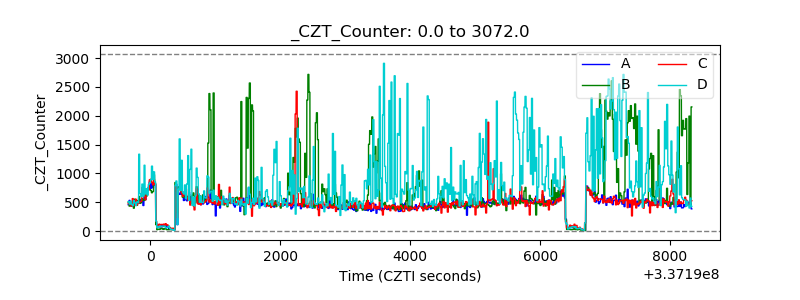 |
| +2.5 Volts monitor |  |
| +5 Volts monitor |  |
| _ROLL_ROT | 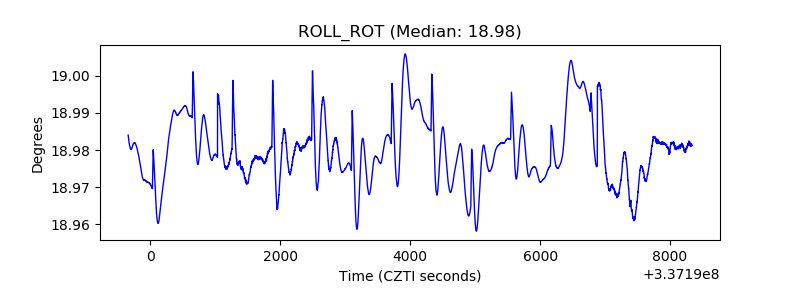 |
| _Roll_DEC |  |
| _Roll_RA | 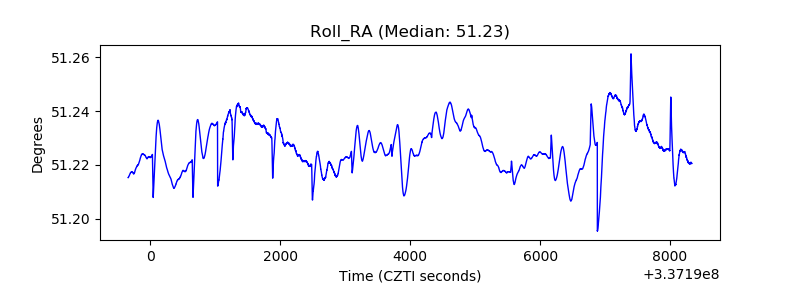 |
| Veto Counter | 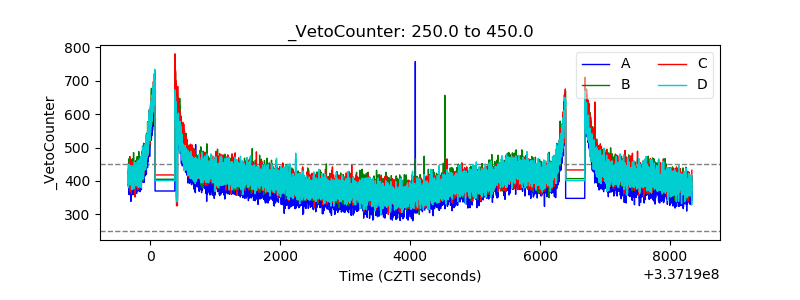 |