| Param | Original file | Final file |
|---|---|---|
| Filename | modeM0/AS1T03_223T01_9000003850_26741cztM0_level2.evt | modeM0/AS1T03_223T01_9000003850_26741cztM0_level2_quad_clean.evt |
| Size (bytes) | 587,053,440 | 80,406,720 |
| Size | 559.9 MB | 76.7 MB |
| Events in quadrant A | 3,269,208 | 496,444 |
| Events in quadrant B | 4,760,423 | 498,746 |
| Events in quadrant C | 3,491,346 | 489,092 |
| Events in quadrant D | 5,796,961 | 476,722 |
| Mode M9 | |||
|---|---|---|---|
| Quadrant | BADHDUFLAG | Total packets | Discarded packets |
| A | 0 | 8 | 0 |
| B | 0 | 8 | 0 |
| C | 0 | 8 | 0 |
| D | 0 | 8 | 0 |
| Mode M0 | |||
|---|---|---|---|
| Quadrant | BADHDUFLAG | Total packets | Discarded packets |
| A | 0 | 14132 | 0 |
| B | 0 | 18693 | 0 |
| C | 0 | 14637 | 0 |
| D | 0 | 21930 | 0 |
| Quadrant | Total seconds | Saturated seconds | Saturation percentage |
|---|---|---|---|
| A | 6797 | 95 | 1.397675% |
| B | 6798 | 601 | 8.840836% |
| C | 6798 | 193 | 2.839070% |
| D | 6798 | 891 | 13.106796% |
Noise dominated data is calculated using 1-second bins in cleaned event files. If a bin has >2000 counts, and if more than 50% of those come from <1% of pixels, then it is considered to be noise-dominated and hence unusable.
| Quadrant | # 1 sec bins | Bins with >0 counts | Bins with >2000 counts | High rate bins dominated by noise | Noise dominated (total time) | Noise dominated (detector-on time) | Marked lightcurve |
|---|---|---|---|---|---|---|---|
| A | 7572 | 6799 | 0 | 0 | 0.00% | 0.00% | 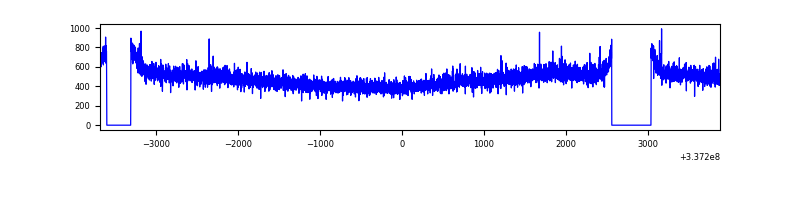 |
| B | 7573 | 6800 | 310 | 310 | 4.09% | 4.56% | 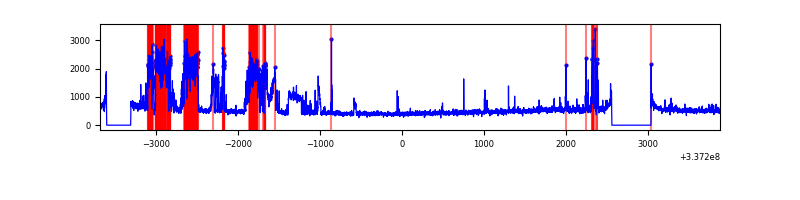 |
| C | 7573 | 6800 | 25 | 25 | 0.33% | 0.37% | 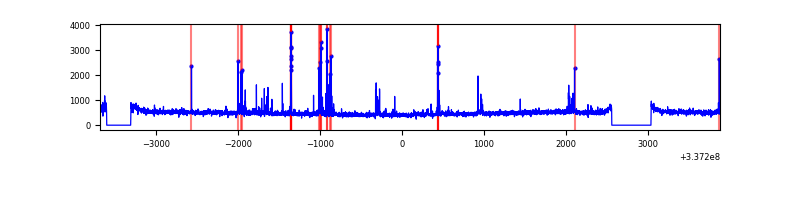 |
| D | 7573 | 6800 | 465 | 465 | 6.14% | 6.84% | 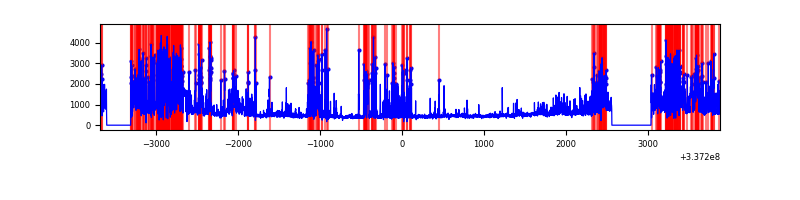 |
Top three noisy pixels from each quadrant. If the there are fewer than three noisy pixels in the level2.evt file, extra rows are filled as -1
| Pixel properties | Quadrant properties | ||||||
|---|---|---|---|---|---|---|---|
| Quadrant | DetID | PixID | Counts | Sigma | Mean | Median | Sigma |
| A | 13 | 254 | 10735 | 58.22 | 841 | 822 | 170.3 |
| A | 0 | 13 | 8201 | 43.34 | 841 | 822 | 170.3 |
| A | 3 | 137 | 8057 | 42.5 | 841 | 822 | 170.3 |
| B | 0 | 189 | 1480653 | 9485.14 | 815 | 794 | 156.0 |
| B | 10 | 246 | 29657 | 185.0 | 815 | 794 | 156.0 |
| B | 12 | 111 | 19259 | 118.35 | 815 | 794 | 156.0 |
| C | 15 | 208 | 133572 | 694.49 | 803 | 805 | 191.2 |
| C | 14 | 238 | 126178 | 655.81 | 803 | 805 | 191.2 |
| C | 2 | 16 | 83841 | 434.35 | 803 | 805 | 191.2 |
| D | 1 | 52 | 1660858 | 8105.89 | 775 | 757 | 204.8 |
| D | 7 | 80 | 647149 | 3156.18 | 775 | 757 | 204.8 |
| D | 2 | 250 | 315413 | 1536.39 | 775 | 757 | 204.8 |
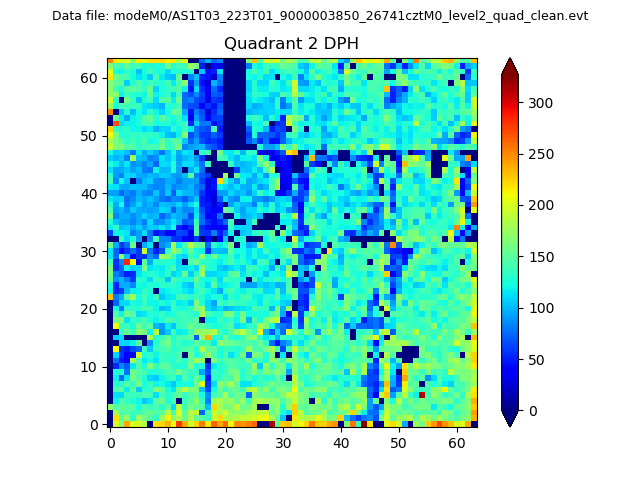
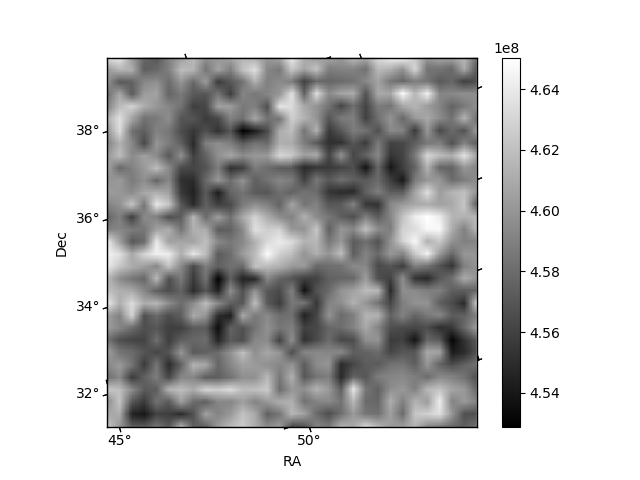
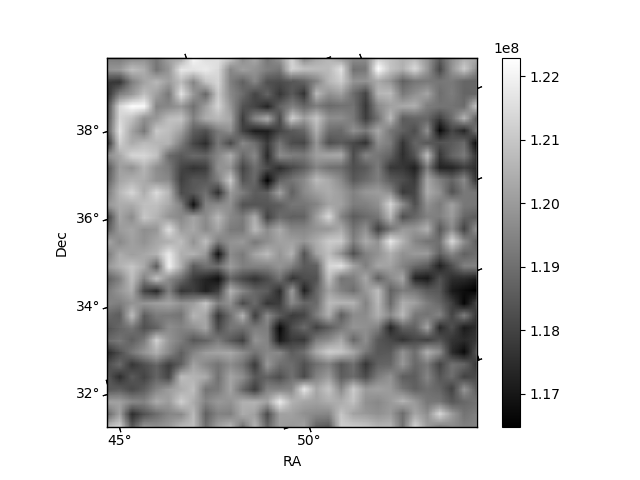
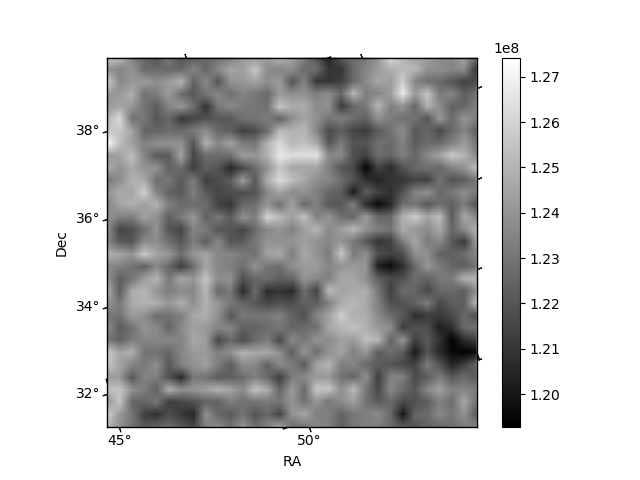
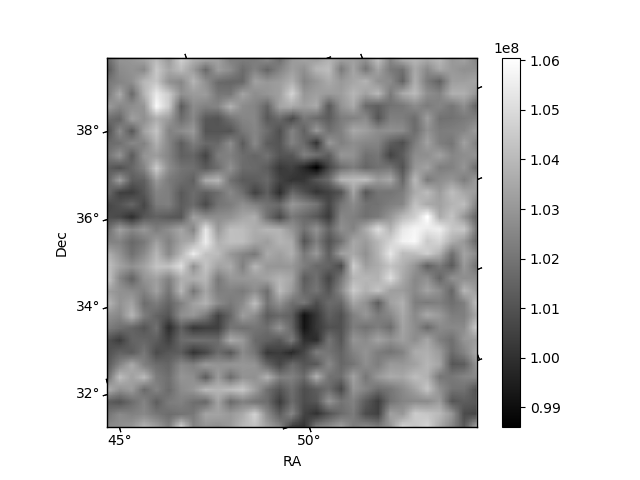
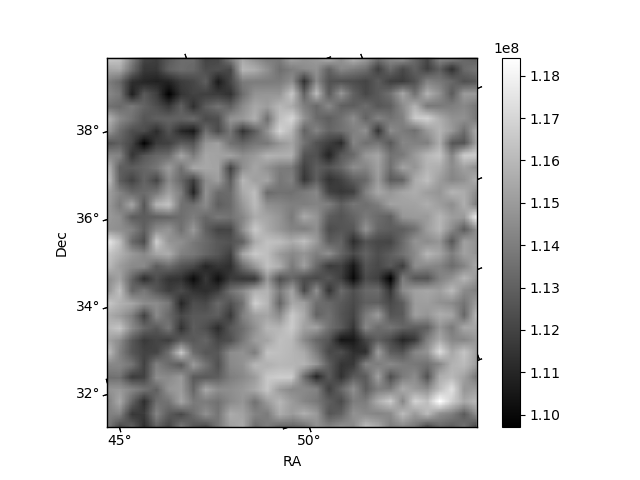
Histogram calculated using DETX and DETY for each event in the final _common_clean file
| Quadrant A | 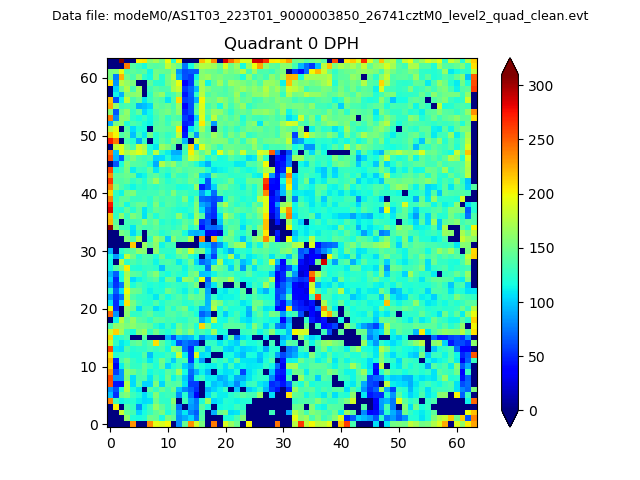 |
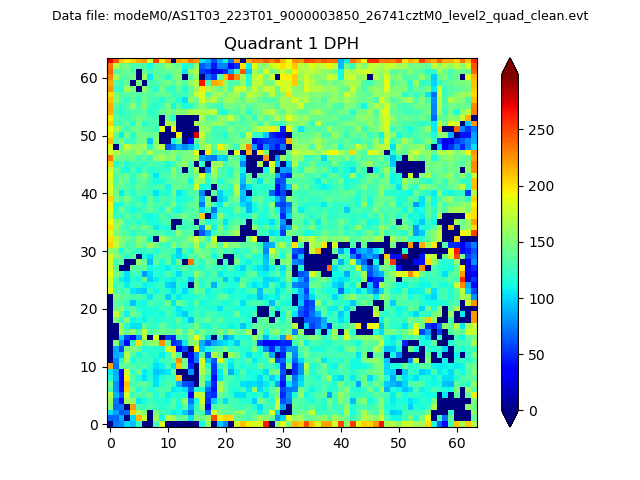 |
Quadrant B |
|---|---|---|---|
| Quadrant D | 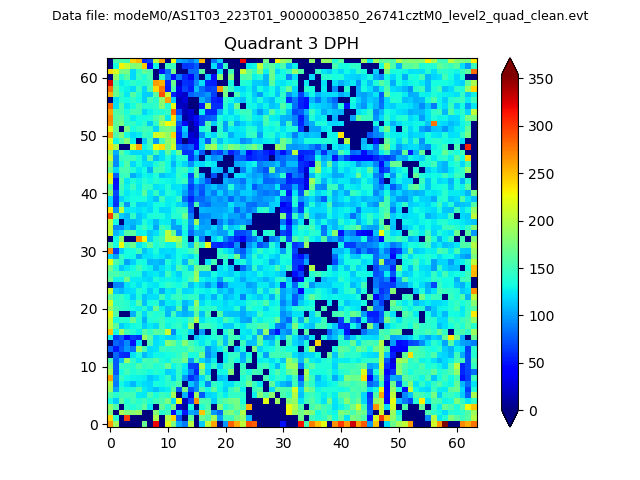 |
 |
Quadrant C |
| Plot type | Count rate plots | Images |
|---|---|---|
| Comparison with Poisson distribution Blue bars denote a histogram of data divided into 1 sec bins. Red curve is a Poisson curve with rate = median count rate of data. |
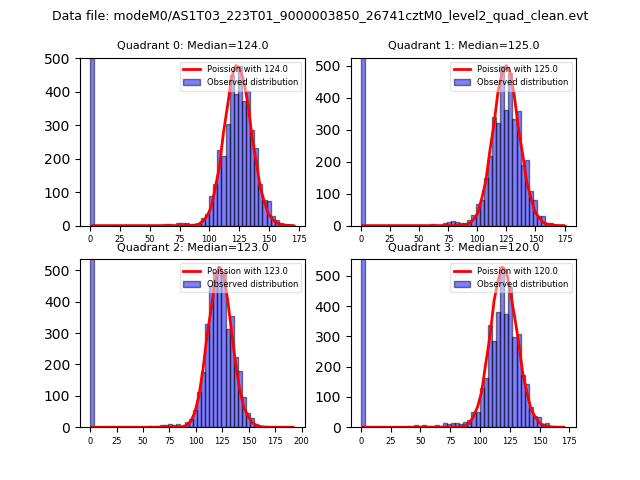 |
 |
| Quadrant-wise count rates Data is divided into 100 sec bins |
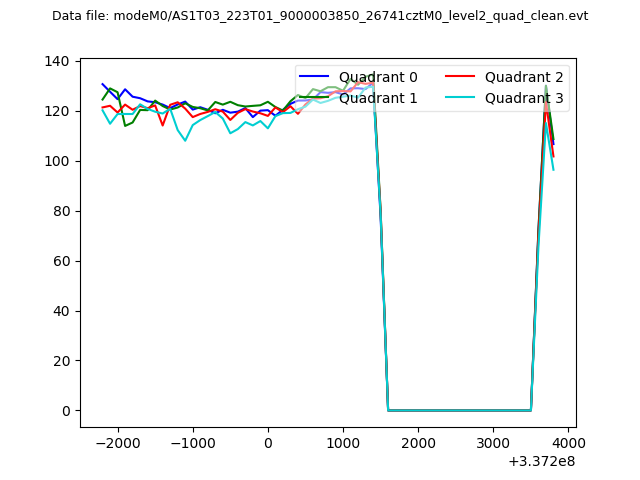 |
|
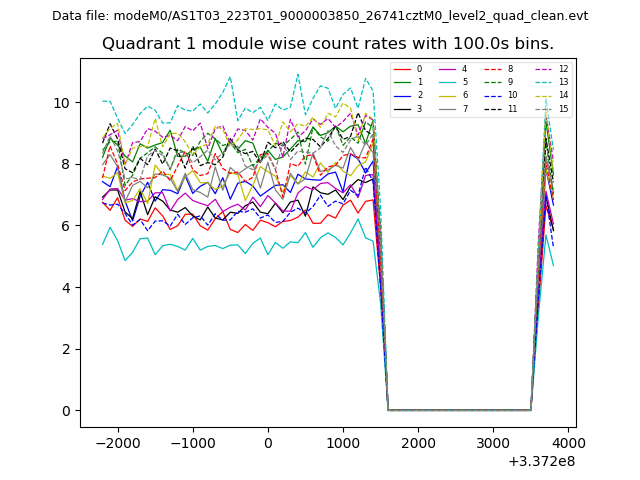
| Module-wise count rates for Quadrant A Data is divided into 100 sec bins |
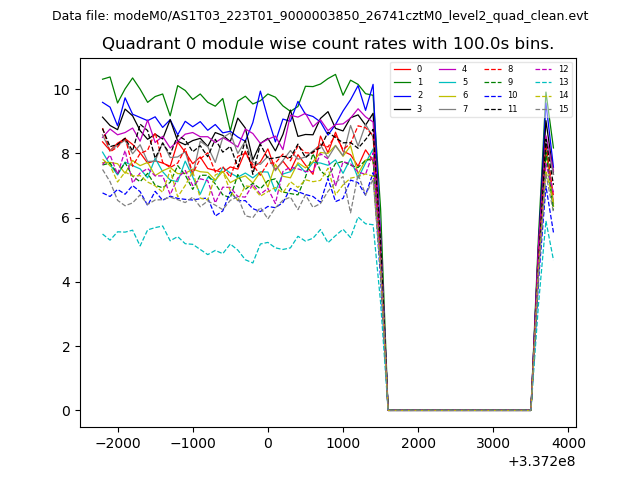 |
 |
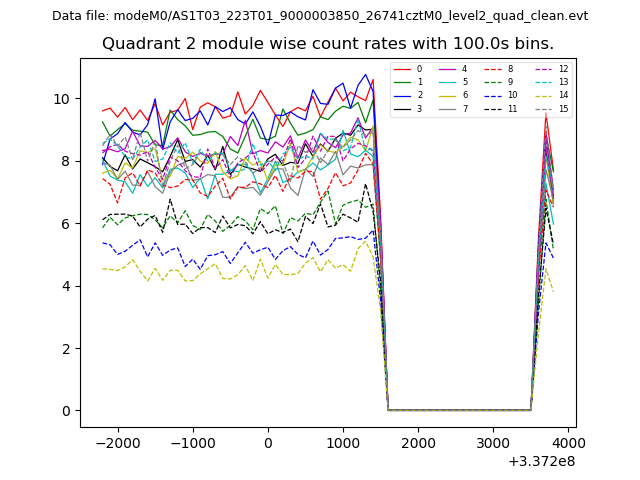
| Module-wise count rates for Quadrant B Data is divided into 100 sec bins |
 |
 |
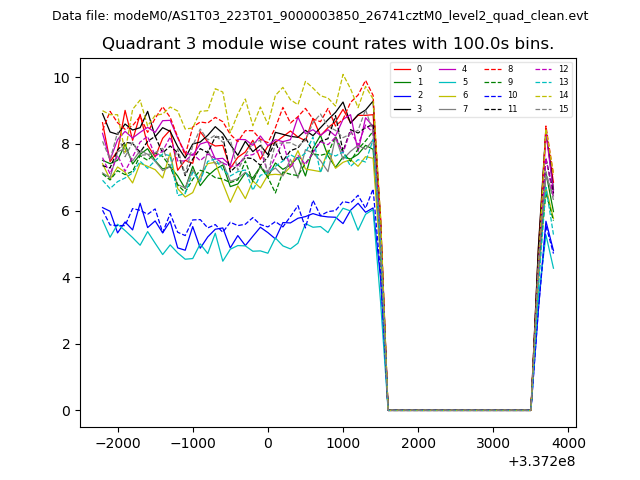
| Module-wise count rates for Quadrant C Data is divided into 100 sec bins |
 |
 |
| Module-wise count rates for Quadrant D Data is divided into 100 sec bins |
 |
 |
| Parameter | Plot |
|---|---|
| CZT HV Monitor | 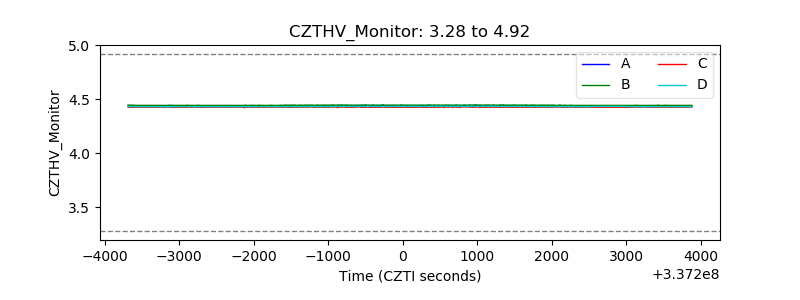 |
| D_VDD | 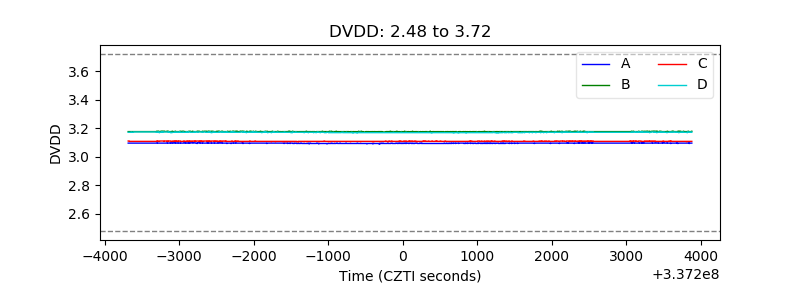 |
| Temperature 1 | 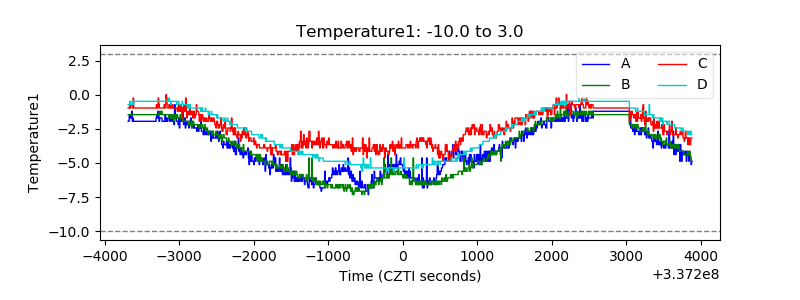 |
| Veto HV Monitor | 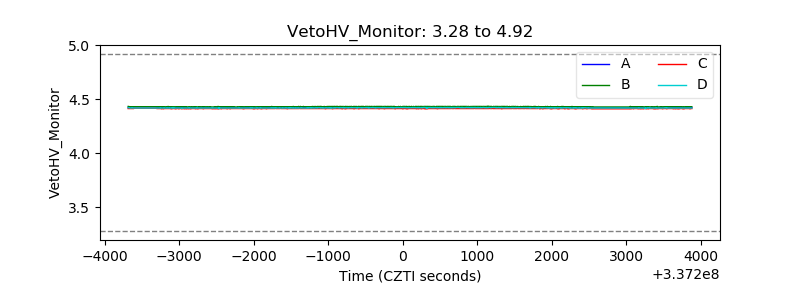 |
| Veto LLD | 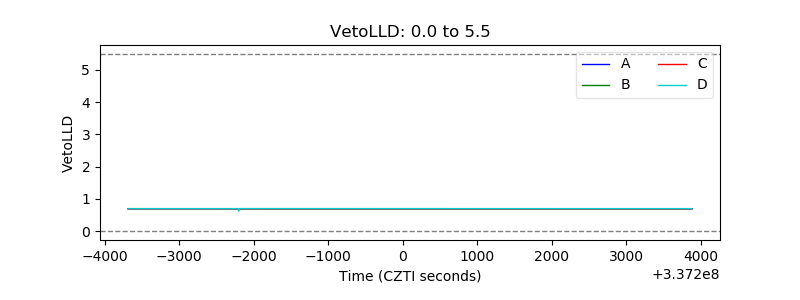 |
| Alpha Counter | 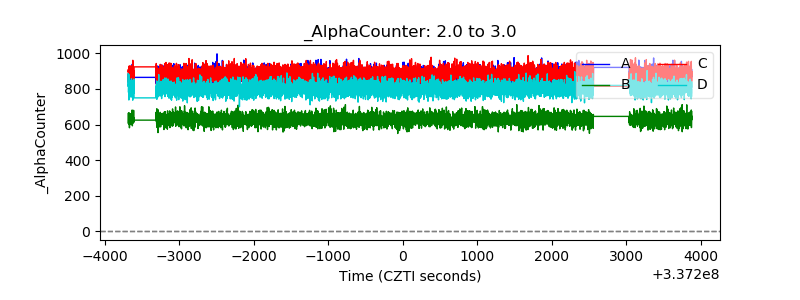 |
| _CPM_Rate | 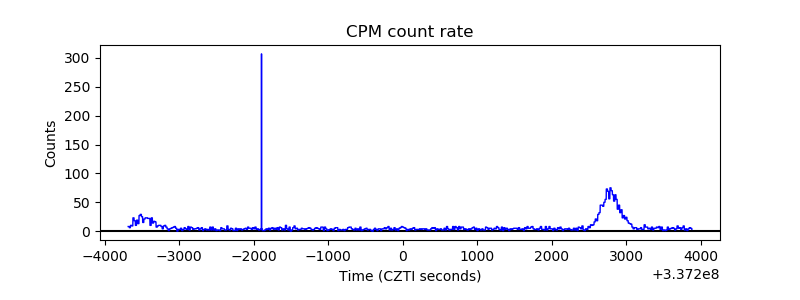 |
| CZT Counter | 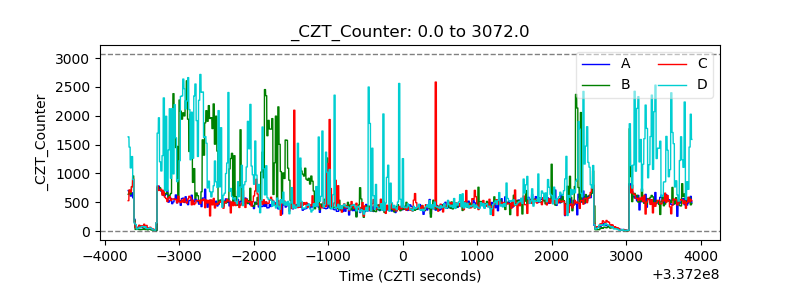 |
| +2.5 Volts monitor |  |
| +5 Volts monitor | 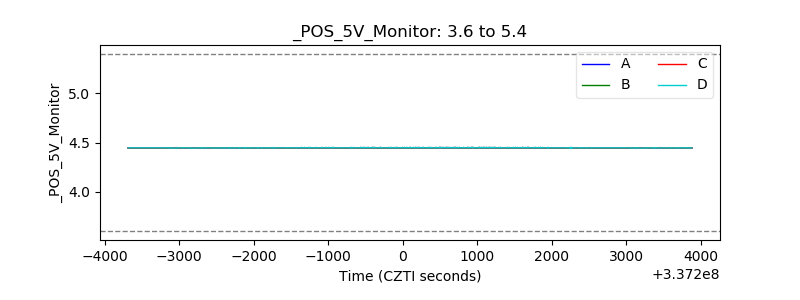 |
| _ROLL_ROT | 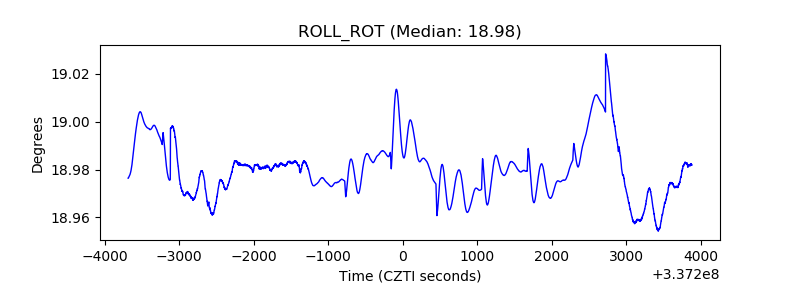 |
| _Roll_DEC | 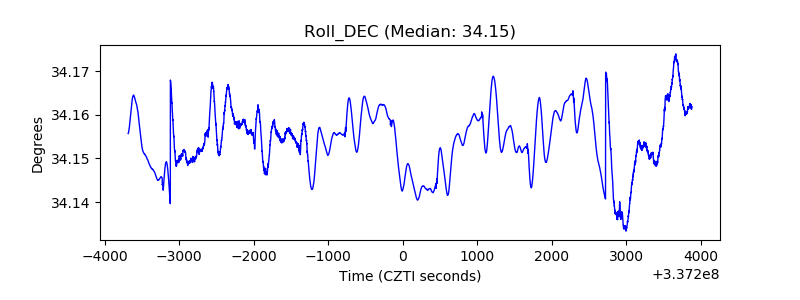 |
| _Roll_RA | 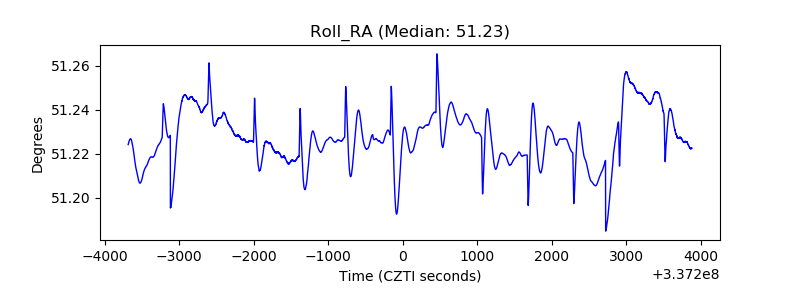 |
| Veto Counter | 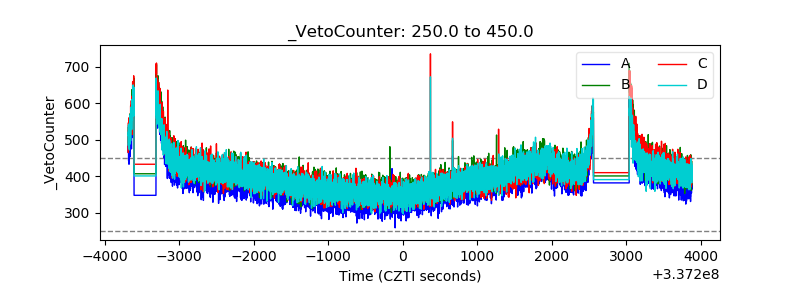 |