| Param | Original file | Final file |
|---|---|---|
| Filename | modeM0/AS1T03_223T01_9000003850_26743cztM0_level2.evt | modeM0/AS1T03_223T01_9000003850_26743cztM0_level2_quad_clean.evt |
| Size (bytes) | 1,156,368,960 | 171,910,080 |
| Size | 1.1 GB | 163.9 MB |
| Events in quadrant A | 5,929,788 | 1,123,029 |
| Events in quadrant B | 8,844,594 | 1,102,824 |
| Events in quadrant C | 6,797,913 | 1,103,645 |
| Events in quadrant D | 12,593,755 | 1,001,243 |
| Mode M9 | |||
|---|---|---|---|
| Quadrant | BADHDUFLAG | Total packets | Discarded packets |
| A | 0 | 15 | 0 |
| B | 0 | 15 | 0 |
| C | 0 | 15 | 0 |
| D | 0 | 15 | 0 |
| Mode M0 | |||
|---|---|---|---|
| Quadrant | BADHDUFLAG | Total packets | Discarded packets |
| A | 0 | 26004 | 0 |
| B | 0 | 34815 | 0 |
| C | 0 | 28492 | 0 |
| D | 0 | 46125 | 0 |
| Quadrant | Total seconds | Saturated seconds | Saturation percentage |
|---|---|---|---|
| A | 12662 | 52 | 0.410678% |
| B | 12662 | 1214 | 9.587743% |
| C | 12662 | 374 | 2.953720% |
| D | 12662 | 2045 | 16.150687% |
Noise dominated data is calculated using 1-second bins in cleaned event files. If a bin has >2000 counts, and if more than 50% of those come from <1% of pixels, then it is considered to be noise-dominated and hence unusable.
| Quadrant | # 1 sec bins | Bins with >0 counts | Bins with >2000 counts | High rate bins dominated by noise | Noise dominated (total time) | Noise dominated (detector-on time) | Marked lightcurve |
|---|---|---|---|---|---|---|---|
| A | 14097 | 12664 | 0 | 0 | 0.00% | 0.00% | 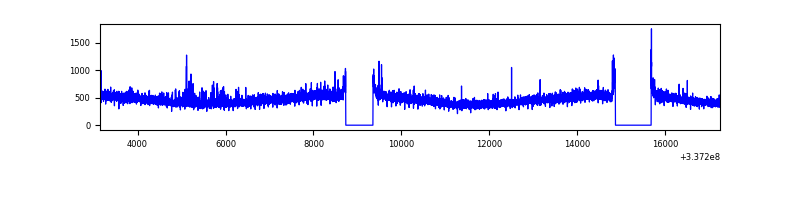 |
| B | 14096 | 12663 | 776 | 776 | 5.51% | 6.13% | 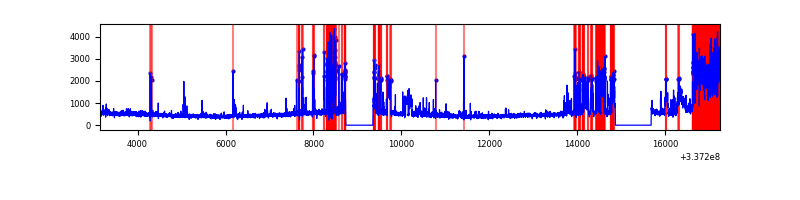 |
| C | 14097 | 12664 | 140 | 140 | 0.99% | 1.11% | 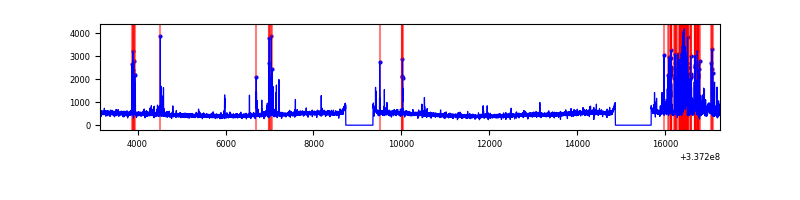 |
| D | 14097 | 12664 | 1405 | 1405 | 9.97% | 11.09% | 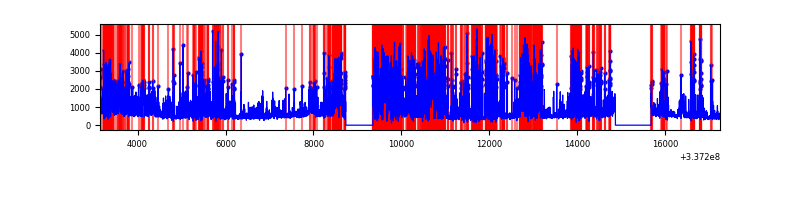 |
Top three noisy pixels from each quadrant. If the there are fewer than three noisy pixels in the level2.evt file, extra rows are filled as -1
| Pixel properties | Quadrant properties | ||||||
|---|---|---|---|---|---|---|---|
| Quadrant | DetID | PixID | Counts | Sigma | Mean | Median | Sigma |
| A | 0 | 13 | 82545 | 265.79 | 1513 | 1478 | 305.0 |
| A | 13 | 254 | 20566 | 62.58 | 1513 | 1478 | 305.0 |
| A | 3 | 137 | 14462 | 42.57 | 1513 | 1478 | 305.0 |
| B | 0 | 189 | 3021748 | 10877.28 | 1456 | 1420 | 277.7 |
| B | 10 | 246 | 72458 | 255.83 | 1456 | 1420 | 277.7 |
| B | 12 | 111 | 34589 | 119.45 | 1456 | 1420 | 277.7 |
| C | 2 | 16 | 747587 | 2185.15 | 1451 | 1458 | 341.5 |
| C | 14 | 238 | 228681 | 665.46 | 1451 | 1458 | 341.5 |
| C | 15 | 208 | 147486 | 427.66 | 1451 | 1458 | 341.5 |
| D | 7 | 80 | 4491350 | 12522.99 | 1357 | 1323 | 358.5 |
| D | 1 | 52 | 2258304 | 6294.87 | 1357 | 1323 | 358.5 |
| D | 2 | 250 | 419164 | 1165.39 | 1357 | 1323 | 358.5 |
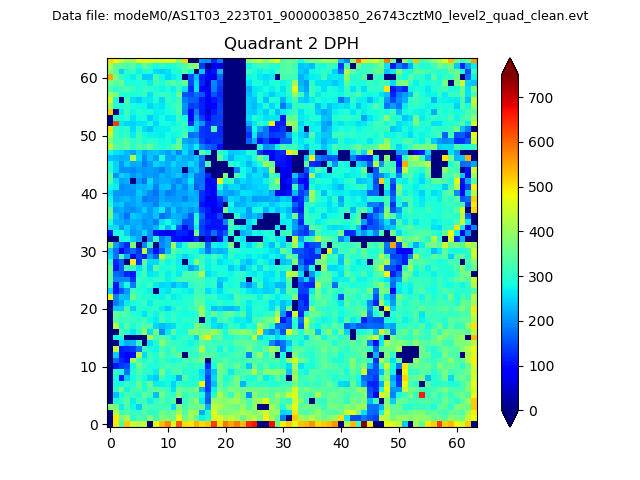
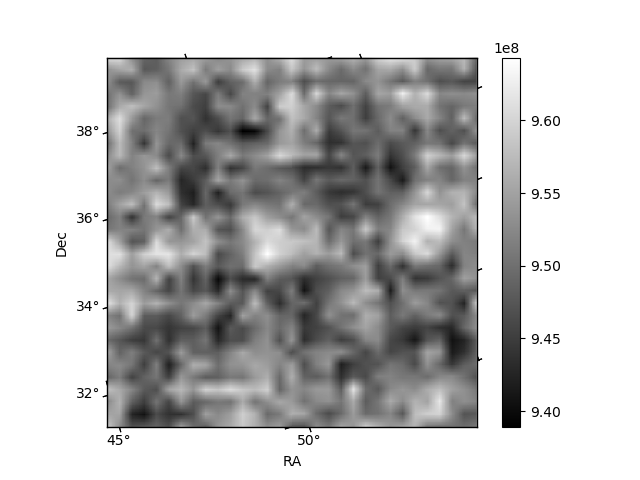
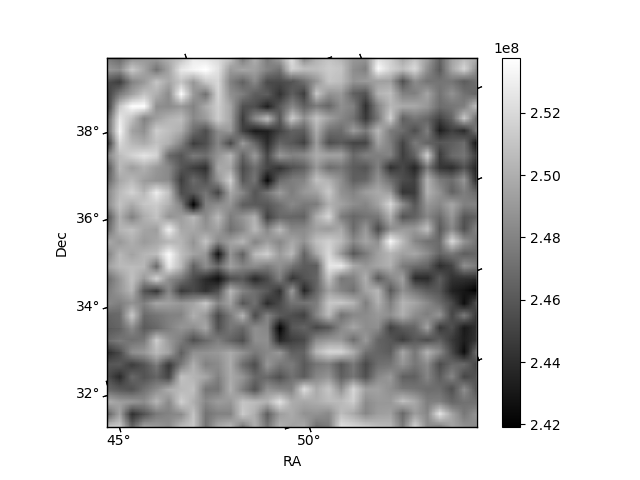
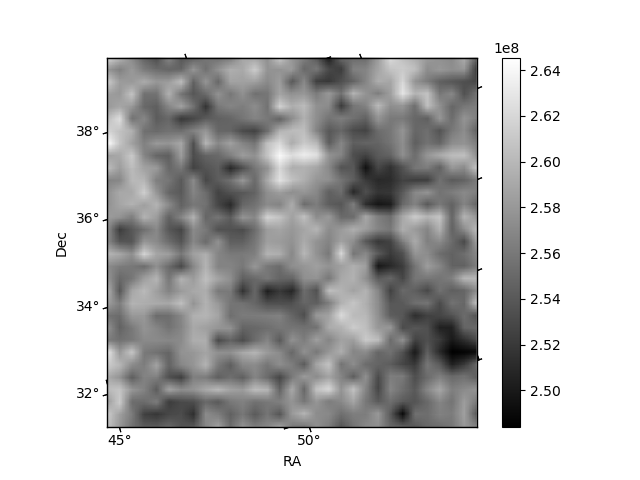
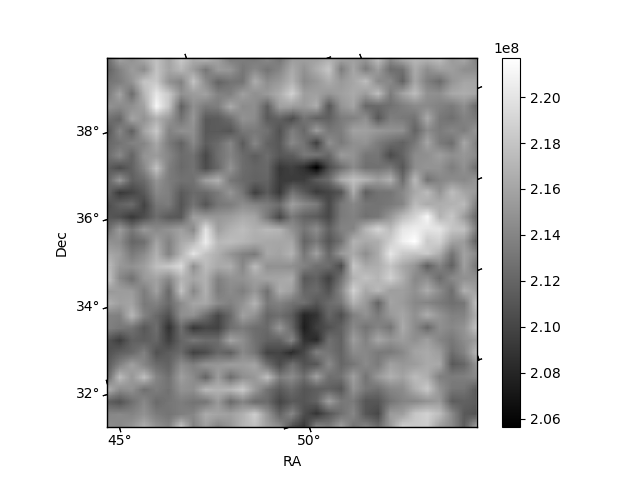
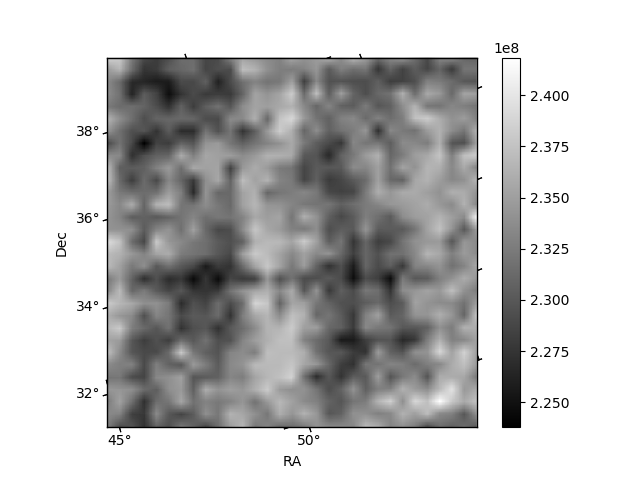
Histogram calculated using DETX and DETY for each event in the final _common_clean file
| Quadrant A | 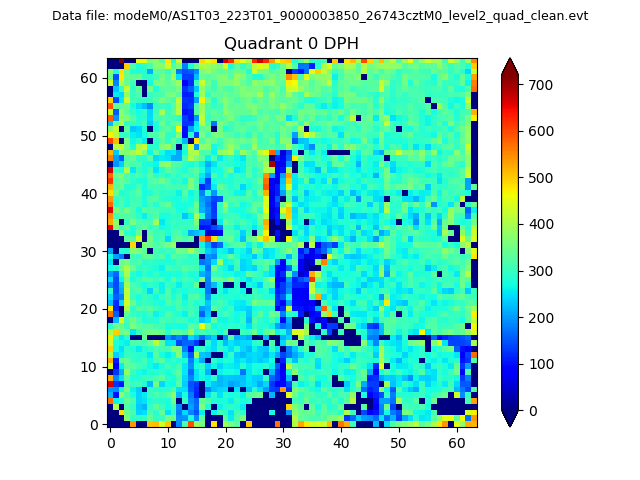 |
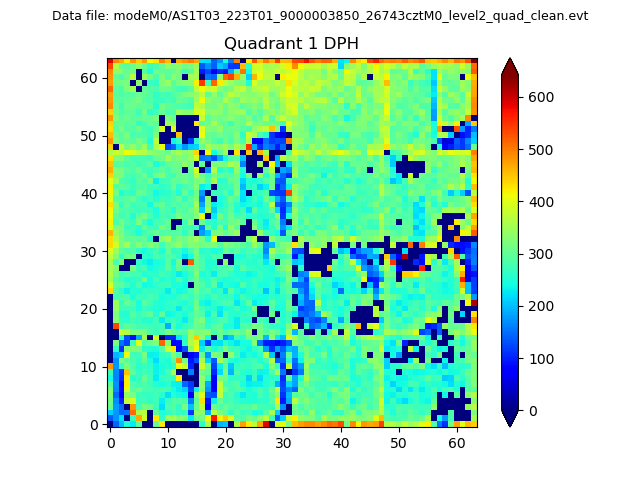 |
Quadrant B |
|---|---|---|---|
| Quadrant D | 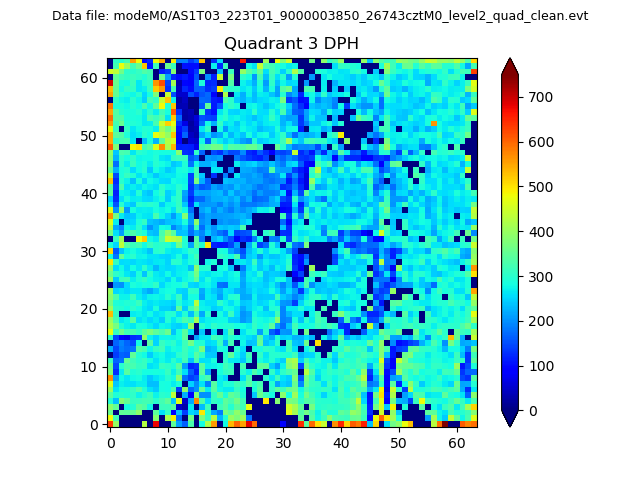 |
 |
Quadrant C |
| Plot type | Count rate plots | Images |
|---|---|---|
| Comparison with Poisson distribution Blue bars denote a histogram of data divided into 1 sec bins. Red curve is a Poisson curve with rate = median count rate of data. |
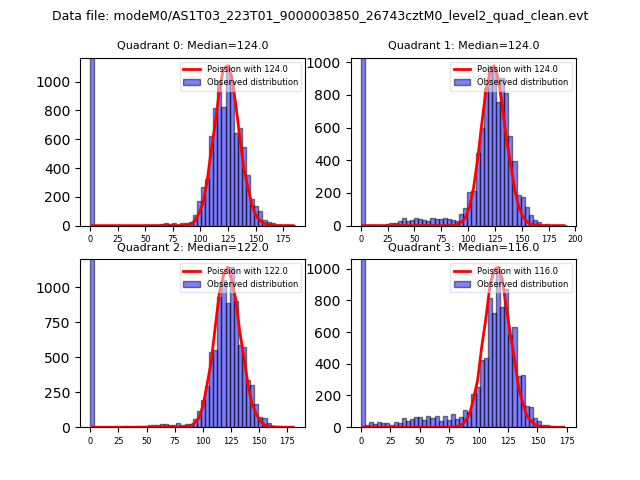 |
 |
| Quadrant-wise count rates Data is divided into 100 sec bins |
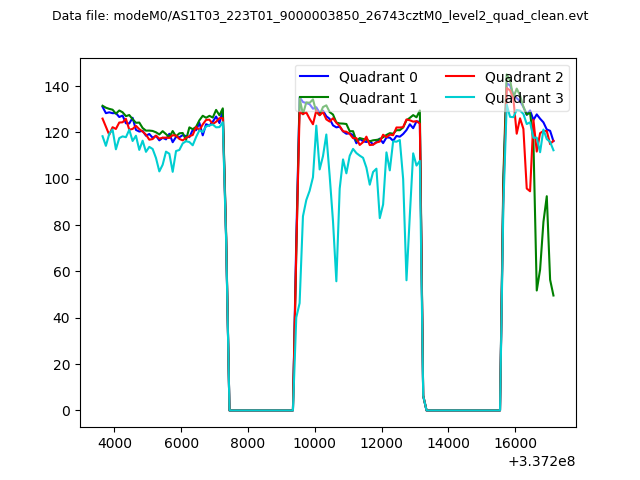 |
|
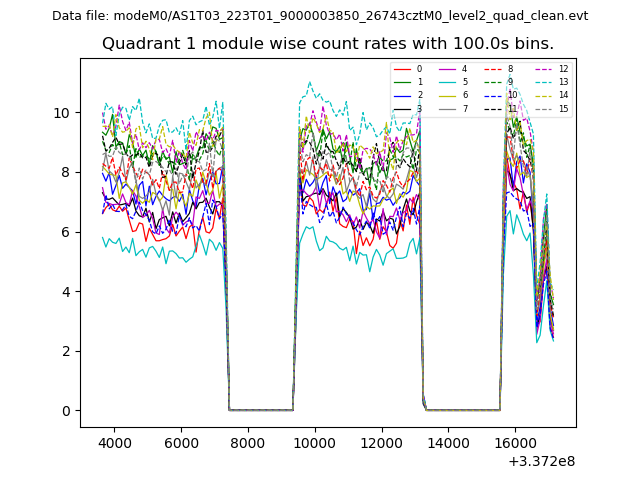
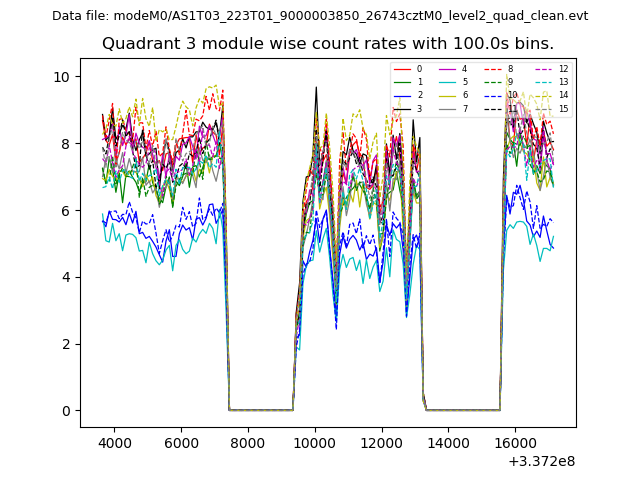
| Module-wise count rates for Quadrant A Data is divided into 100 sec bins |
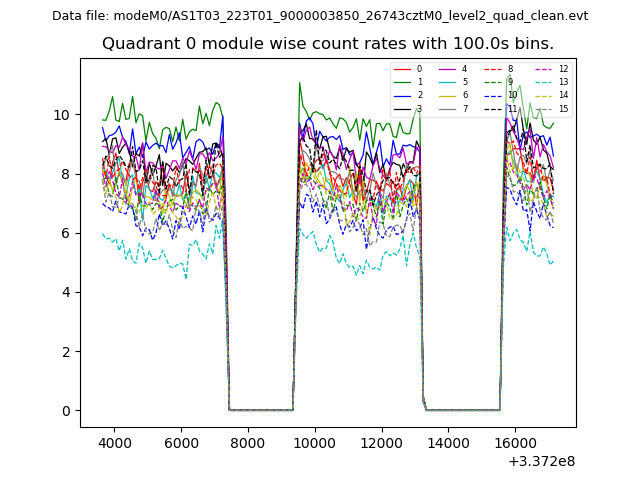 |
 |
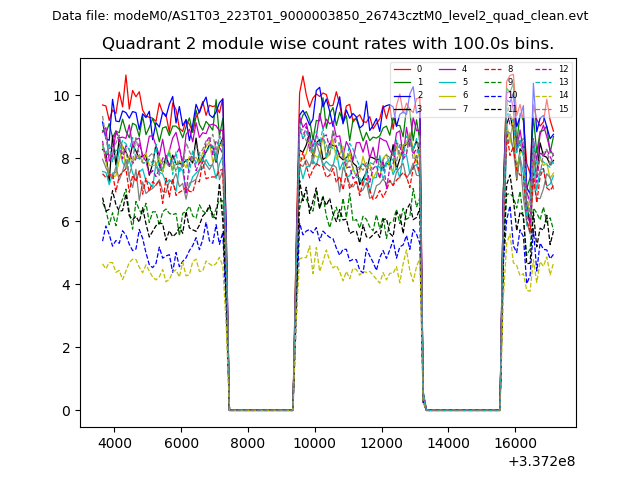
| Module-wise count rates for Quadrant B Data is divided into 100 sec bins |
 |
 |
| Module-wise count rates for Quadrant C Data is divided into 100 sec bins |
 |
 |
| Module-wise count rates for Quadrant D Data is divided into 100 sec bins |
 |
 |
| Parameter | Plot |
|---|---|
| CZT HV Monitor | 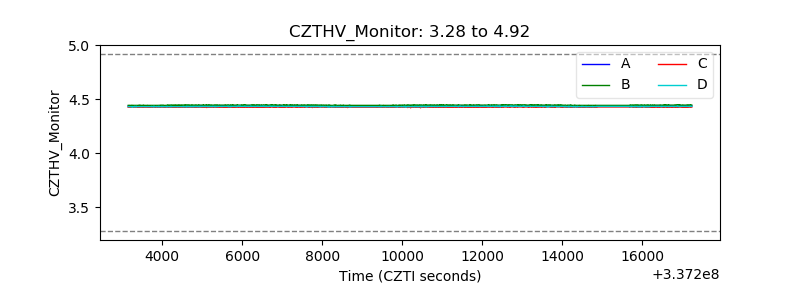 |
| D_VDD | 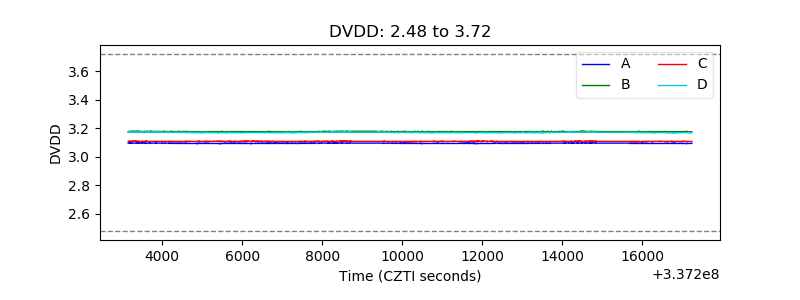 |
| Temperature 1 | 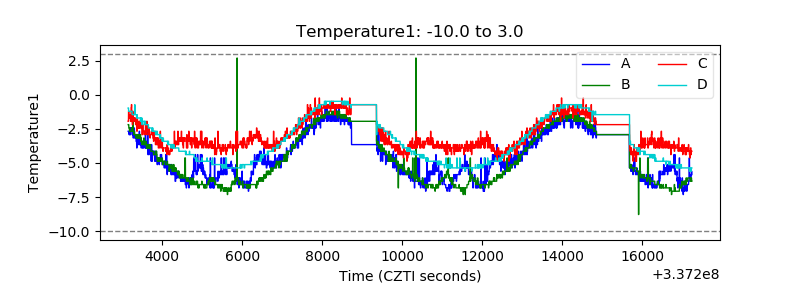 |
| Veto HV Monitor |  |
| Veto LLD | 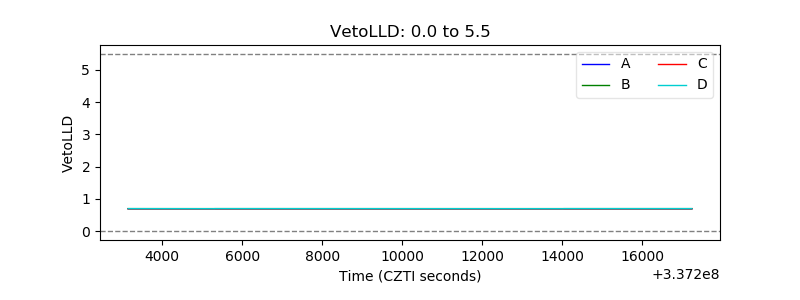 |
| Alpha Counter | 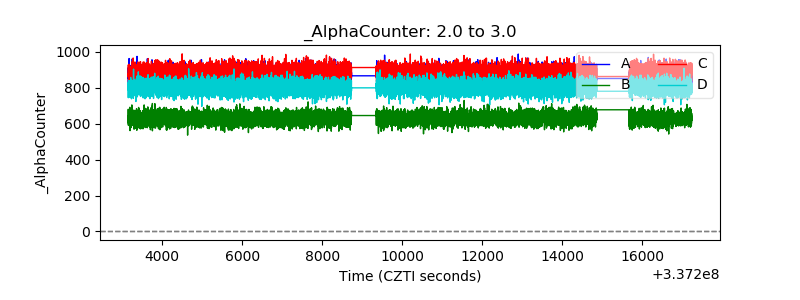 |
| _CPM_Rate | 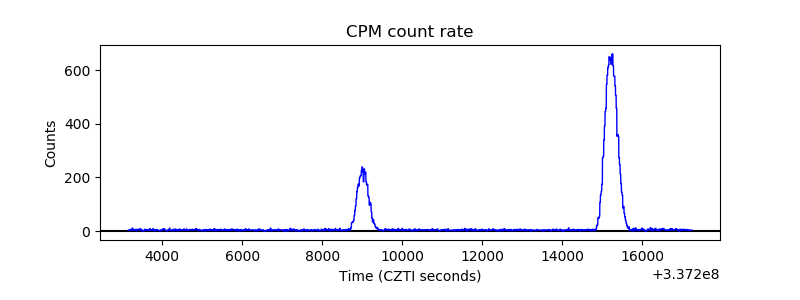 |
| CZT Counter | 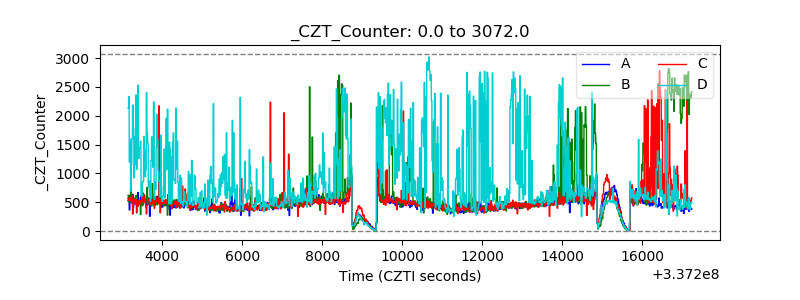 |
| +2.5 Volts monitor | 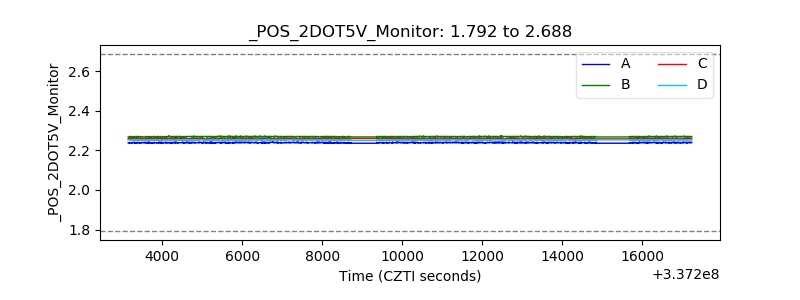 |
| +5 Volts monitor |  |
| _ROLL_ROT | 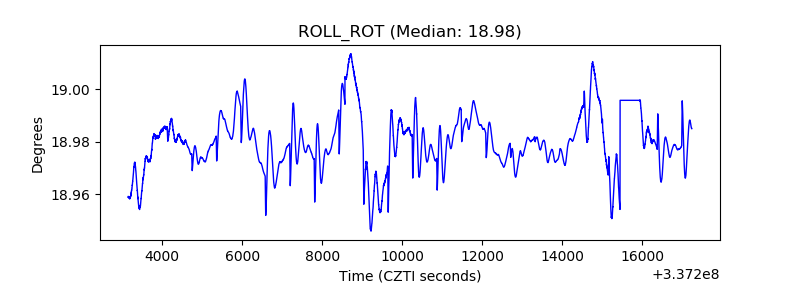 |
| _Roll_DEC | 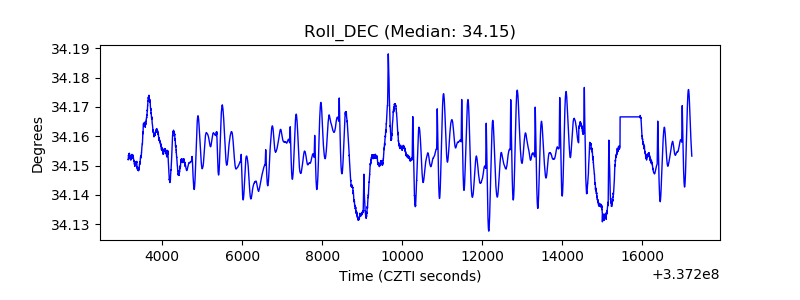 |
| _Roll_RA | 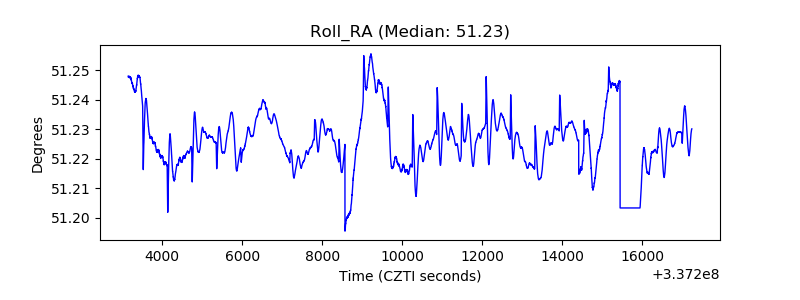 |
| Veto Counter | 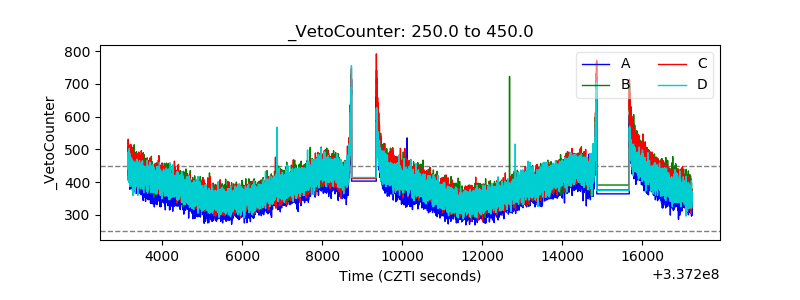 |