| Param | Original file | Final file |
|---|---|---|
| Filename | modeM0/AS1T03_223T01_9000003850_26744cztM0_level2.evt | modeM0/AS1T03_223T01_9000003850_26744cztM0_level2_quad_clean.evt |
| Size (bytes) | 789,926,400 | 92,692,800 |
| Size | 753.3 MB | 88.4 MB |
| Events in quadrant A | 3,177,232 | 618,246 |
| Events in quadrant B | 11,338,346 | 526,916 |
| Events in quadrant C | 4,065,658 | 604,791 |
| Events in quadrant D | 4,884,336 | 584,502 |
| Mode M9 | |||
|---|---|---|---|
| Quadrant | BADHDUFLAG | Total packets | Discarded packets |
| A | 0 | 18 | 0 |
| B | 0 | 18 | 0 |
| C | 0 | 18 | 0 |
| D | 0 | 18 | 0 |
| Mode M0 | |||
|---|---|---|---|
| Quadrant | BADHDUFLAG | Total packets | Discarded packets |
| A | 0 | 13952 | 0 |
| B | 0 | 38284 | 0 |
| C | 0 | 16557 | 0 |
| D | 0 | 19246 | 0 |
| Quadrant | Total seconds | Saturated seconds | Saturation percentage |
|---|---|---|---|
| A | 6770 | 34 | 0.502216% |
| B | 6770 | 3320 | 49.039882% |
| C | 6770 | 298 | 4.401773% |
| D | 6770 | 345 | 5.096012% |
Noise dominated data is calculated using 1-second bins in cleaned event files. If a bin has >2000 counts, and if more than 50% of those come from <1% of pixels, then it is considered to be noise-dominated and hence unusable.
| Quadrant | # 1 sec bins | Bins with >0 counts | Bins with >2000 counts | High rate bins dominated by noise | Noise dominated (total time) | Noise dominated (detector-on time) | Marked lightcurve |
|---|---|---|---|---|---|---|---|
| A | 8530 | 6772 | 0 | 0 | 0.00% | 0.00% | 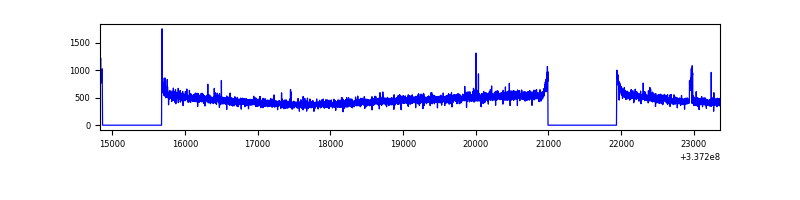 |
| B | 8530 | 6771 | 2915 | 2915 | 34.17% | 43.05% | 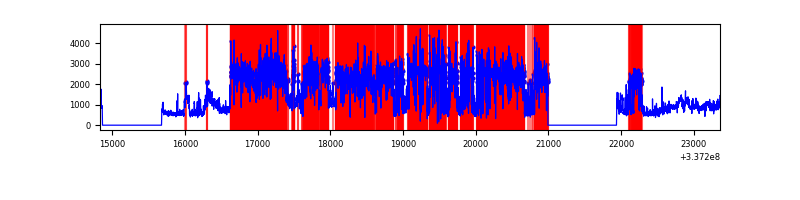 |
| C | 8530 | 6772 | 143 | 143 | 1.68% | 2.11% | 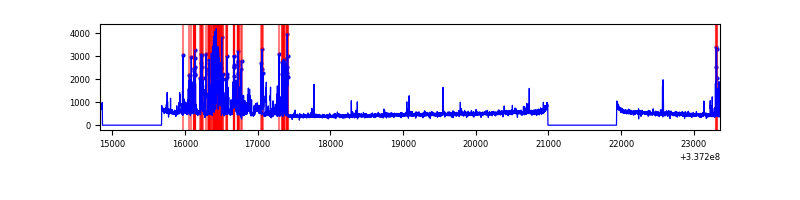 |
| D | 8530 | 6772 | 226 | 226 | 2.65% | 3.34% | 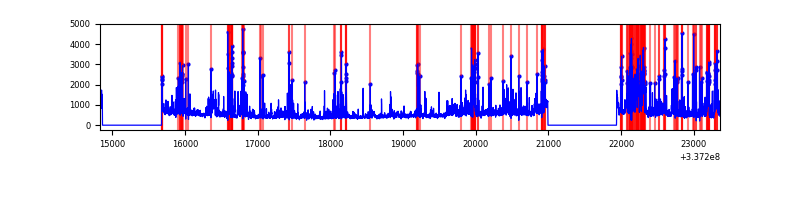 |
Top three noisy pixels from each quadrant. If the there are fewer than three noisy pixels in the level2.evt file, extra rows are filled as -1
| Pixel properties | Quadrant properties | ||||||
|---|---|---|---|---|---|---|---|
| Quadrant | DetID | PixID | Counts | Sigma | Mean | Median | Sigma |
| A | 11 | 29 | 19481 | 113.23 | 816 | 799 | 165.0 |
| A | 0 | 13 | 11388 | 64.18 | 816 | 799 | 165.0 |
| A | 13 | 254 | 11337 | 63.87 | 816 | 799 | 165.0 |
| B | 0 | 189 | 8833306 | 73566.01 | 627 | 611 | 120.1 |
| B | 10 | 246 | 33869 | 277.0 | 627 | 611 | 120.1 |
| B | 12 | 111 | 14572 | 116.28 | 627 | 611 | 120.1 |
| C | 2 | 16 | 851559 | 4646.58 | 777 | 782 | 183.1 |
| C | 14 | 238 | 123612 | 670.84 | 777 | 782 | 183.1 |
| C | 15 | 208 | 33243 | 177.29 | 777 | 782 | 183.1 |
| D | 1 | 52 | 930099 | 4576.89 | 773 | 754 | 203.1 |
| D | 7 | 80 | 804080 | 3956.26 | 773 | 754 | 203.1 |
| D | 2 | 250 | 147695 | 723.66 | 773 | 754 | 203.1 |
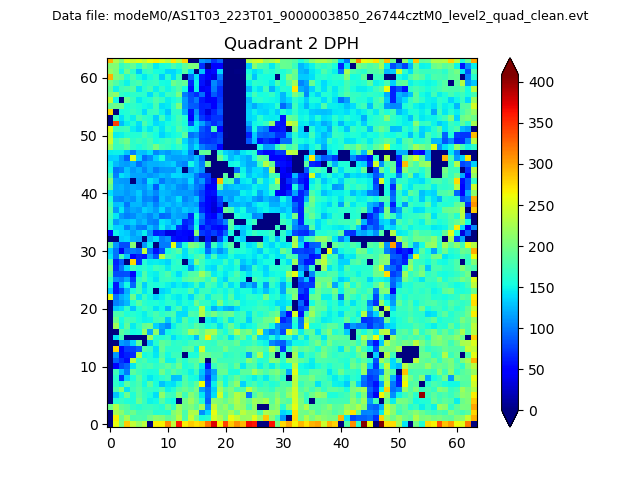
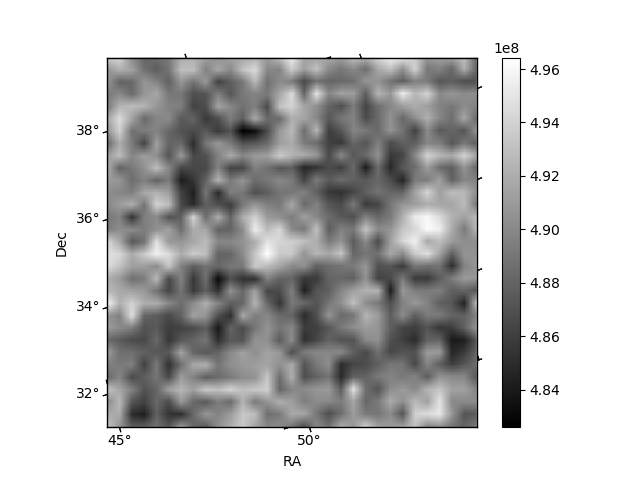
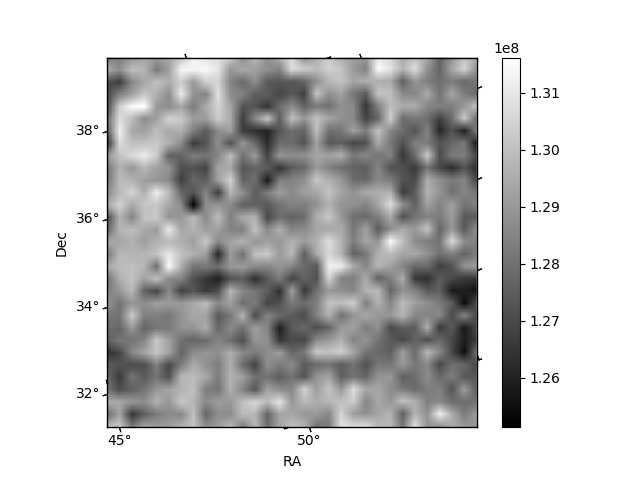
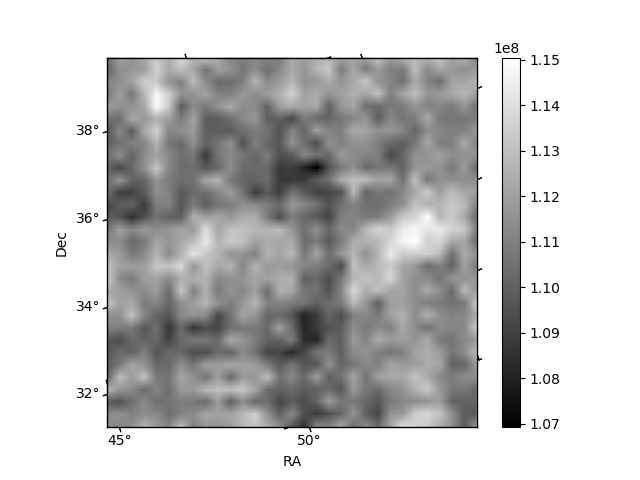
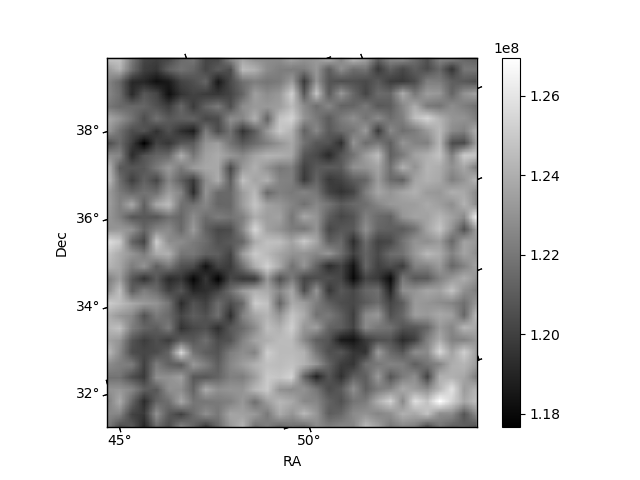
Histogram calculated using DETX and DETY for each event in the final _common_clean file
| Quadrant A | 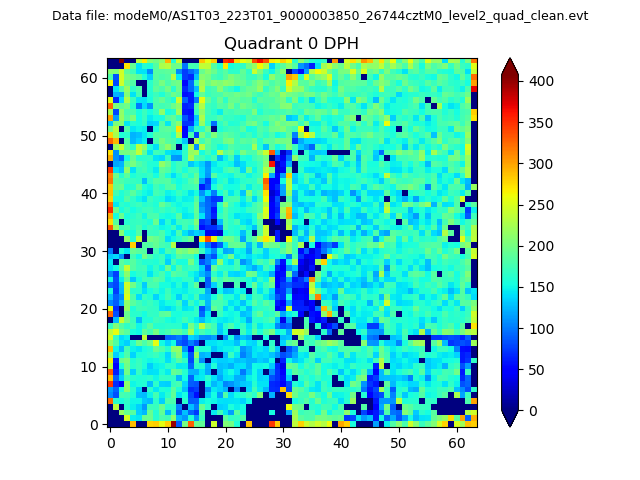 |
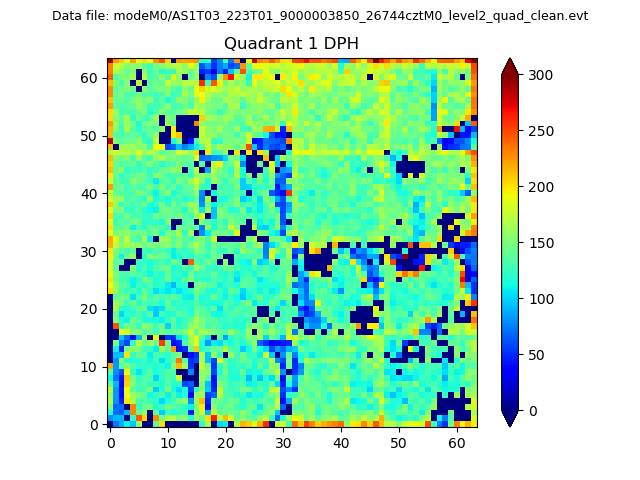 |
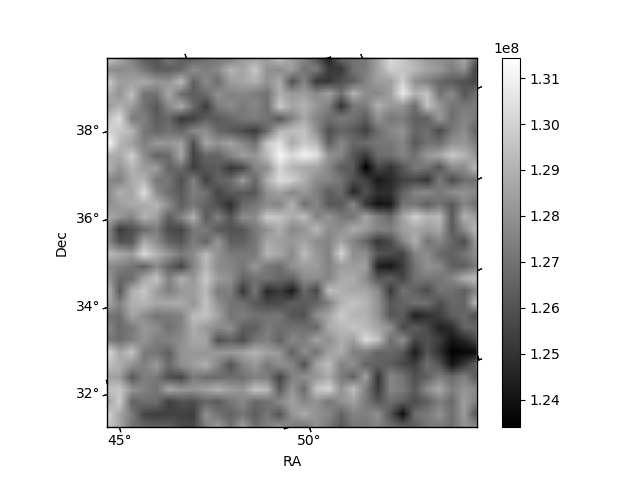
Quadrant B |
|---|---|---|---|
| Quadrant D | 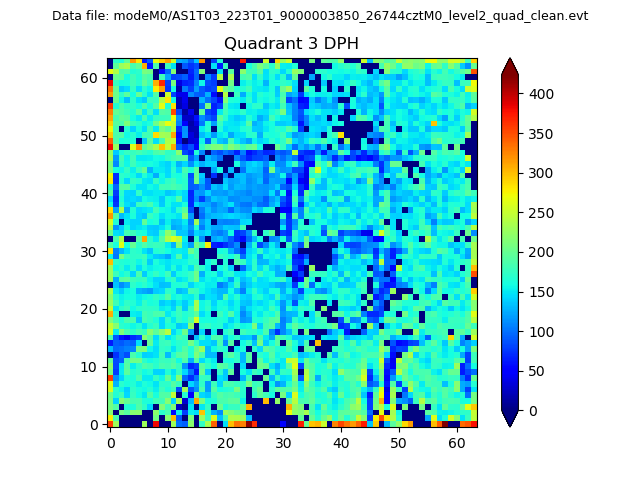 |
 |
Quadrant C |
| Plot type | Count rate plots | Images |
|---|---|---|
| Comparison with Poisson distribution Blue bars denote a histogram of data divided into 1 sec bins. Red curve is a Poisson curve with rate = median count rate of data. |
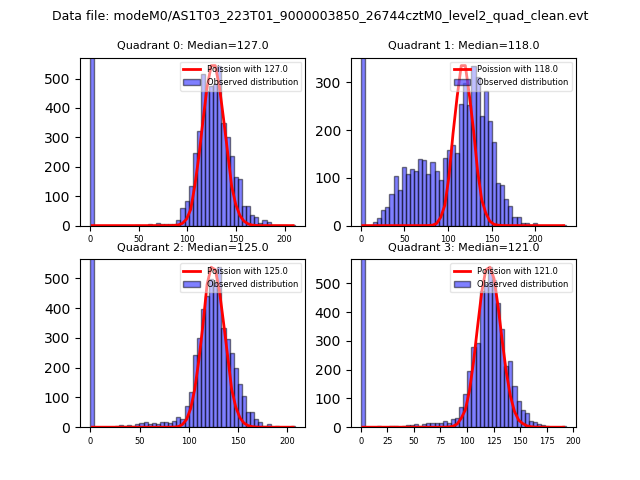 |
 |
| Quadrant-wise count rates Data is divided into 100 sec bins |
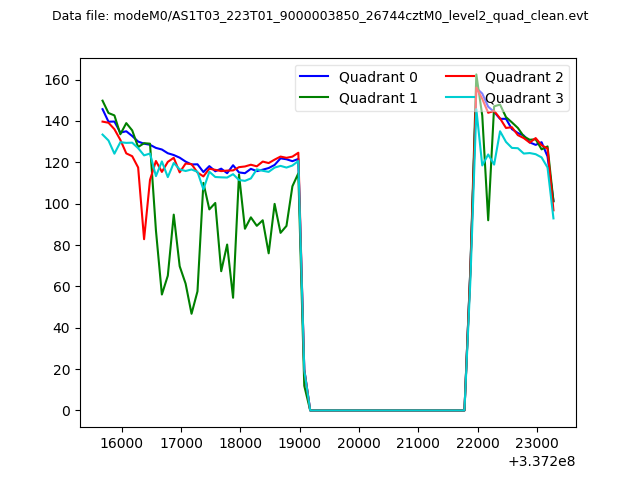 |
|
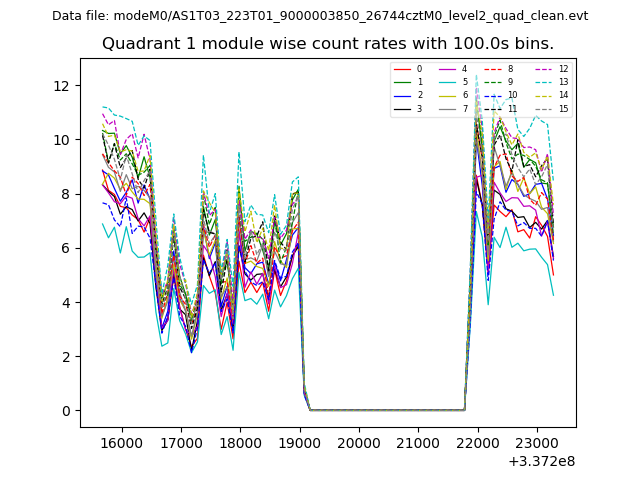
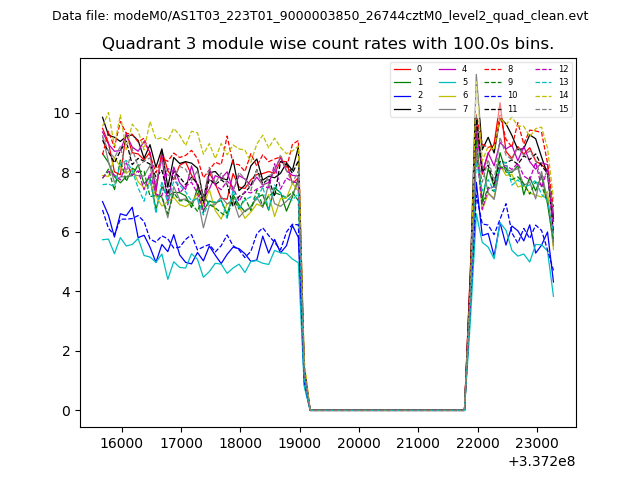
| Module-wise count rates for Quadrant A Data is divided into 100 sec bins |
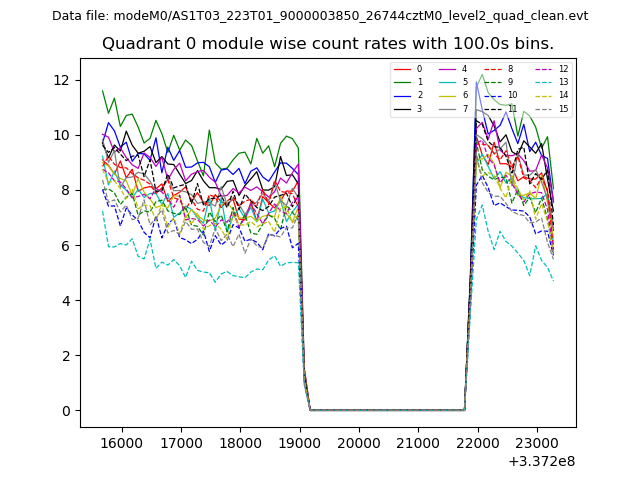 |
 |
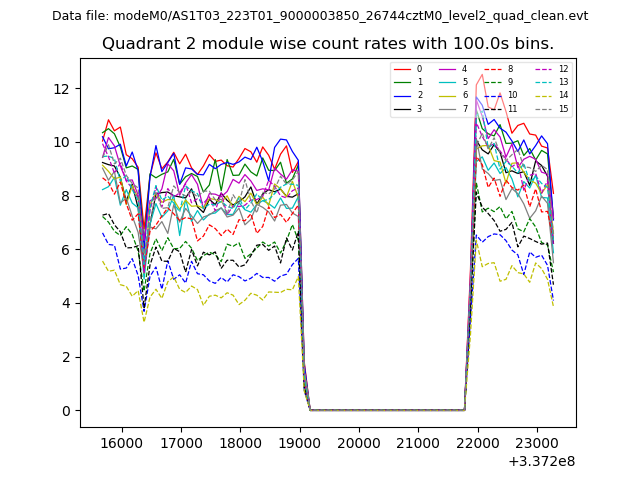
| Module-wise count rates for Quadrant B Data is divided into 100 sec bins |
 |
 |
| Module-wise count rates for Quadrant C Data is divided into 100 sec bins |
 |
 |
| Module-wise count rates for Quadrant D Data is divided into 100 sec bins |
 |
 |
| Parameter | Plot |
|---|---|
| CZT HV Monitor | 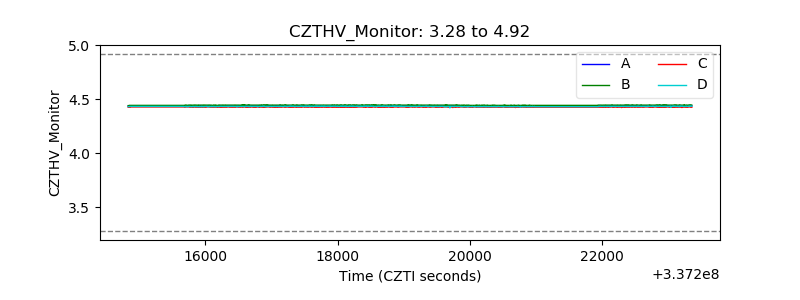 |
| D_VDD | 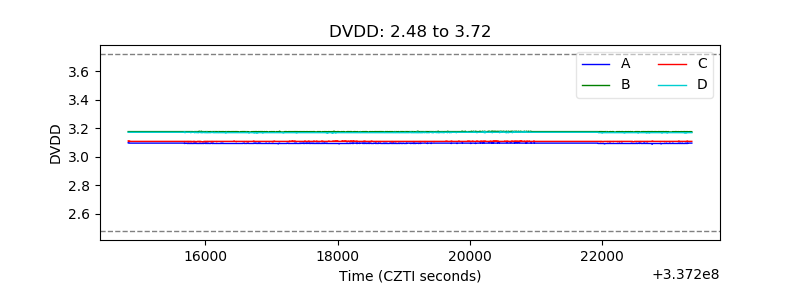 |
| Temperature 1 | 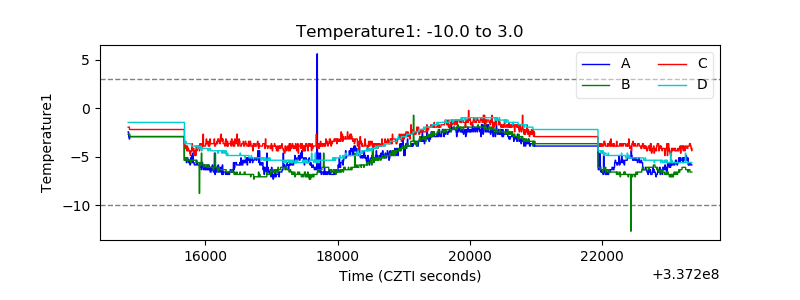 |
| Veto HV Monitor | 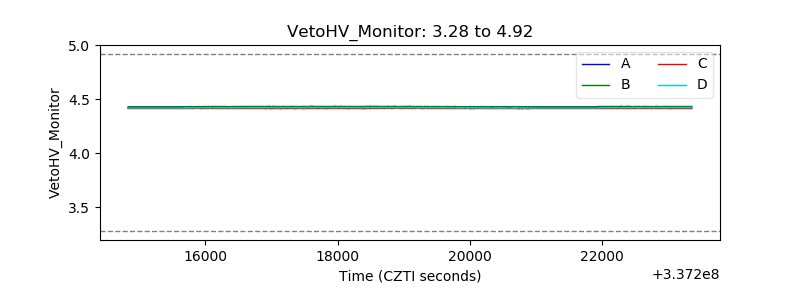 |
| Veto LLD |  |
| Alpha Counter |  |
| _CPM_Rate | 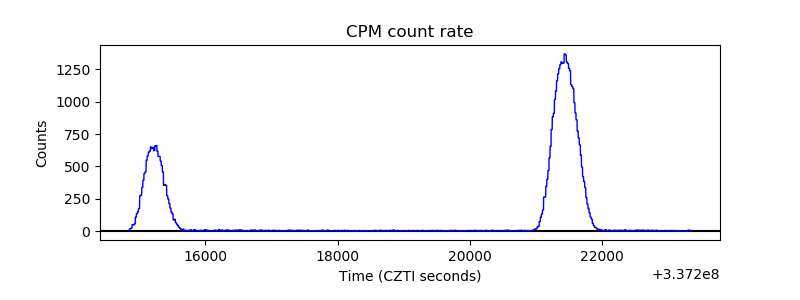 |
| CZT Counter | 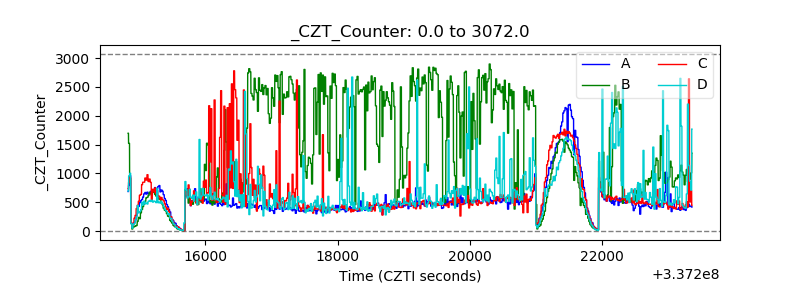 |
| +2.5 Volts monitor |  |
| +5 Volts monitor |  |
| _ROLL_ROT | 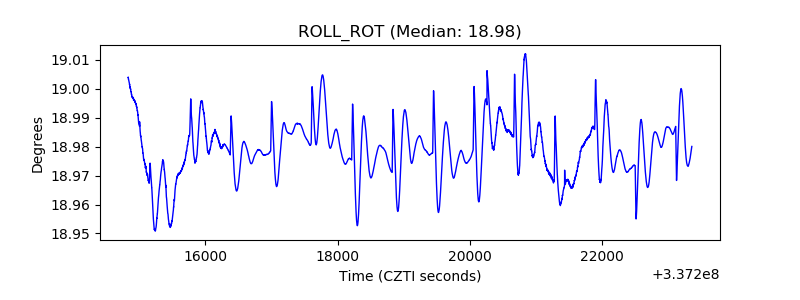 |
| _Roll_DEC | 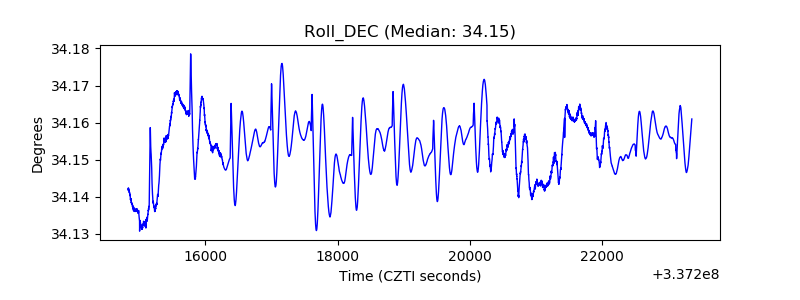 |
| _Roll_RA | 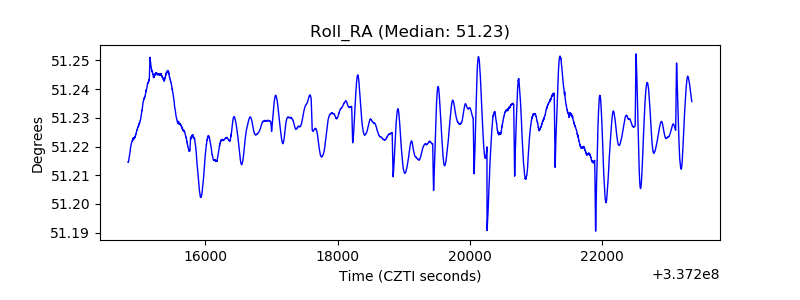 |
| Veto Counter | 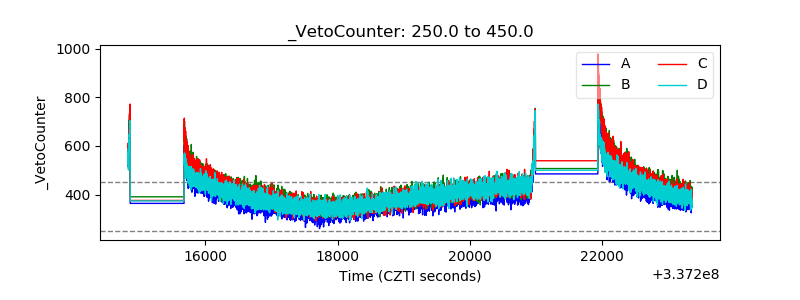 |