| Param | Original file | Final file |
|---|---|---|
| Filename | modeM0/AS1T03_223T01_9000003850_26745cztM0_level2.evt | modeM0/AS1T03_223T01_9000003850_26745cztM0_level2_quad_clean.evt |
| Size (bytes) | 781,738,560 | 92,344,320 |
| Size | 745.5 MB | 88.1 MB |
| Events in quadrant A | 3,320,061 | 622,304 |
| Events in quadrant B | 8,379,097 | 599,624 |
| Events in quadrant C | 3,326,653 | 615,816 |
| Events in quadrant D | 8,200,042 | 493,864 |
| Mode M9 | |||
|---|---|---|---|
| Quadrant | BADHDUFLAG | Total packets | Discarded packets |
| A | 0 | 12 | 0 |
| B | 0 | 13 | 0 |
| C | 0 | 13 | 1 |
| D | 0 | 13 | 1 |
| Mode M0 | |||
|---|---|---|---|
| Quadrant | BADHDUFLAG | Total packets | Discarded packets |
| A | 0 | 14313 | 0 |
| B | 0 | 29510 | 0 |
| C | 0 | 14136 | 0 |
| D | 0 | 28947 | 0 |
| Quadrant | Total seconds | Saturated seconds | Saturation percentage |
|---|---|---|---|
| A | 6662 | 25 | 0.375263% |
| B | 6642 | 1520 | 22.884673% |
| C | 6659 | 85 | 1.276468% |
| D | 6655 | 1443 | 21.682945% |
Noise dominated data is calculated using 1-second bins in cleaned event files. If a bin has >2000 counts, and if more than 50% of those come from <1% of pixels, then it is considered to be noise-dominated and hence unusable.
| Quadrant | # 1 sec bins | Bins with >0 counts | Bins with >2000 counts | High rate bins dominated by noise | Noise dominated (total time) | Noise dominated (detector-on time) | Marked lightcurve |
|---|---|---|---|---|---|---|---|
| A | 7775 | 6676 | 2 | 2 | 0.03% | 0.03% | 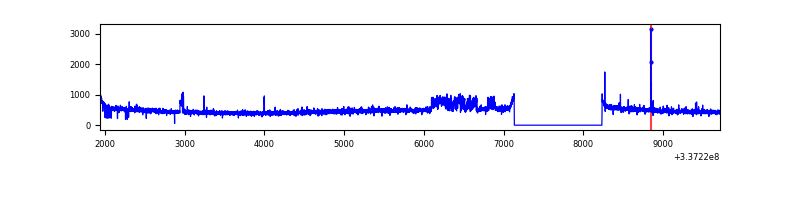 |
| B | 7775 | 6675 | 933 | 933 | 12.00% | 13.98% | 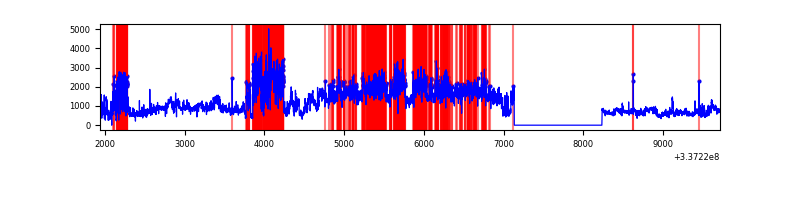 |
| C | 7775 | 6675 | 8 | 8 | 0.10% | 0.12% | 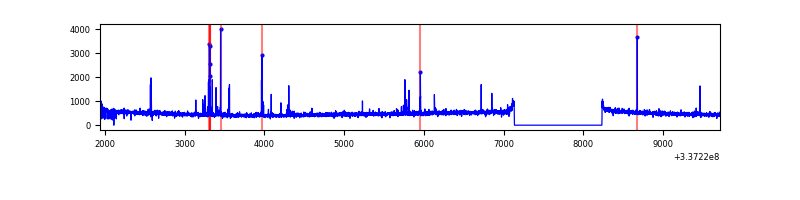 |
| D | 7774 | 6672 | 1248 | 1248 | 16.05% | 18.71% | 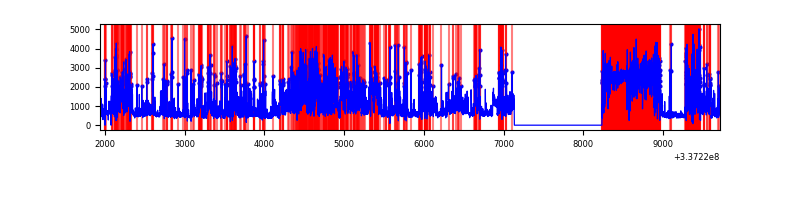 |
Top three noisy pixels from each quadrant. If the there are fewer than three noisy pixels in the level2.evt file, extra rows are filled as -1
| Pixel properties | Quadrant properties | ||||||
|---|---|---|---|---|---|---|---|
| Quadrant | DetID | PixID | Counts | Sigma | Mean | Median | Sigma |
| A | 11 | 29 | 163967 | 1004.26 | 813 | 799 | 162.5 |
| A | 13 | 254 | 11275 | 64.48 | 813 | 799 | 162.5 |
| A | 4 | 2 | 10670 | 60.75 | 813 | 799 | 162.5 |
| B | 0 | 189 | 5335283 | 36665.75 | 764 | 746 | 145.5 |
| B | 10 | 246 | 19405 | 128.25 | 764 | 746 | 145.5 |
| B | 12 | 111 | 17486 | 115.06 | 764 | 746 | 145.5 |
| C | 14 | 238 | 126551 | 684.98 | 782 | 788 | 183.6 |
| C | 2 | 16 | 109577 | 592.53 | 782 | 788 | 183.6 |
| C | 15 | 208 | 33240 | 176.75 | 782 | 788 | 183.6 |
| D | 7 | 80 | 4391699 | 25557.72 | 696 | 676 | 171.8 |
| D | 1 | 52 | 1035322 | 6022.1 | 696 | 676 | 171.8 |
| D | 2 | 250 | 77288 | 445.91 | 696 | 676 | 171.8 |
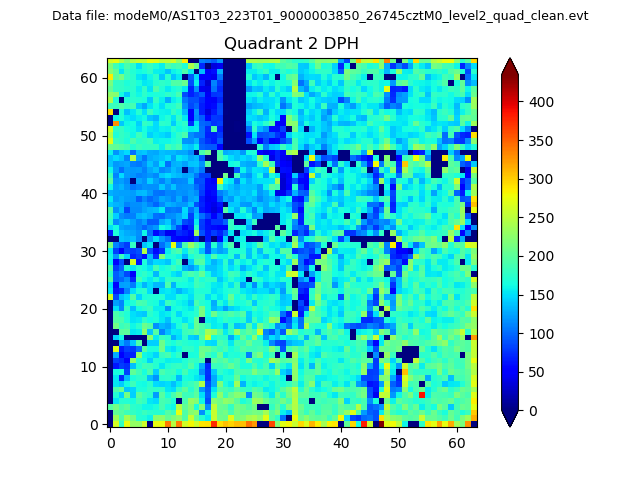
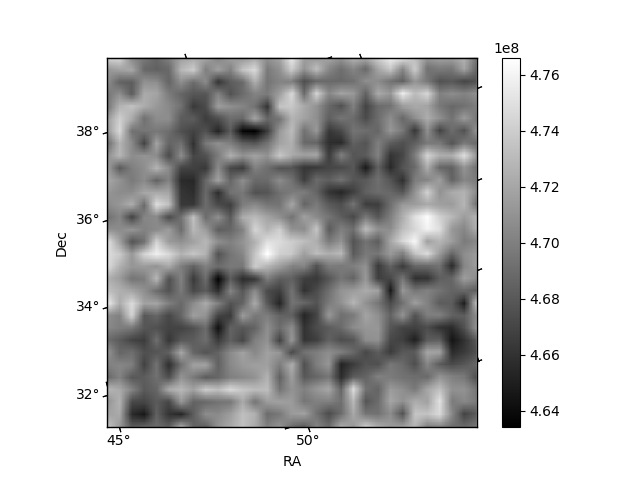
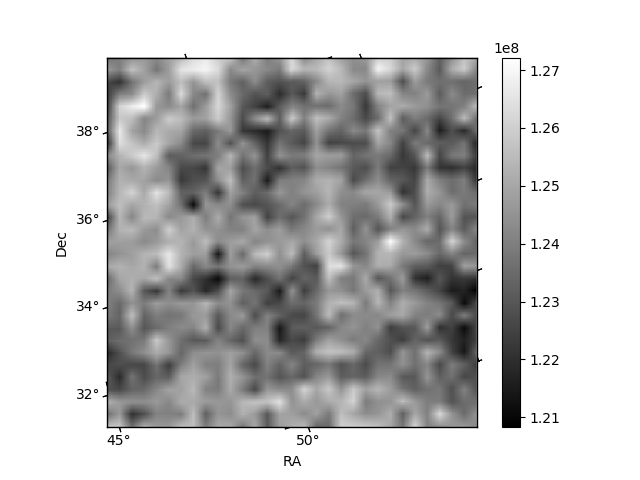
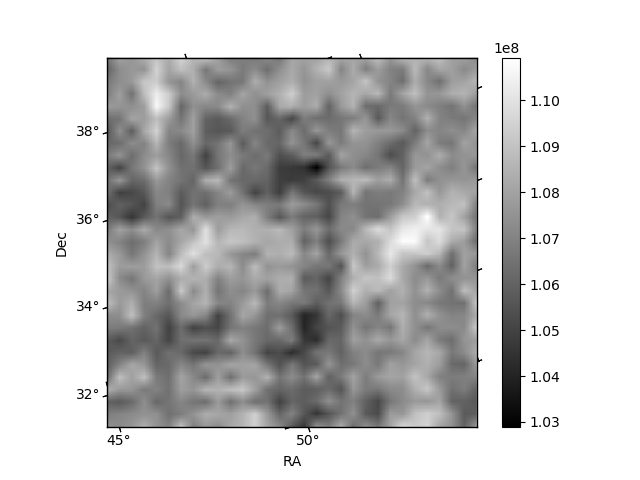
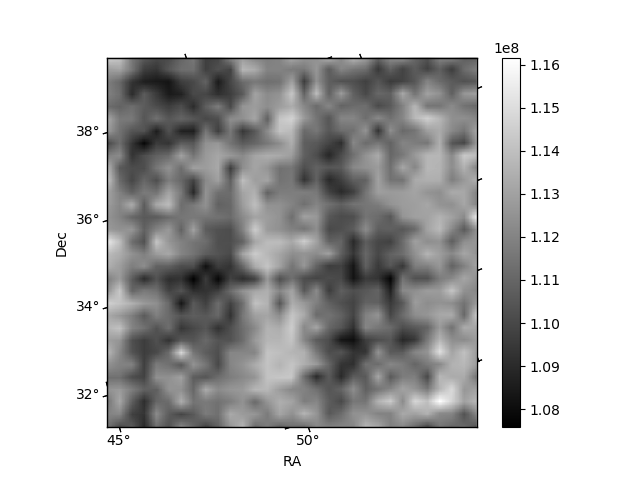
Histogram calculated using DETX and DETY for each event in the final _common_clean file
| Quadrant A | 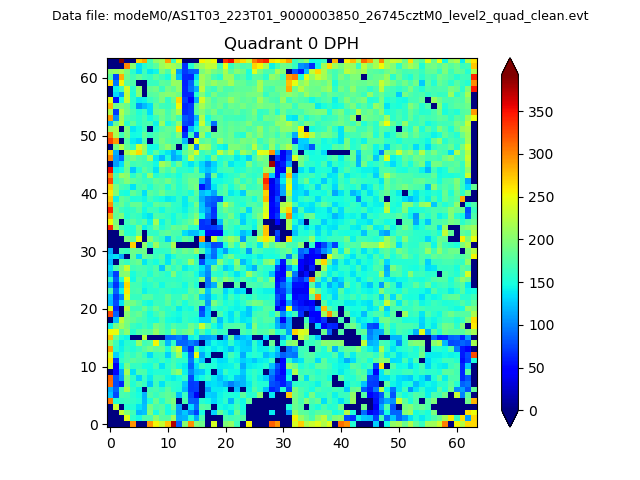 |
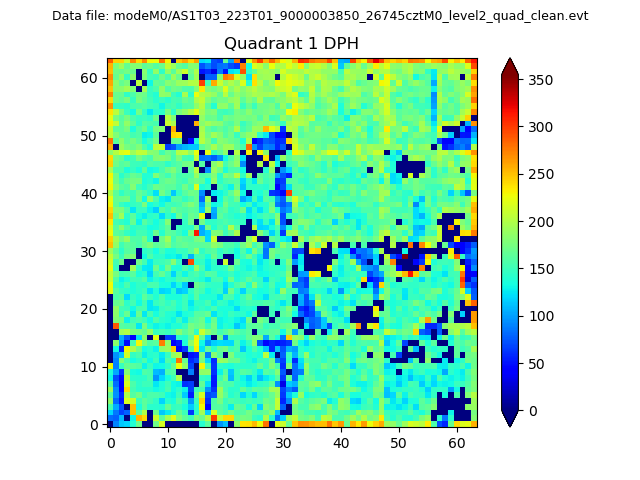 |
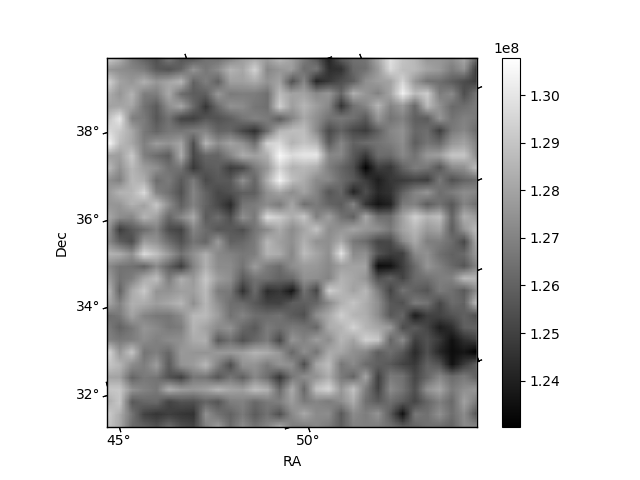
Quadrant B |
|---|---|---|---|
| Quadrant D | 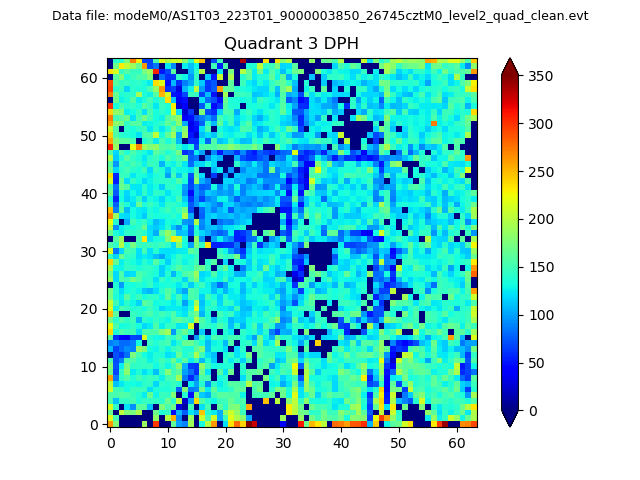 |
 |
Quadrant C |
| Plot type | Count rate plots | Images |
|---|---|---|
| Comparison with Poisson distribution Blue bars denote a histogram of data divided into 1 sec bins. Red curve is a Poisson curve with rate = median count rate of data. |
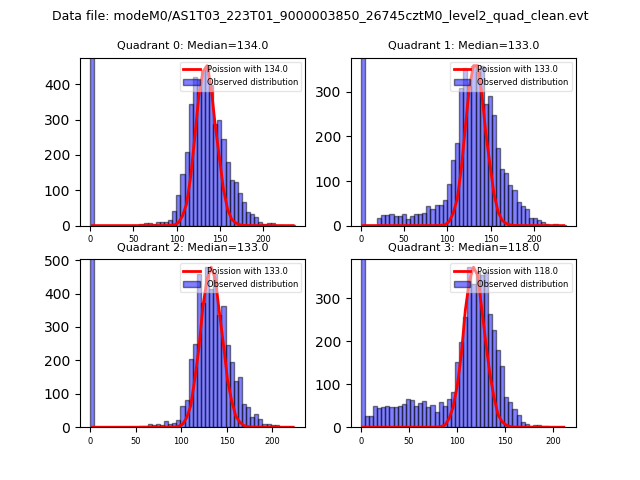 |
 |
| Quadrant-wise count rates Data is divided into 100 sec bins |
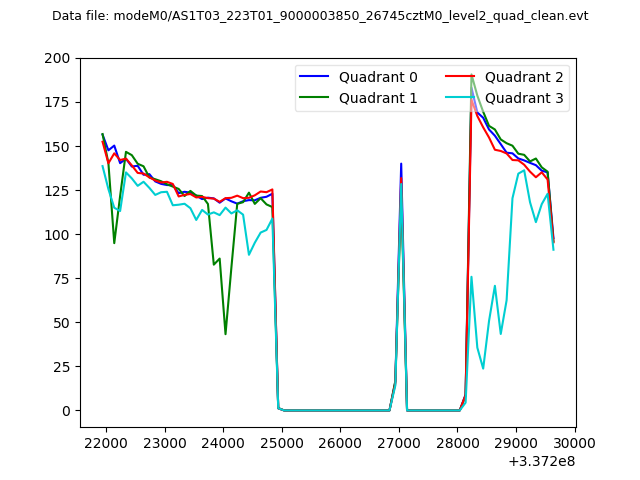 |
|
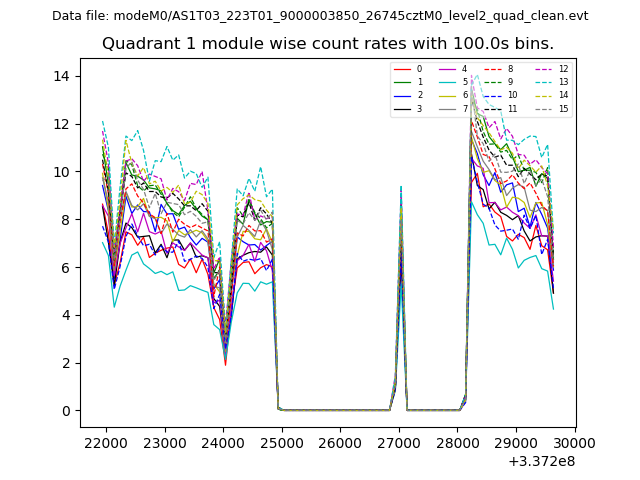
| Module-wise count rates for Quadrant A Data is divided into 100 sec bins |
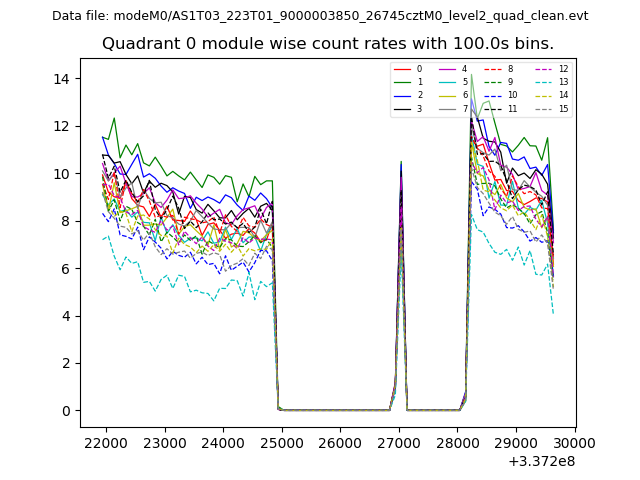 |
 |
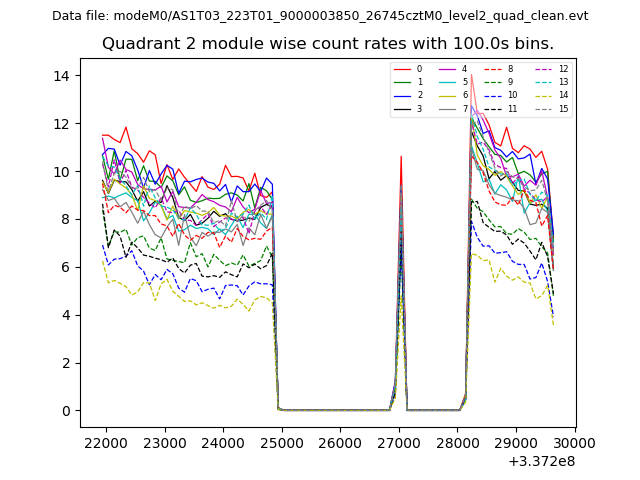
| Module-wise count rates for Quadrant B Data is divided into 100 sec bins |
 |
 |
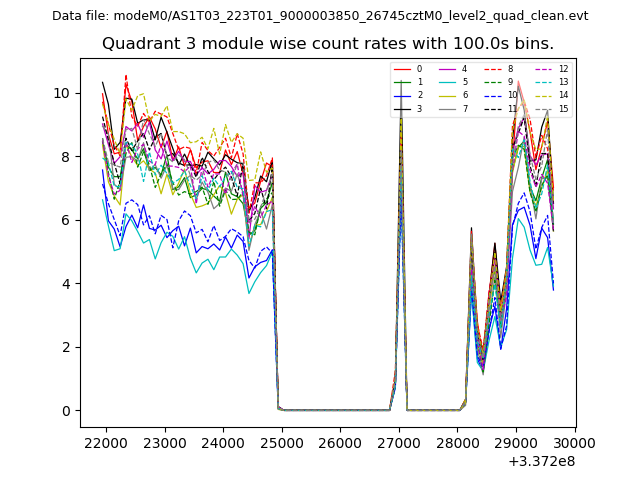
| Module-wise count rates for Quadrant C Data is divided into 100 sec bins |
 |
 |
| Module-wise count rates for Quadrant D Data is divided into 100 sec bins |
 |
 |
| Parameter | Plot |
|---|---|
| CZT HV Monitor | 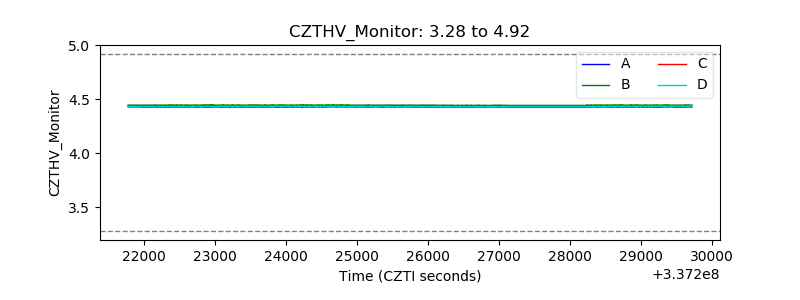 |
| D_VDD | 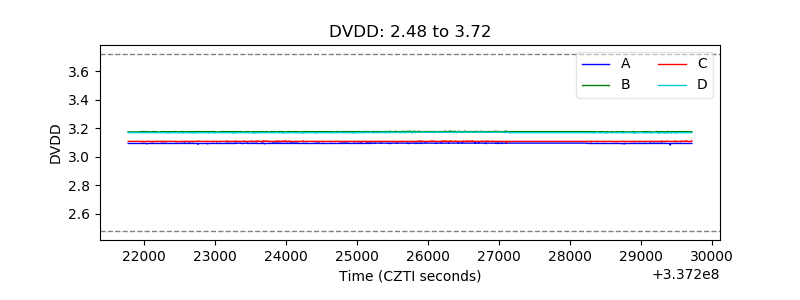 |
| Temperature 1 | 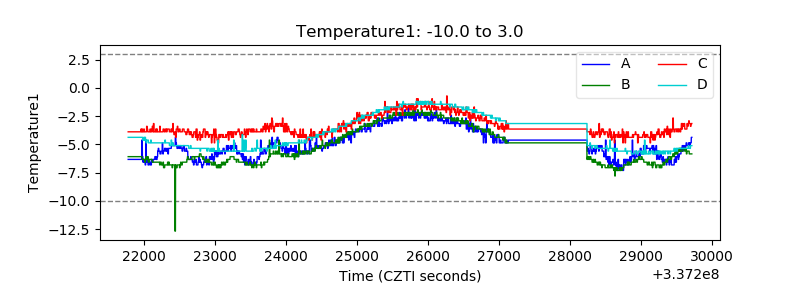 |
| Veto HV Monitor | 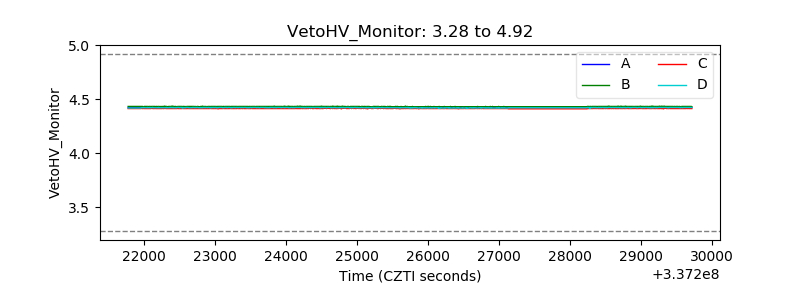 |
| Veto LLD | 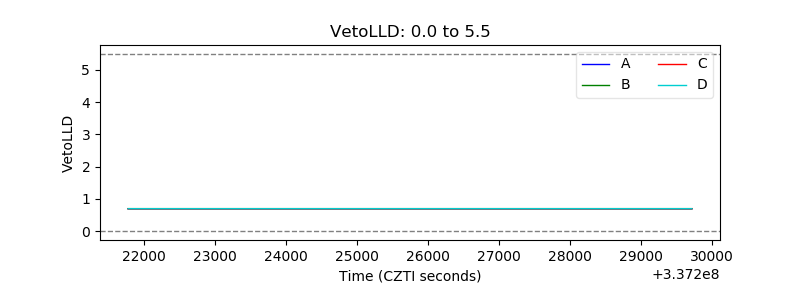 |
| Alpha Counter | 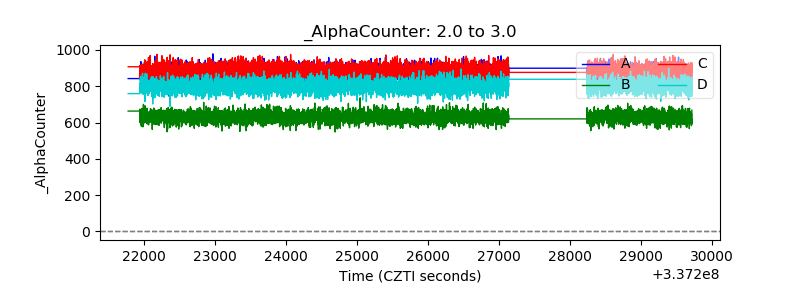 |
| _CPM_Rate | 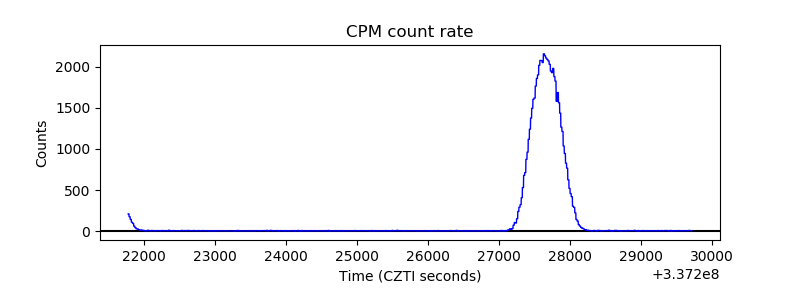 |
| CZT Counter | 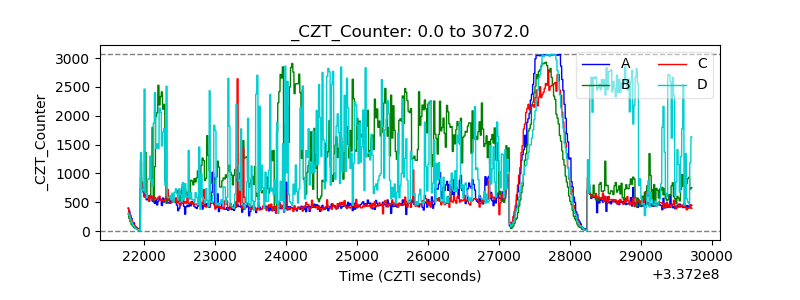 |
| +2.5 Volts monitor | 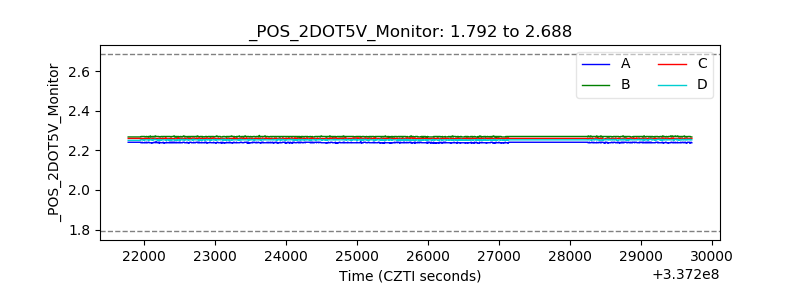 |
| +5 Volts monitor |  |
| _ROLL_ROT | 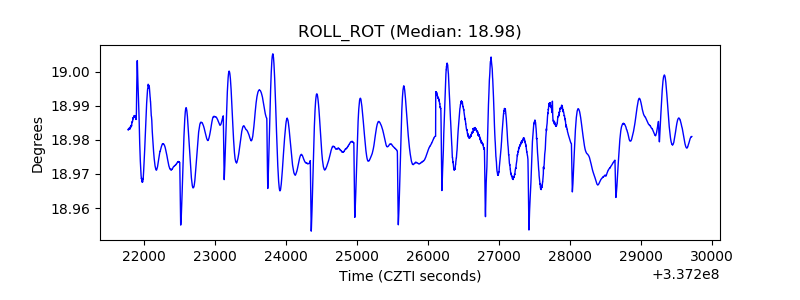 |
| _Roll_DEC | 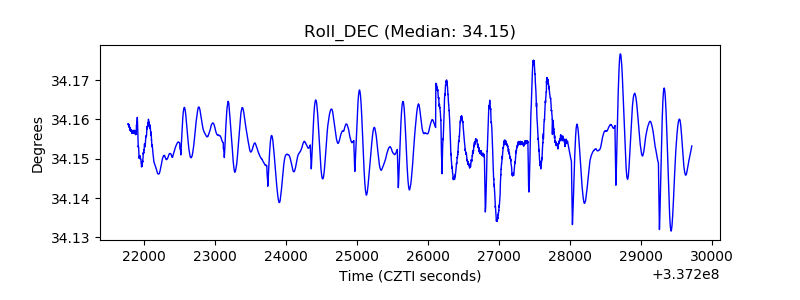 |
| _Roll_RA | 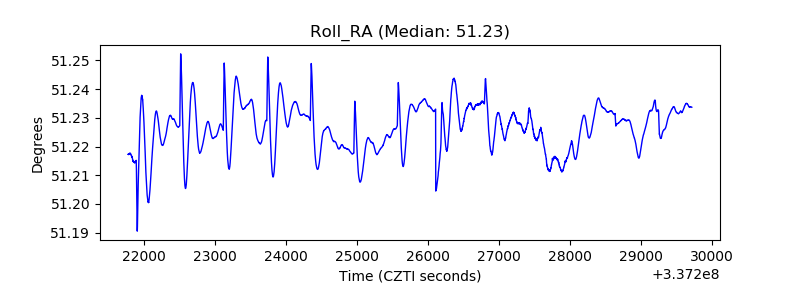 |
| Veto Counter | 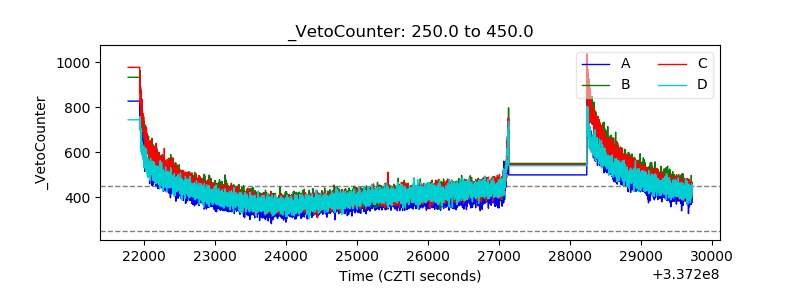 |