| Param | Original file | Final file |
|---|---|---|
| Filename | modeM0/AS1T03_223T01_9000003850_26748cztM0_level2.evt | modeM0/AS1T03_223T01_9000003850_26748cztM0_level2_quad_clean.evt |
| Size (bytes) | 1,907,418,240 | 199,687,680 |
| Size | 1.8 GB | 190.4 MB |
| Events in quadrant A | 8,062,869 | 1,363,206 |
| Events in quadrant B | 25,972,779 | 1,091,170 |
| Events in quadrant C | 7,812,534 | 1,327,577 |
| Events in quadrant D | 14,873,041 | 1,190,799 |
| Mode M9 | |||
|---|---|---|---|
| Quadrant | BADHDUFLAG | Total packets | Discarded packets |
| A | 0 | 36 | 0 |
| B | 0 | 36 | 0 |
| C | 0 | 36 | 0 |
| D | 0 | 36 | 0 |
| Mode M0 | |||
|---|---|---|---|
| Quadrant | BADHDUFLAG | Total packets | Discarded packets |
| A | 0 | 33713 | 0 |
| B | 0 | 87890 | 0 |
| C | 0 | 32805 | 0 |
| D | 0 | 54788 | 0 |
| Quadrant | Total seconds | Saturated seconds | Saturation percentage |
|---|---|---|---|
| A | 15549 | 85 | 0.546659% |
| B | 15549 | 7636 | 49.109267% |
| C | 15549 | 181 | 1.164062% |
| D | 15550 | 1860 | 11.961415% |
Noise dominated data is calculated using 1-second bins in cleaned event files. If a bin has >2000 counts, and if more than 50% of those come from <1% of pixels, then it is considered to be noise-dominated and hence unusable.
| Quadrant | # 1 sec bins | Bins with >0 counts | Bins with >2000 counts | High rate bins dominated by noise | Noise dominated (total time) | Noise dominated (detector-on time) | Marked lightcurve |
|---|---|---|---|---|---|---|---|
| A | 19124 | 15552 | 5 | 5 | 0.03% | 0.03% | 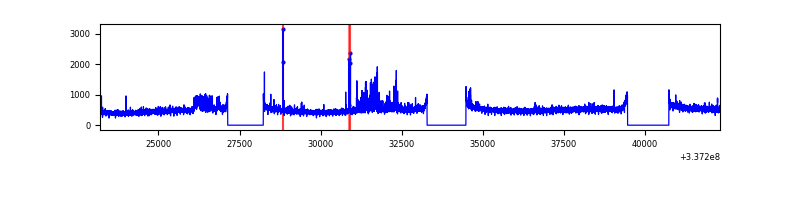 |
| B | 19124 | 15552 | 5915 | 5915 | 30.93% | 38.03% | 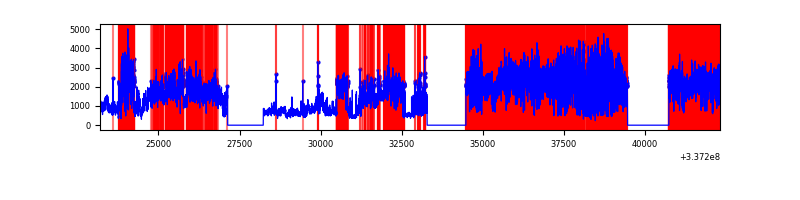 |
| C | 19124 | 15552 | 9 | 9 | 0.05% | 0.06% | 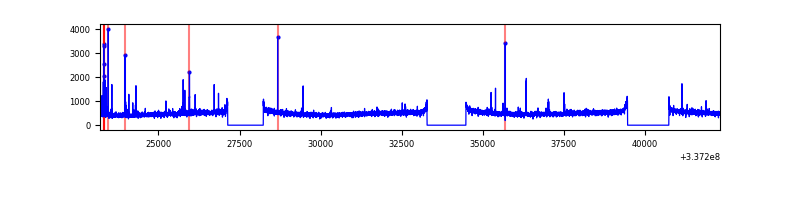 |
| D | 19125 | 15553 | 1468 | 1468 | 7.68% | 9.44% | 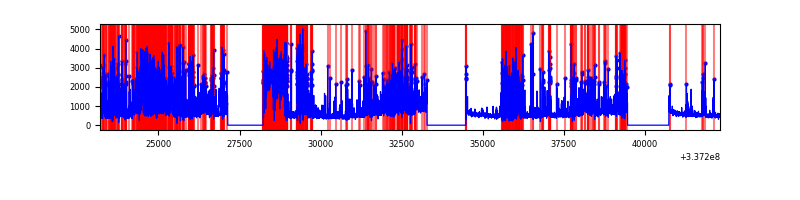 |
Top three noisy pixels from each quadrant. If the there are fewer than three noisy pixels in the level2.evt file, extra rows are filled as -1
| Pixel properties | Quadrant properties | ||||||
|---|---|---|---|---|---|---|---|
| Quadrant | DetID | PixID | Counts | Sigma | Mean | Median | Sigma |
| A | 0 | 13 | 242215 | 613.87 | 1978 | 1942 | 391.4 |
| A | 11 | 29 | 167405 | 422.74 | 1978 | 1942 | 391.4 |
| A | 13 | 254 | 25177 | 59.36 | 1978 | 1942 | 391.4 |
| B | 0 | 189 | 19455300 | 63705.68 | 1636 | 1597 | 305.4 |
| B | 10 | 246 | 54794 | 174.21 | 1636 | 1597 | 305.4 |
| B | 12 | 111 | 36283 | 113.59 | 1636 | 1597 | 305.4 |
| C | 14 | 238 | 305561 | 699.93 | 1877 | 1890 | 433.9 |
| C | 2 | 16 | 115098 | 260.93 | 1877 | 1890 | 433.9 |
| C | 15 | 208 | 66857 | 149.74 | 1877 | 1890 | 433.9 |
| D | 7 | 80 | 5750902 | 13005.76 | 1795 | 1748 | 442.0 |
| D | 1 | 52 | 1655079 | 3740.17 | 1795 | 1748 | 442.0 |
| D | 2 | 250 | 224300 | 503.46 | 1795 | 1748 | 442.0 |
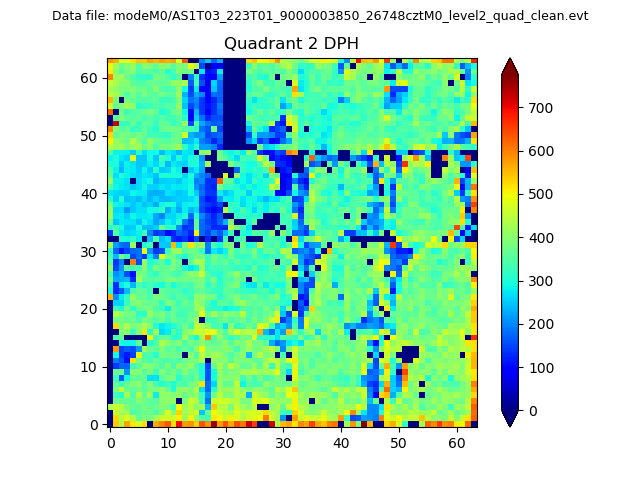
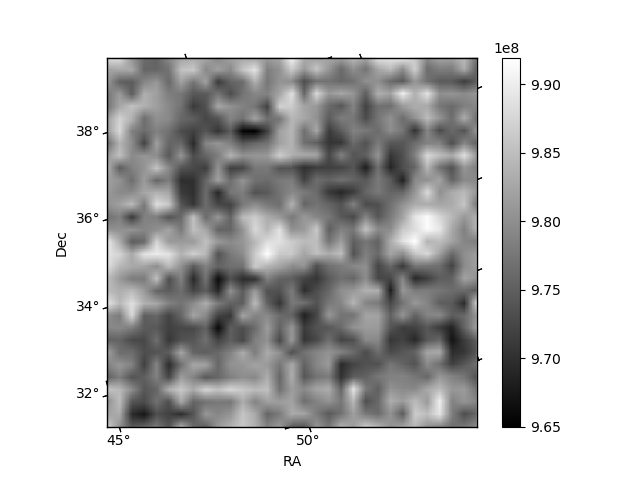
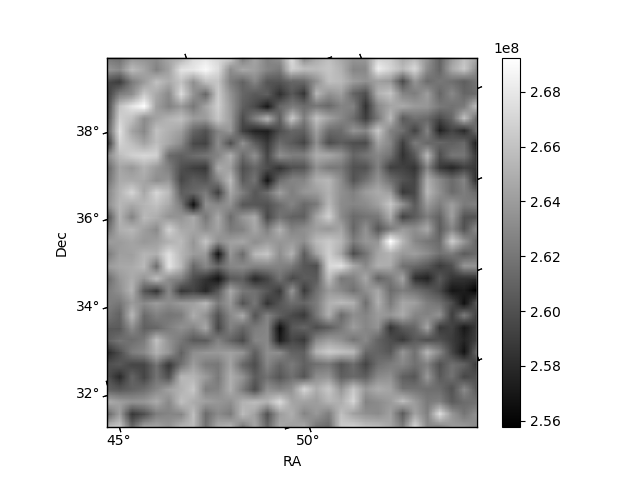
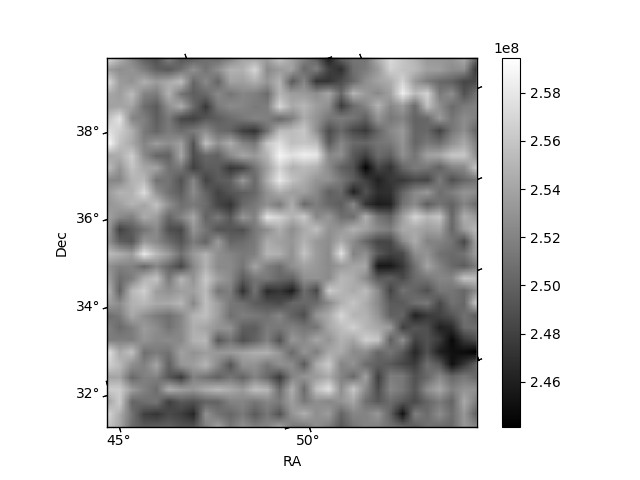
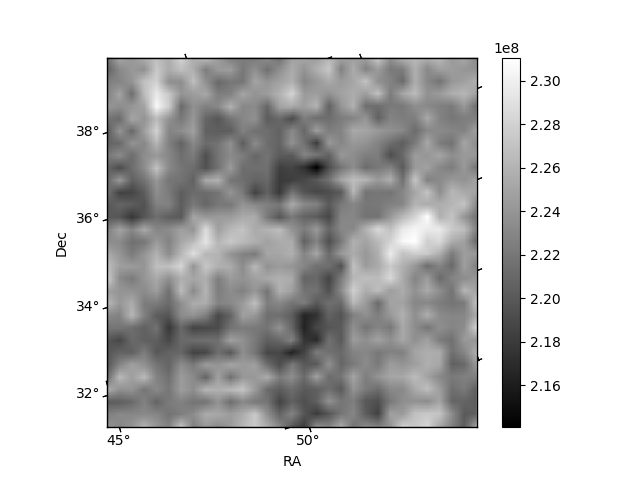
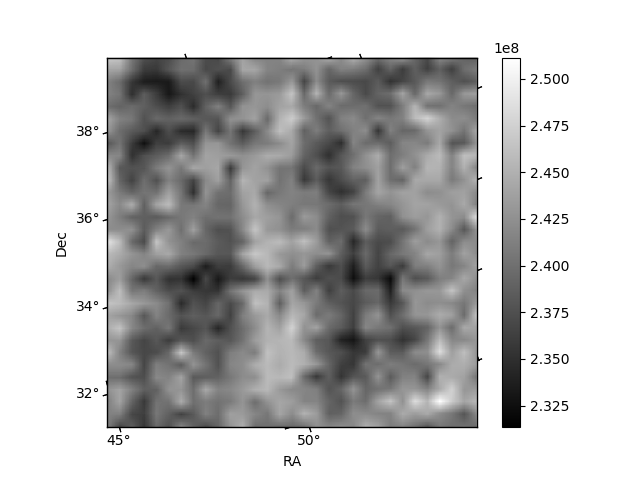
Histogram calculated using DETX and DETY for each event in the final _common_clean file
| Quadrant A | 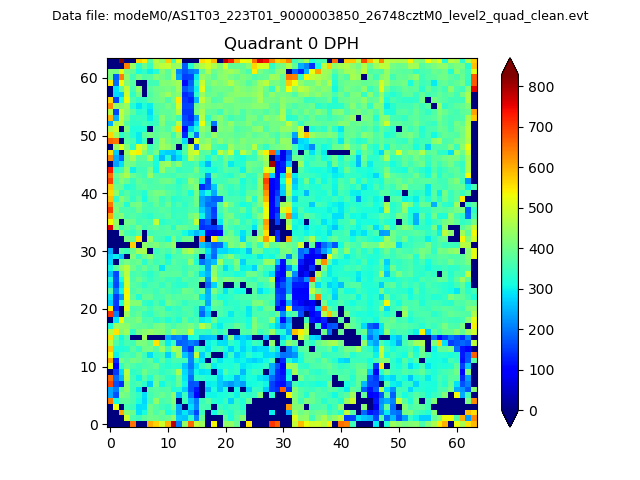 |
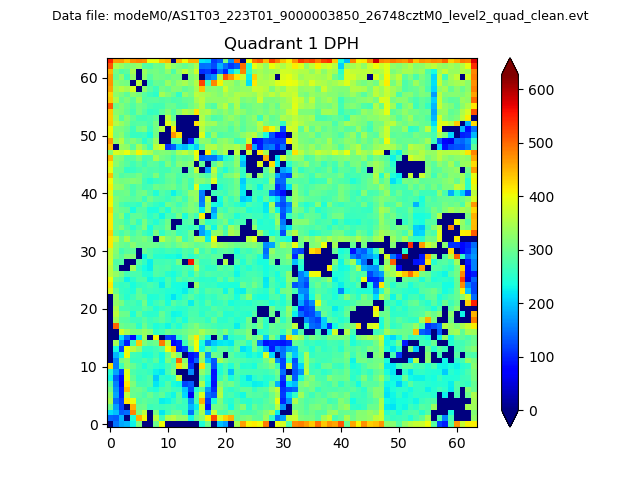 |
Quadrant B |
|---|---|---|---|
| Quadrant D | 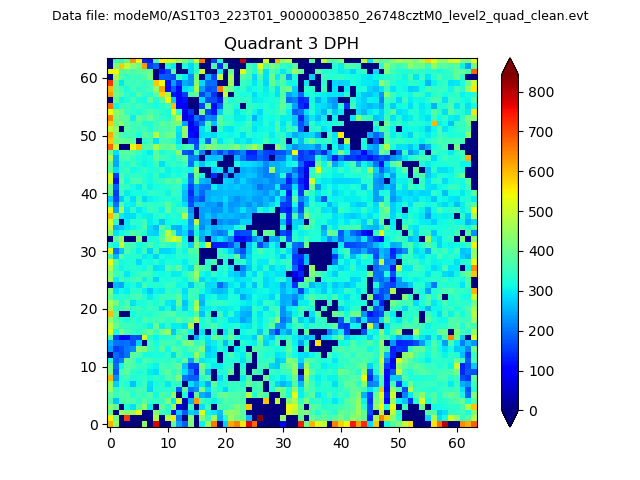 |
 |
Quadrant C |
| Plot type | Count rate plots | Images |
|---|---|---|
| Comparison with Poisson distribution Blue bars denote a histogram of data divided into 1 sec bins. Red curve is a Poisson curve with rate = median count rate of data. |
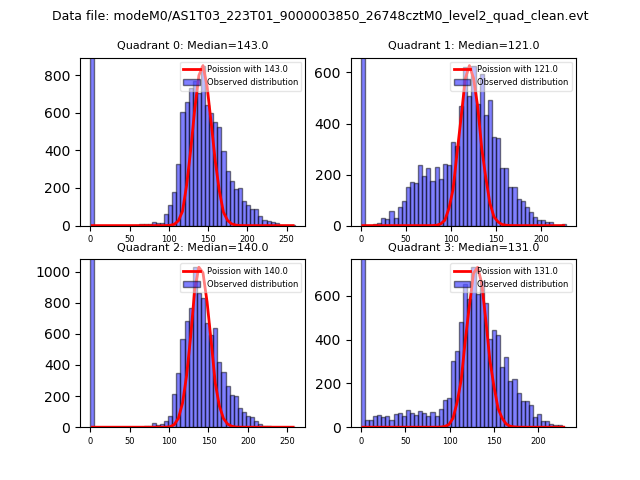 |
 |
| Quadrant-wise count rates Data is divided into 100 sec bins |
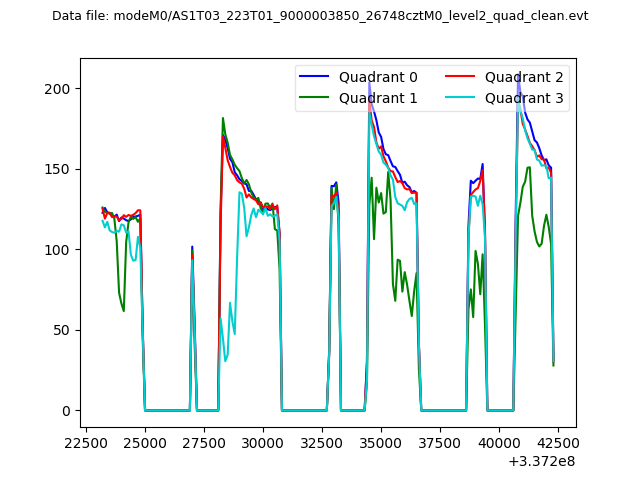 |
|
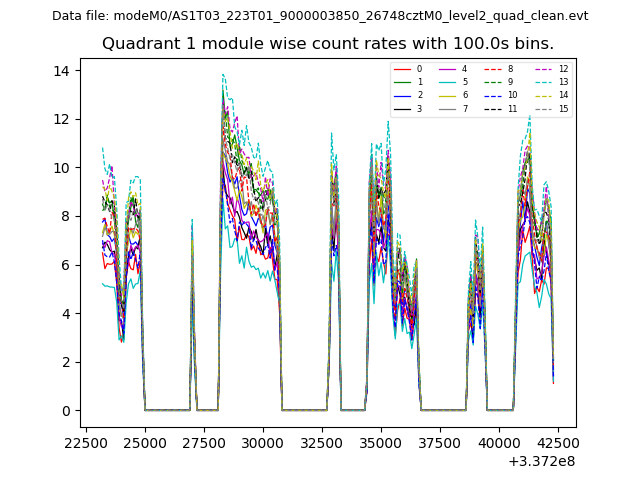
| Module-wise count rates for Quadrant A Data is divided into 100 sec bins |
 |
 |
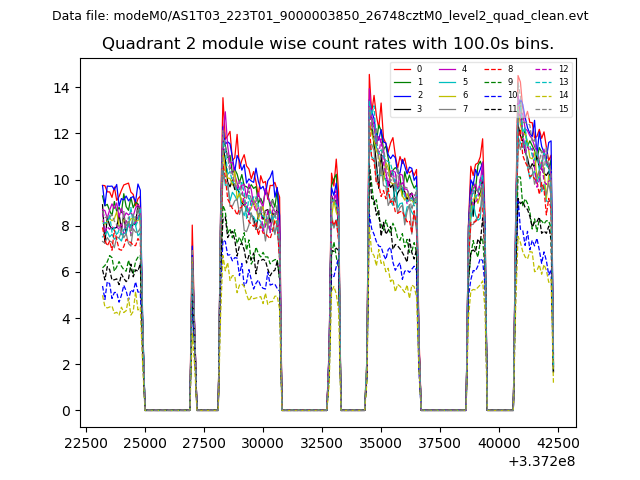
| Module-wise count rates for Quadrant B Data is divided into 100 sec bins |
 |
 |
| Module-wise count rates for Quadrant C Data is divided into 100 sec bins |
 |
 |
| Module-wise count rates for Quadrant D Data is divided into 100 sec bins |
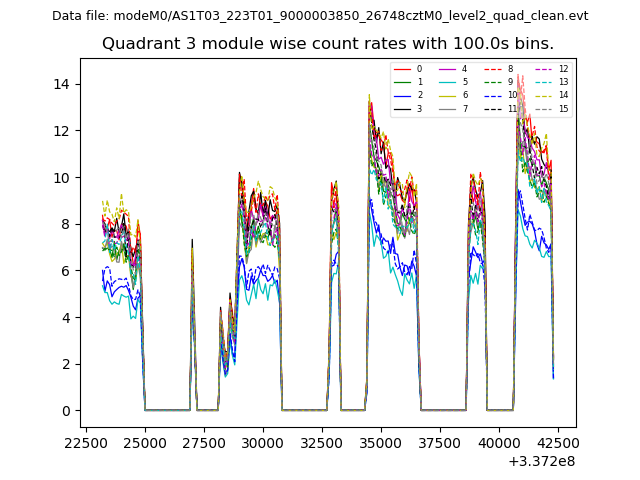 |
 |
| Parameter | Plot |
|---|---|
| CZT HV Monitor | 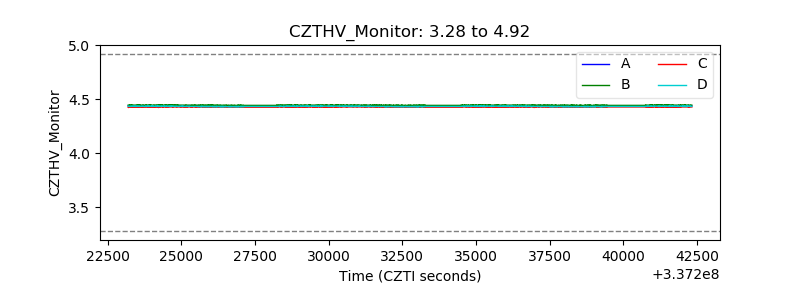 |
| D_VDD | 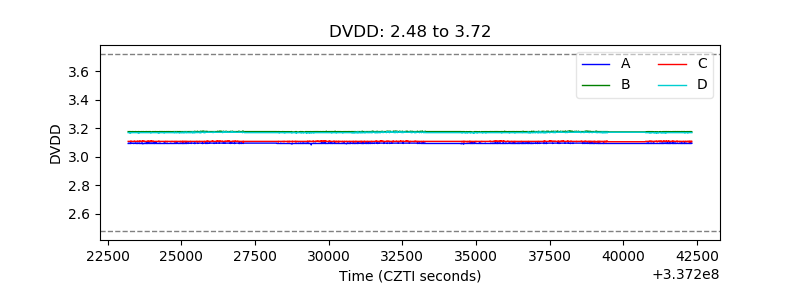 |
| Temperature 1 | 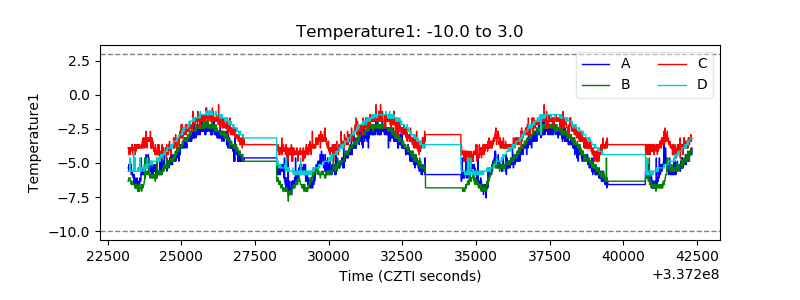 |
| Veto HV Monitor | 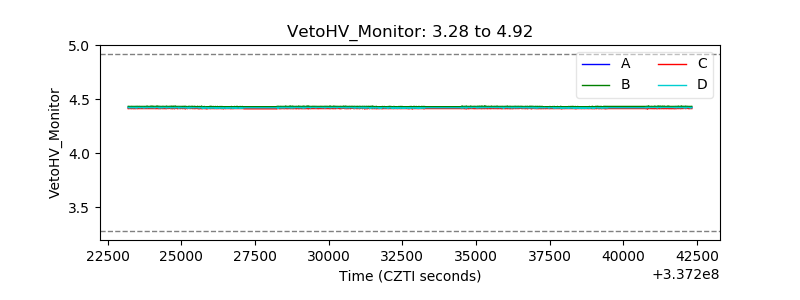 |
| Veto LLD | 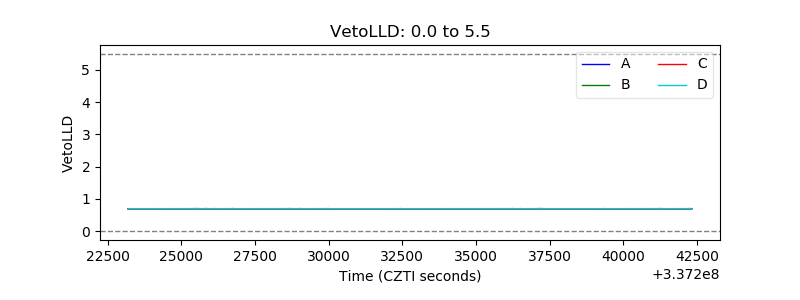 |
| Alpha Counter | 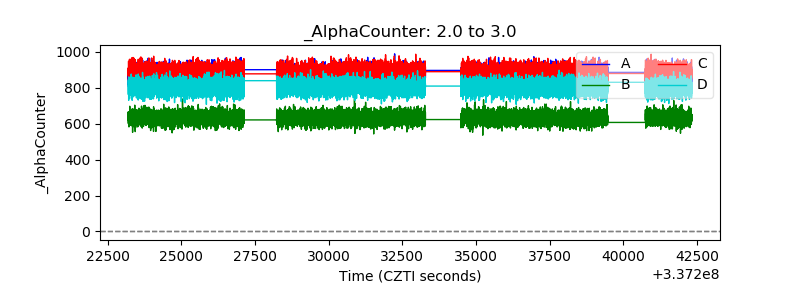 |
| _CPM_Rate | 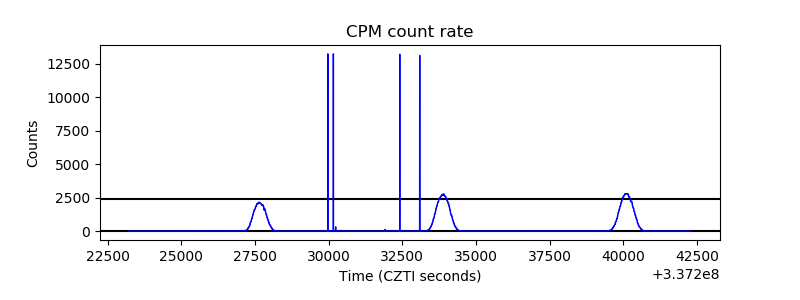 |
| CZT Counter | 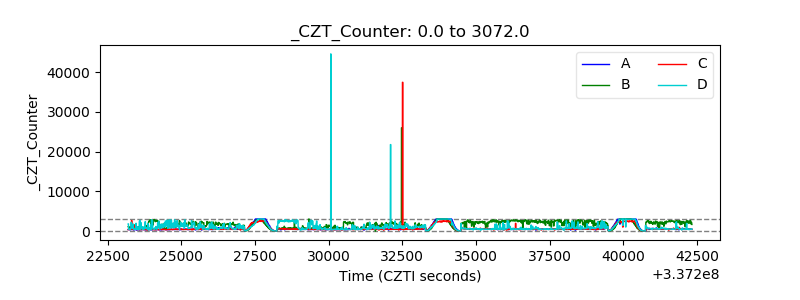 |
| +2.5 Volts monitor | 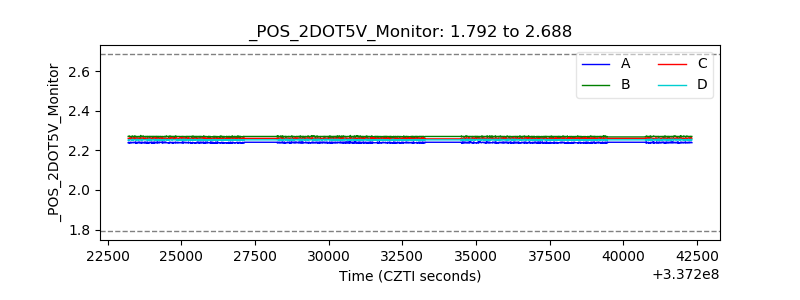 |
| +5 Volts monitor |  |
| _ROLL_ROT | 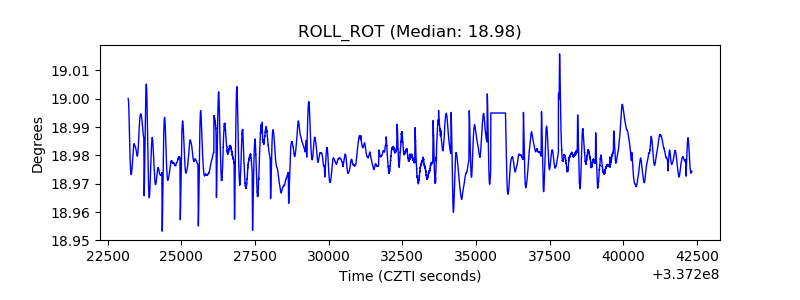 |
| _Roll_DEC | 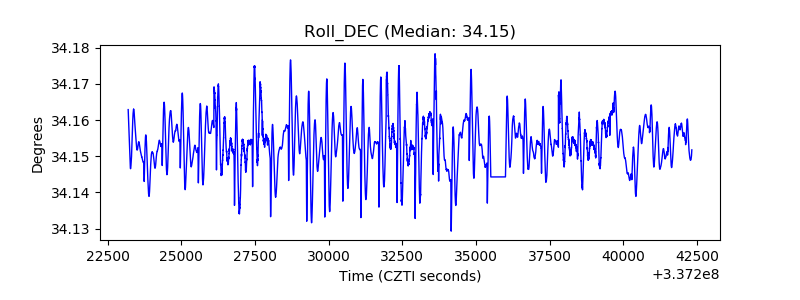 |
| _Roll_RA | 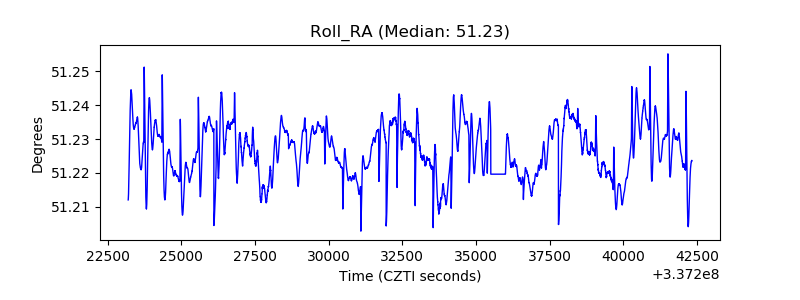 |
| Veto Counter | 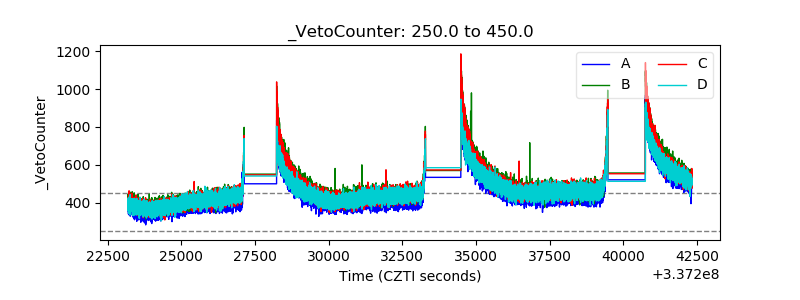 |