| Param | Original file | Final file |
|---|---|---|
| Filename | modeM0/AS1T03_223T01_9000003850_26749cztM0_level2.evt | modeM0/AS1T03_223T01_9000003850_26749cztM0_level2_quad_clean.evt |
| Size (bytes) | 667,961,280 | 74,442,240 |
| Size | 637.0 MB | 71.0 MB |
| Events in quadrant A | 2,867,293 | 517,509 |
| Events in quadrant B | 9,370,133 | 393,901 |
| Events in quadrant C | 2,851,395 | 496,263 |
| Events in quadrant D | 4,777,303 | 470,132 |
| Mode M9 | |||
|---|---|---|---|
| Quadrant | BADHDUFLAG | Total packets | Discarded packets |
| A | 0 | 14 | 0 |
| B | 0 | 14 | 0 |
| C | 0 | 14 | 0 |
| D | 0 | 14 | 0 |
| Mode M0 | |||
|---|---|---|---|
| Quadrant | BADHDUFLAG | Total packets | Discarded packets |
| A | 0 | 11446 | 0 |
| B | 0 | 31465 | 0 |
| C | 0 | 11480 | 0 |
| D | 0 | 17854 | 0 |
| Quadrant | Total seconds | Saturated seconds | Saturation percentage |
|---|---|---|---|
| A | 5366 | 24 | 0.447261% |
| B | 5367 | 3152 | 58.729271% |
| C | 5367 | 54 | 1.006149% |
| D | 5367 | 507 | 9.446618% |
Noise dominated data is calculated using 1-second bins in cleaned event files. If a bin has >2000 counts, and if more than 50% of those come from <1% of pixels, then it is considered to be noise-dominated and hence unusable.
| Quadrant | # 1 sec bins | Bins with >0 counts | Bins with >2000 counts | High rate bins dominated by noise | Noise dominated (total time) | Noise dominated (detector-on time) | Marked lightcurve |
|---|---|---|---|---|---|---|---|
| A | 6716 | 5367 | 0 | 0 | 0.00% | 0.00% | 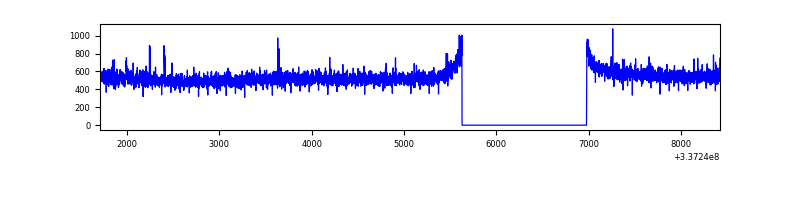 |
| B | 6717 | 5368 | 2541 | 2541 | 37.83% | 47.34% | 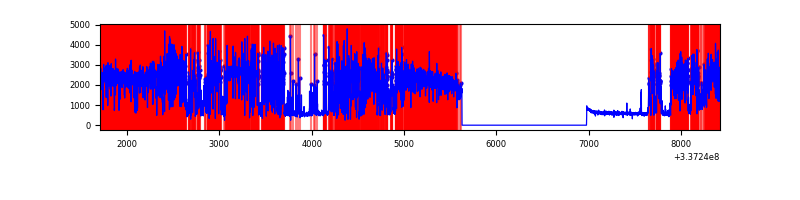 |
| C | 6717 | 5368 | 3 | 3 | 0.04% | 0.06% | 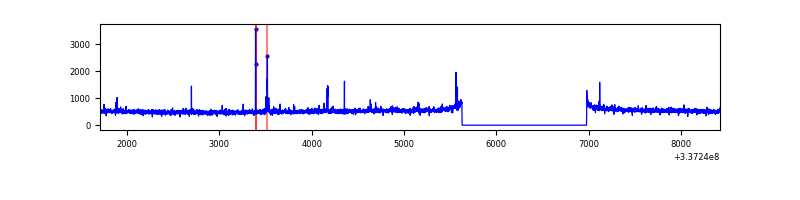 |
| D | 6717 | 5368 | 387 | 387 | 5.76% | 7.21% | 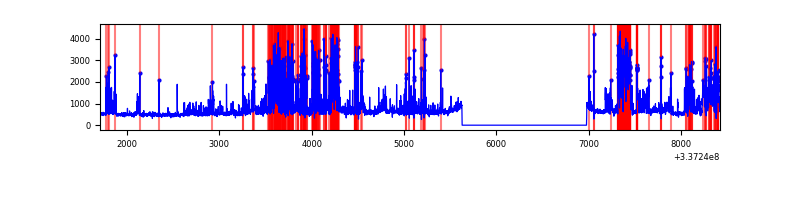 |
Top three noisy pixels from each quadrant. If the there are fewer than three noisy pixels in the level2.evt file, extra rows are filled as -1
| Pixel properties | Quadrant properties | ||||||
|---|---|---|---|---|---|---|---|
| Quadrant | DetID | PixID | Counts | Sigma | Mean | Median | Sigma |
| A | 0 | 13 | 15993 | 103.7 | 736 | 723 | 147.3 |
| A | 12 | 96 | 9960 | 62.73 | 736 | 723 | 147.3 |
| A | 13 | 254 | 7929 | 48.94 | 736 | 723 | 147.3 |
| B | 0 | 189 | 7195490 | 71265.59 | 544 | 533 | 101.0 |
| B | 10 | 246 | 35742 | 348.74 | 544 | 533 | 101.0 |
| B | 3 | 112 | 12655 | 120.07 | 544 | 533 | 101.0 |
| C | 14 | 238 | 112461 | 704.86 | 688 | 693 | 158.6 |
| C | 15 | 208 | 35375 | 218.72 | 688 | 693 | 158.6 |
| C | 2 | 16 | 14582 | 87.59 | 688 | 693 | 158.6 |
| D | 7 | 80 | 1484682 | 8683.39 | 676 | 656 | 170.9 |
| D | 1 | 52 | 522856 | 3055.52 | 676 | 656 | 170.9 |
| D | 12 | 233 | 113599 | 660.86 | 676 | 656 | 170.9 |
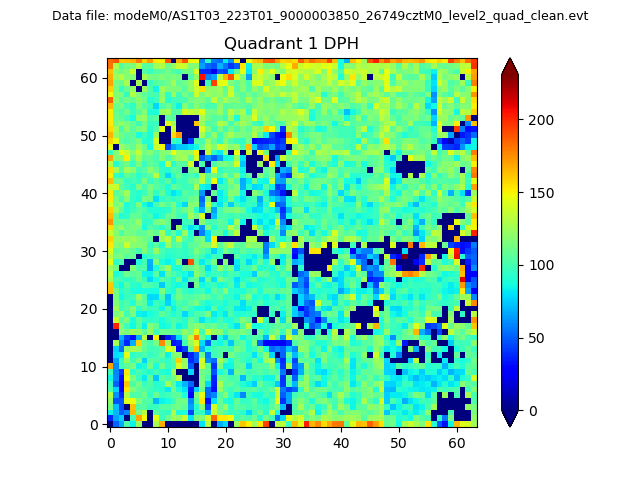
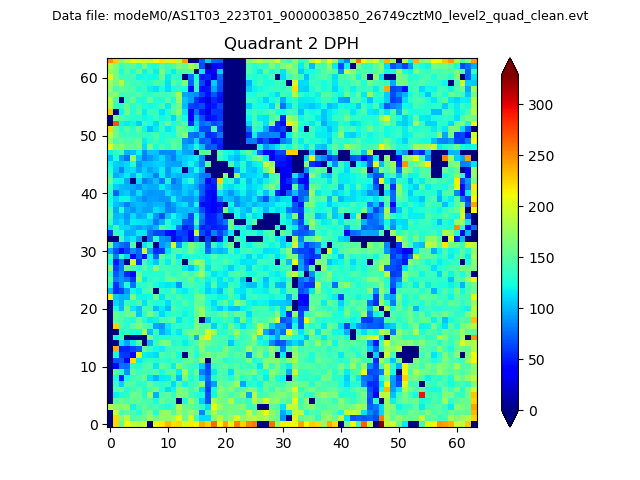
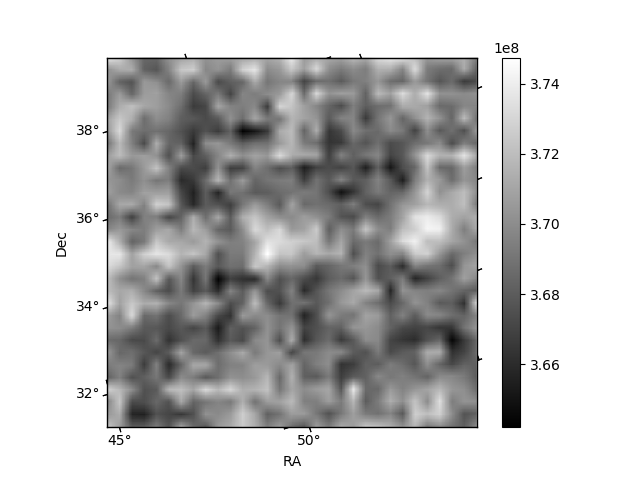
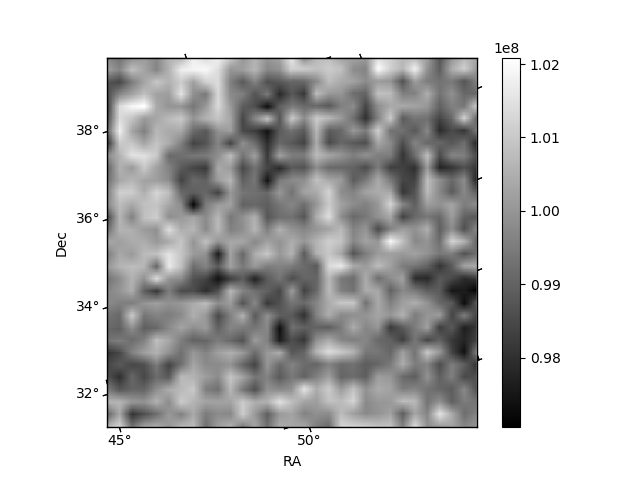
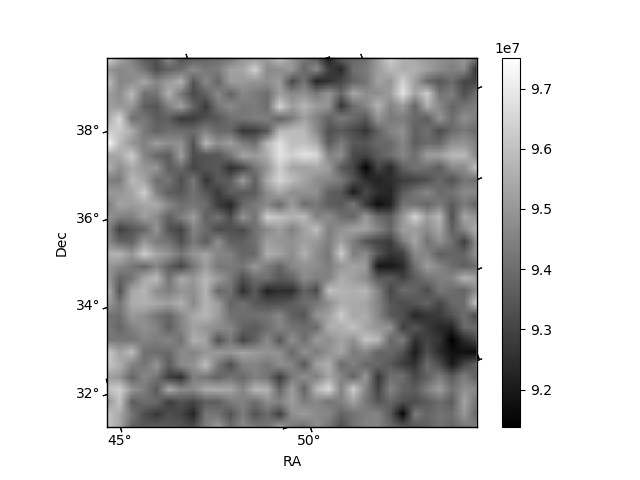
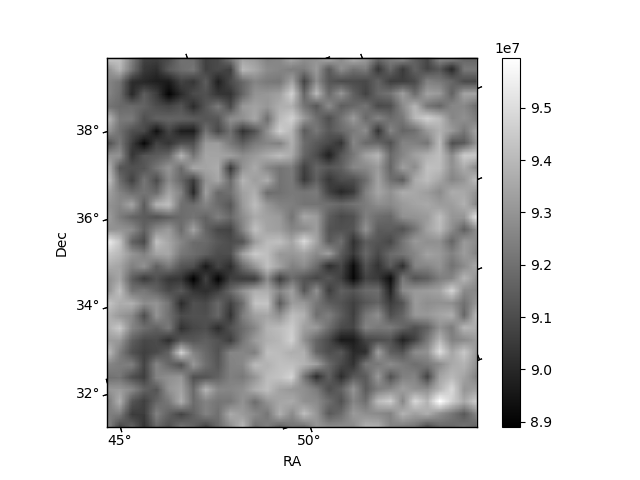
Histogram calculated using DETX and DETY for each event in the final _common_clean file
| Quadrant A |  |
 |
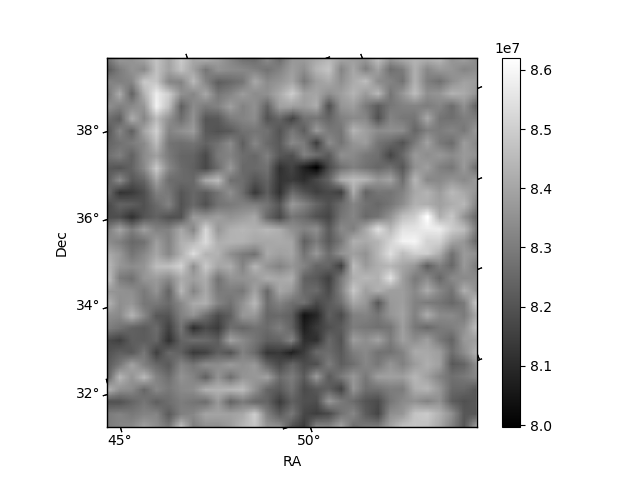
Quadrant B |
|---|---|---|---|
| Quadrant D | 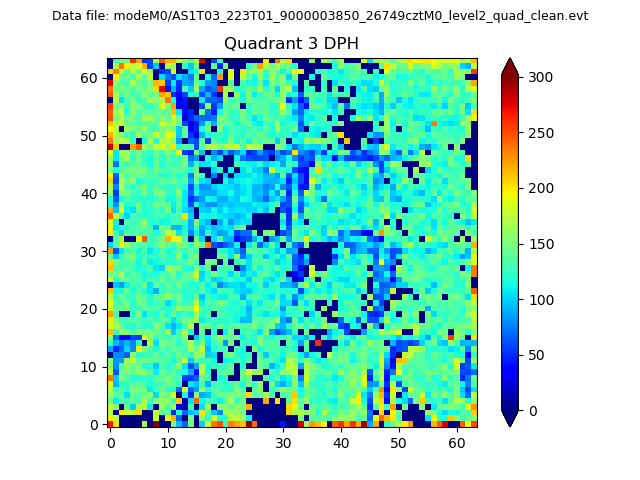 |
 |
Quadrant C |
| Plot type | Count rate plots | Images |
|---|---|---|
| Comparison with Poisson distribution Blue bars denote a histogram of data divided into 1 sec bins. Red curve is a Poisson curve with rate = median count rate of data. |
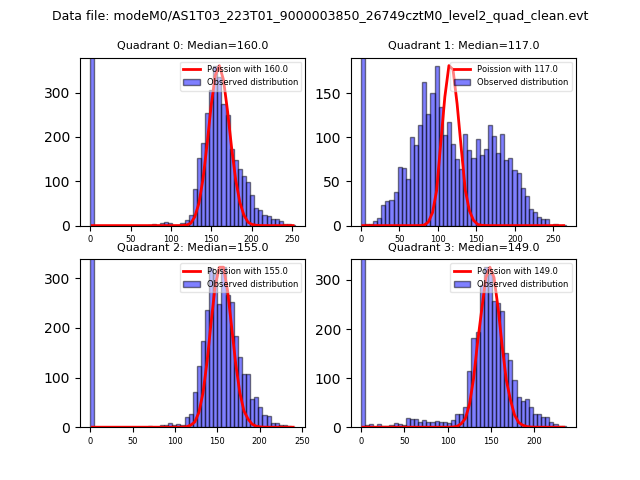 |
 |
| Quadrant-wise count rates Data is divided into 100 sec bins |
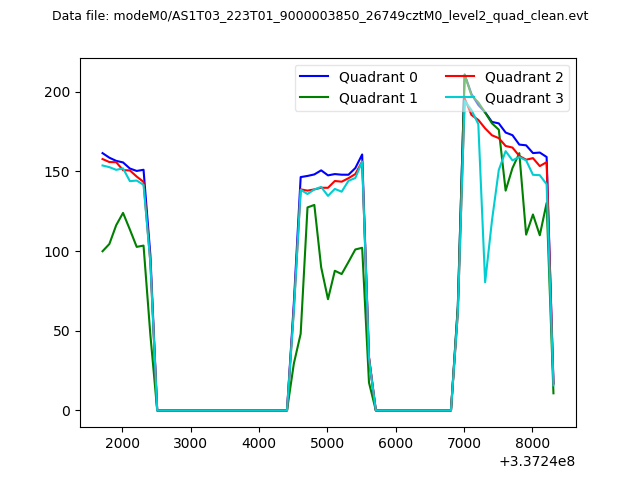 |
|
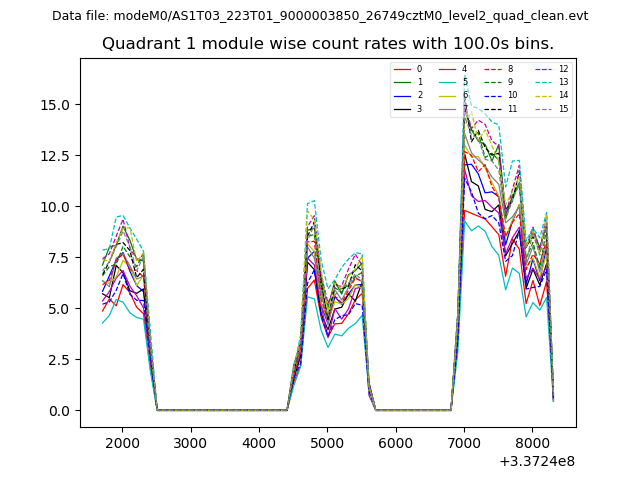
| Module-wise count rates for Quadrant A Data is divided into 100 sec bins |
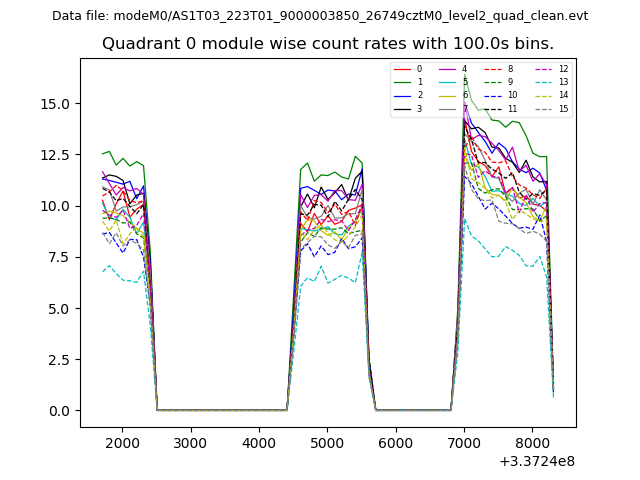 |
 |
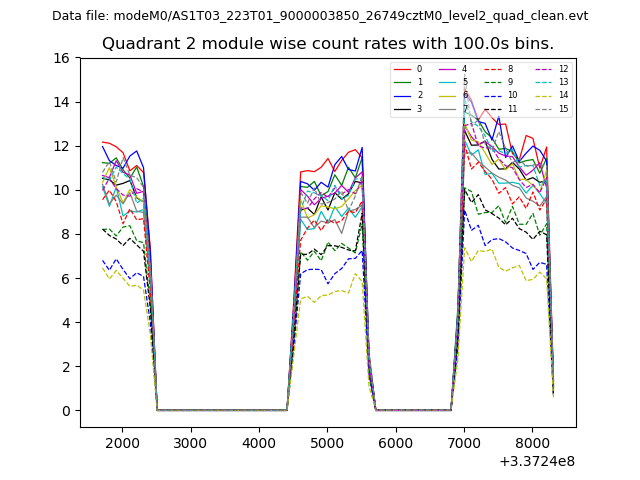
| Module-wise count rates for Quadrant B Data is divided into 100 sec bins |
 |
 |
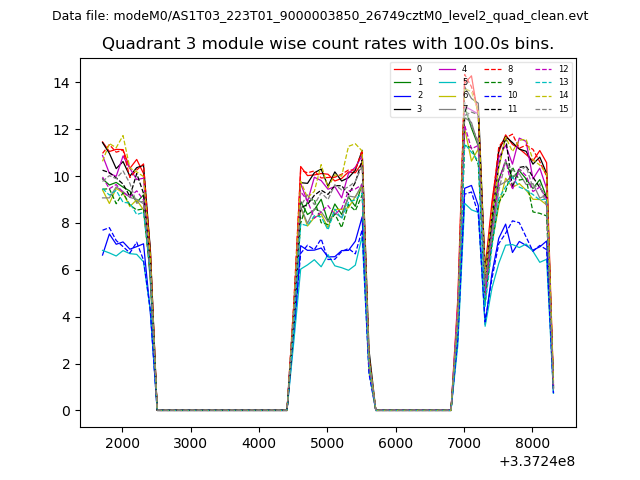
| Module-wise count rates for Quadrant C Data is divided into 100 sec bins |
 |
 |
| Module-wise count rates for Quadrant D Data is divided into 100 sec bins |
 |
 |
| Parameter | Plot |
|---|---|
| CZT HV Monitor | 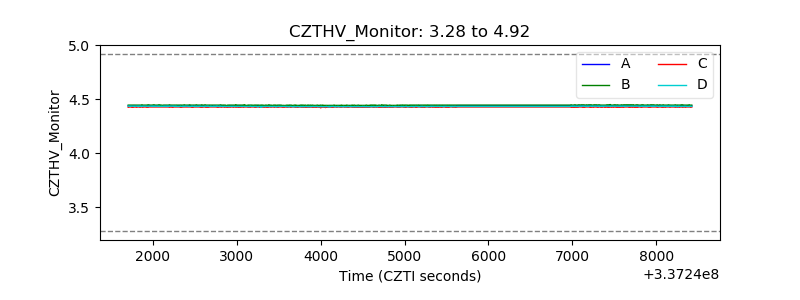 |
| D_VDD | 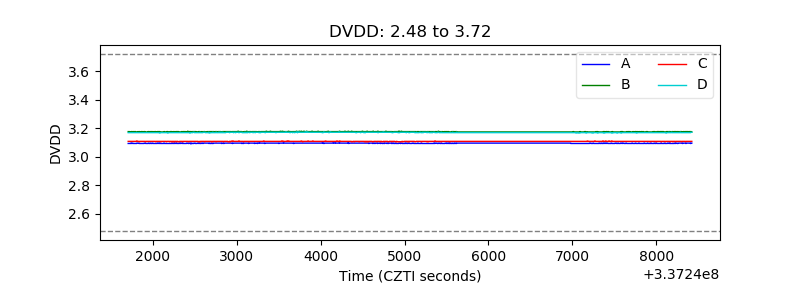 |
| Temperature 1 | 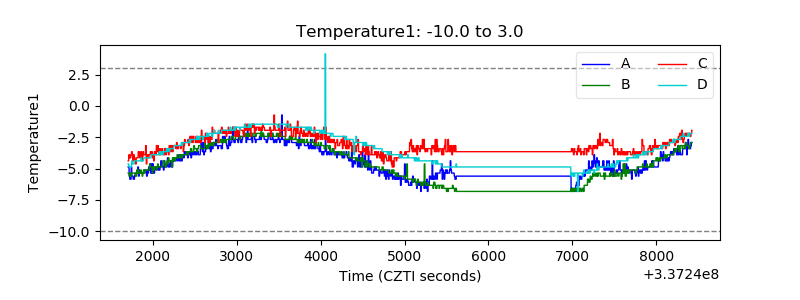 |
| Veto HV Monitor |  |
| Veto LLD | 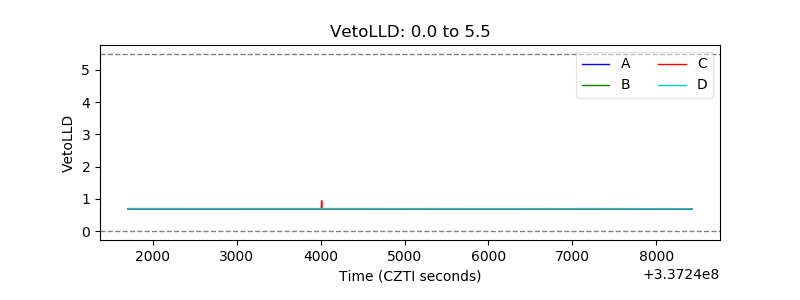 |
| Alpha Counter | 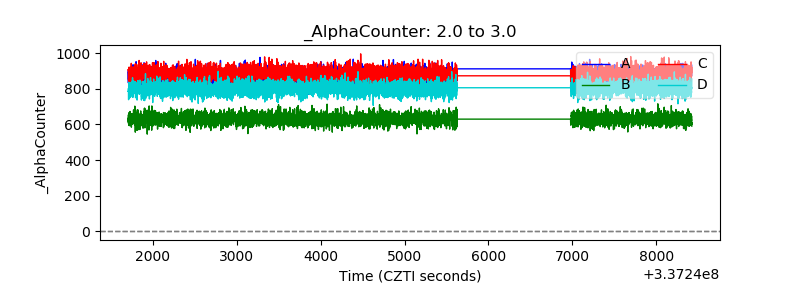 |
| _CPM_Rate |  |
| CZT Counter | 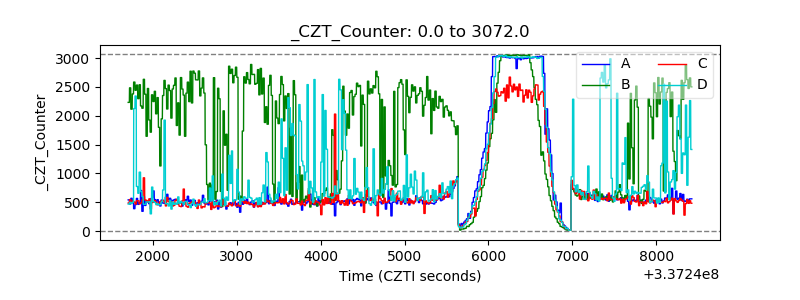 |
| +2.5 Volts monitor |  |
| +5 Volts monitor |  |
| _ROLL_ROT | 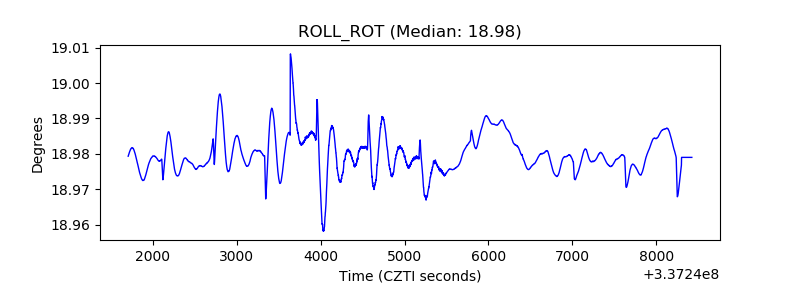 |
| _Roll_DEC | 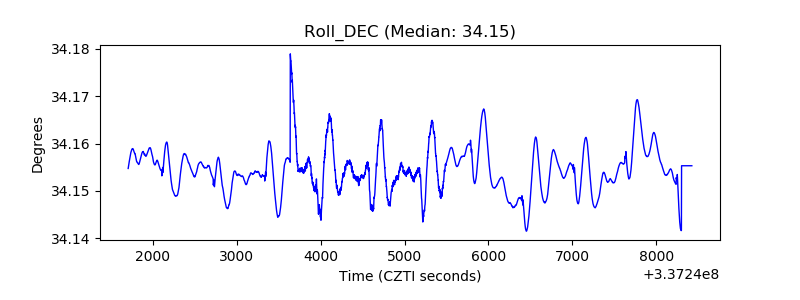 |
| _Roll_RA | 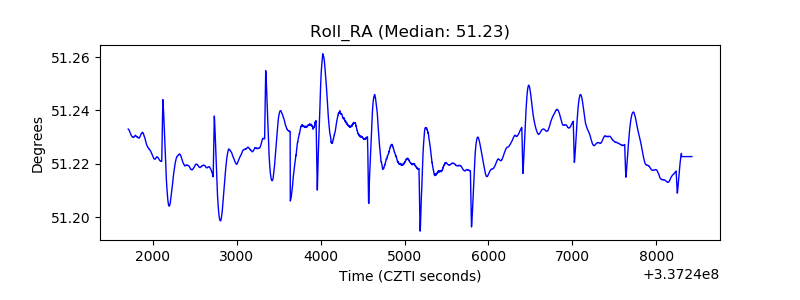 |
| Veto Counter | 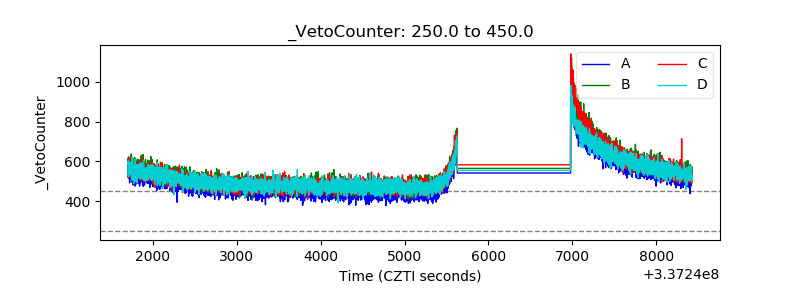 |