| Param | Original file | Final file |
|---|---|---|
| Filename | modeM0/AS1T03_223T01_9000003850_26750cztM0_level2.evt | modeM0/AS1T03_223T01_9000003850_26750cztM0_level2_quad_clean.evt |
| Size (bytes) | 3,201,232,320 | 317,831,040 |
| Size | 3.0 GB | 303.1 MB |
| Events in quadrant A | 13,375,304 | 2,174,141 |
| Events in quadrant B | 43,611,192 | 1,713,272 |
| Events in quadrant C | 12,982,956 | 2,108,757 |
| Events in quadrant D | 25,292,228 | 1,895,930 |
| Mode M9 | |||
|---|---|---|---|
| Quadrant | BADHDUFLAG | Total packets | Discarded packets |
| A | 0 | 63 | 0 |
| B | 0 | 63 | 0 |
| C | 0 | 63 | 0 |
| D | 0 | 63 | 0 |
| Mode M0 | |||
|---|---|---|---|
| Quadrant | BADHDUFLAG | Total packets | Discarded packets |
| A | 0 | 54896 | 0 |
| B | 0 | 146725 | 0 |
| C | 0 | 53560 | 0 |
| D | 0 | 92460 | 0 |
| Quadrant | Total seconds | Saturated seconds | Saturation percentage |
|---|---|---|---|
| A | 25161 | 212 | 0.842574% |
| B | 25160 | 13786 | 54.793323% |
| C | 25160 | 365 | 1.450715% |
| D | 25161 | 3389 | 13.469258% |
Noise dominated data is calculated using 1-second bins in cleaned event files. If a bin has >2000 counts, and if more than 50% of those come from <1% of pixels, then it is considered to be noise-dominated and hence unusable.
| Quadrant | # 1 sec bins | Bins with >0 counts | Bins with >2000 counts | High rate bins dominated by noise | Noise dominated (total time) | Noise dominated (detector-on time) | Marked lightcurve |
|---|---|---|---|---|---|---|---|
| A | 31361 | 25166 | 7 | 7 | 0.02% | 0.03% | 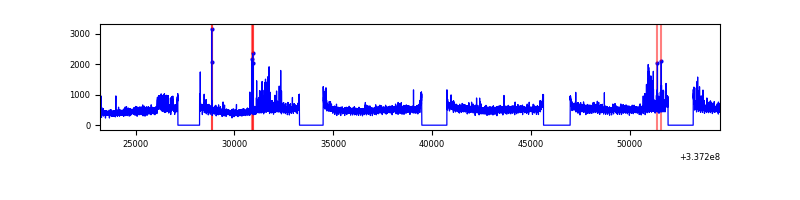 |
| B | 31359 | 25163 | 10887 | 10887 | 34.72% | 43.27% | 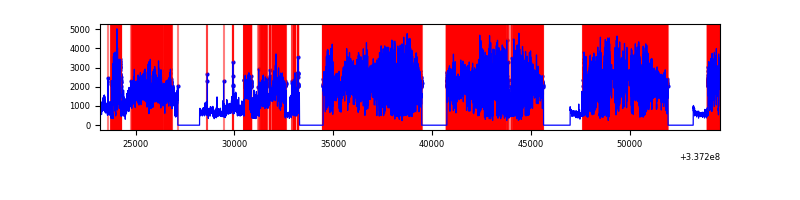 |
| C | 31360 | 25165 | 16 | 16 | 0.05% | 0.06% | 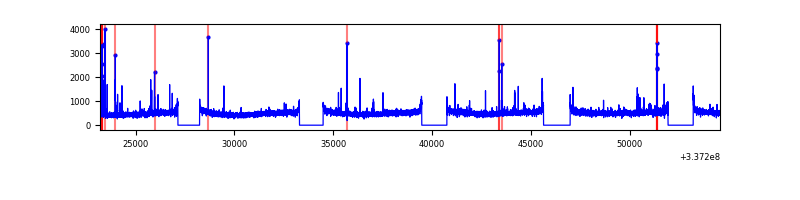 |
| D | 31361 | 25166 | 2621 | 2621 | 8.36% | 10.41% | 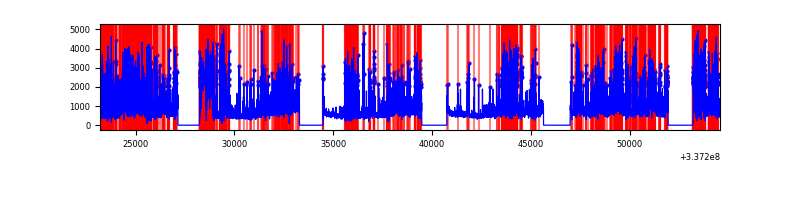 |
Top three noisy pixels from each quadrant. If the there are fewer than three noisy pixels in the level2.evt file, extra rows are filled as -1
| Pixel properties | Quadrant properties | ||||||
|---|---|---|---|---|---|---|---|
| Quadrant | DetID | PixID | Counts | Sigma | Mean | Median | Sigma |
| A | 0 | 13 | 442504 | 672.93 | 3303 | 3245 | 652.8 |
| A | 11 | 29 | 174243 | 261.96 | 3303 | 3245 | 652.8 |
| A | 13 | 254 | 39679 | 55.82 | 3303 | 3245 | 652.8 |
| B | 0 | 189 | 33493792 | 71835.5 | 2536 | 2483 | 466.2 |
| B | 10 | 246 | 103054 | 215.71 | 2536 | 2483 | 466.2 |
| B | 3 | 112 | 59669 | 122.66 | 2536 | 2483 | 466.2 |
| C | 14 | 238 | 508719 | 705.88 | 3116 | 3141 | 716.2 |
| C | 2 | 16 | 161906 | 221.67 | 3116 | 3141 | 716.2 |
| C | 15 | 208 | 117839 | 160.14 | 3116 | 3141 | 716.2 |
| D | 7 | 80 | 9259621 | 12393.02 | 2990 | 2912 | 746.9 |
| D | 1 | 52 | 3608591 | 4827.34 | 2990 | 2912 | 746.9 |
| D | 2 | 250 | 451615 | 600.73 | 2990 | 2912 | 746.9 |
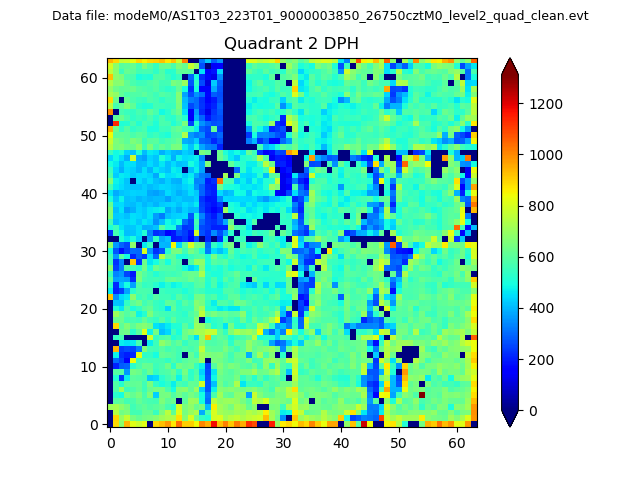
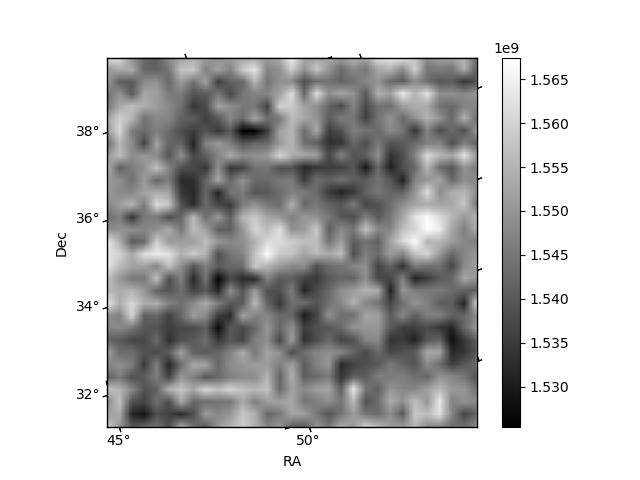
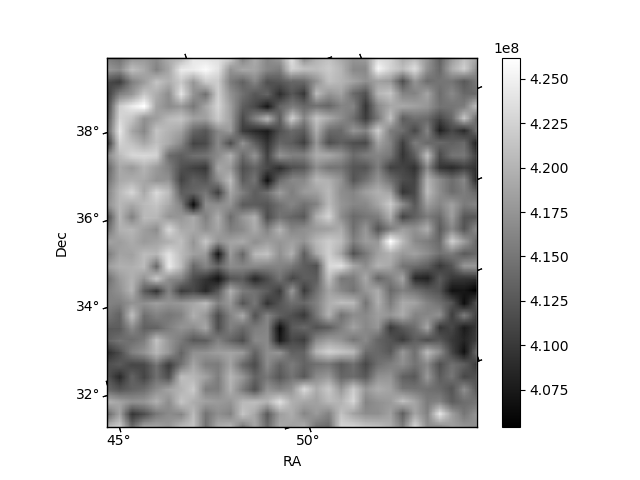
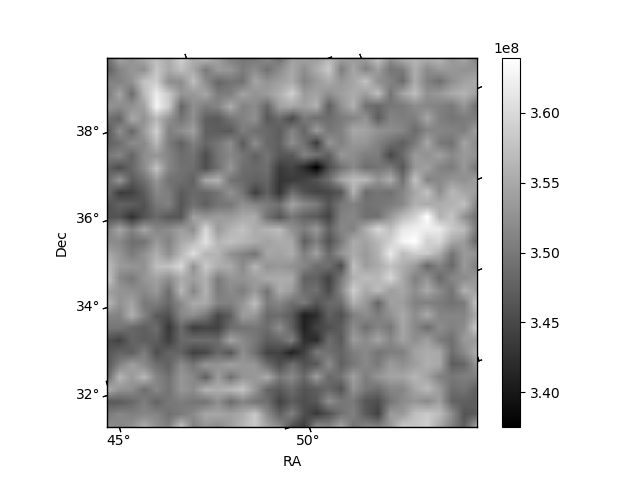
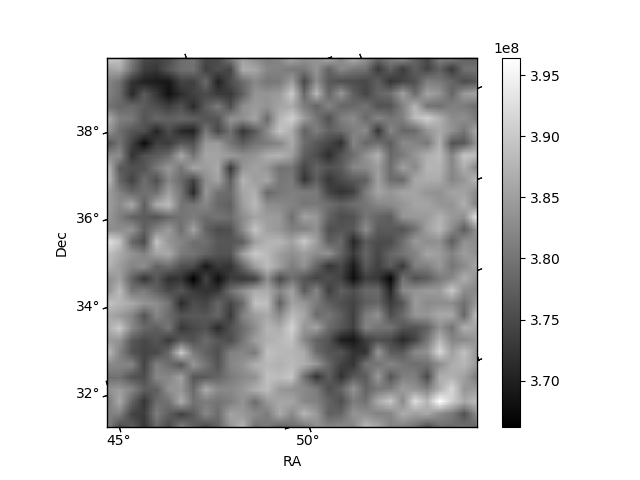
Histogram calculated using DETX and DETY for each event in the final _common_clean file
| Quadrant A | 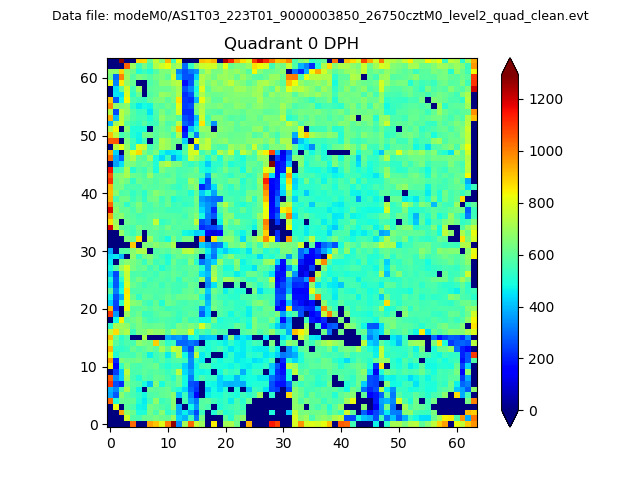 |
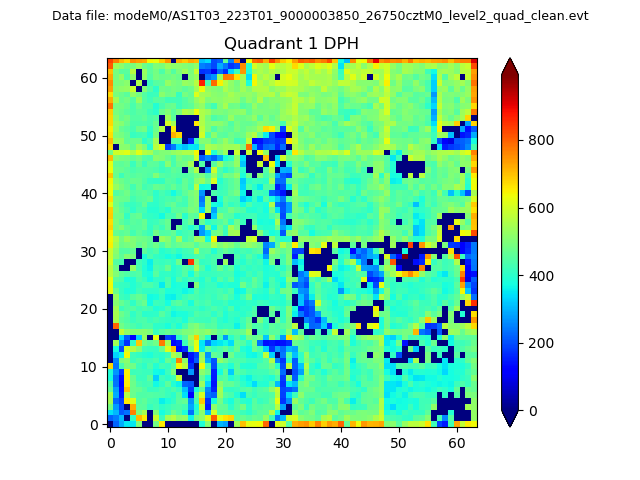 |
Quadrant B |
|---|---|---|---|
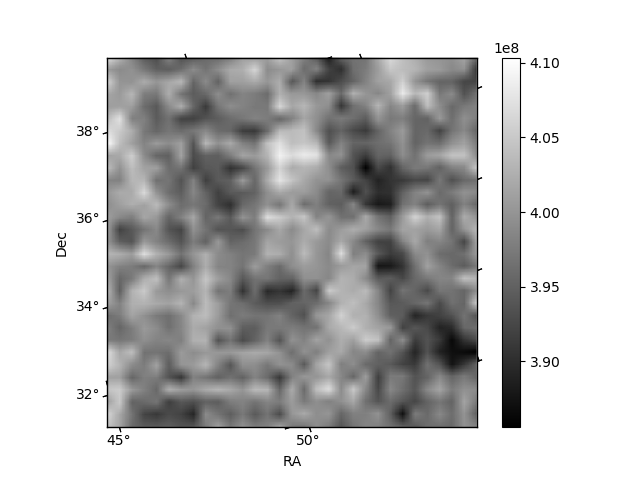
| Quadrant D | 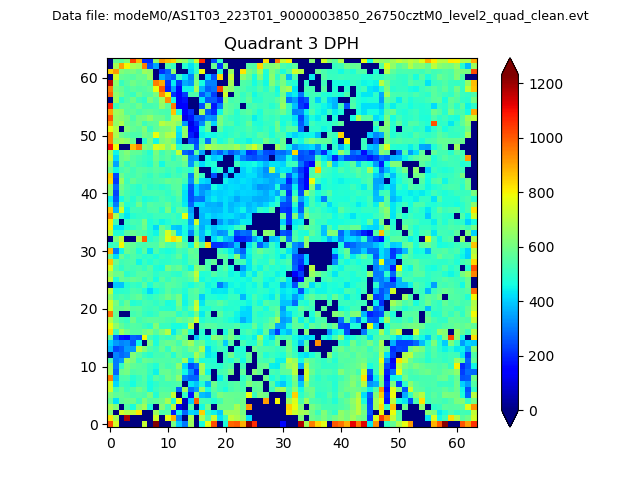 |
 |
Quadrant C |
| Plot type | Count rate plots | Images |
|---|---|---|
| Comparison with Poisson distribution Blue bars denote a histogram of data divided into 1 sec bins. Red curve is a Poisson curve with rate = median count rate of data. |
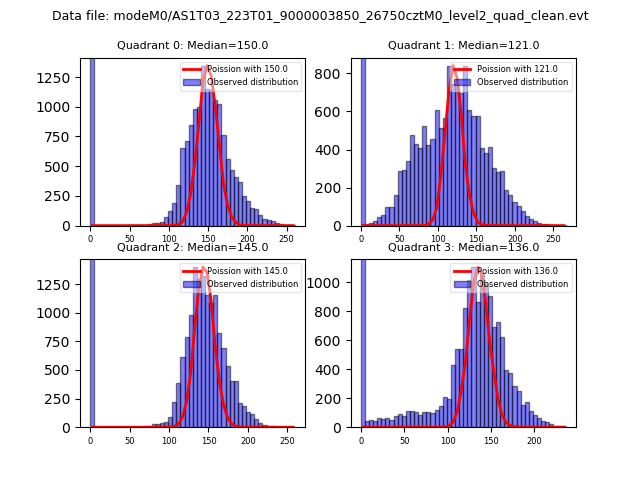 |
 |
| Quadrant-wise count rates Data is divided into 100 sec bins |
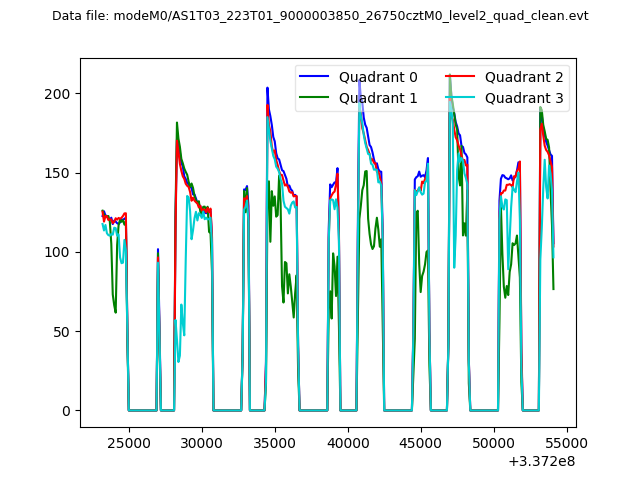 |
|
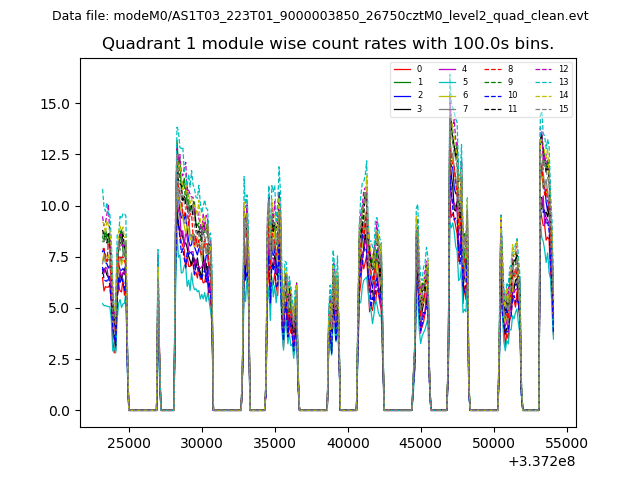
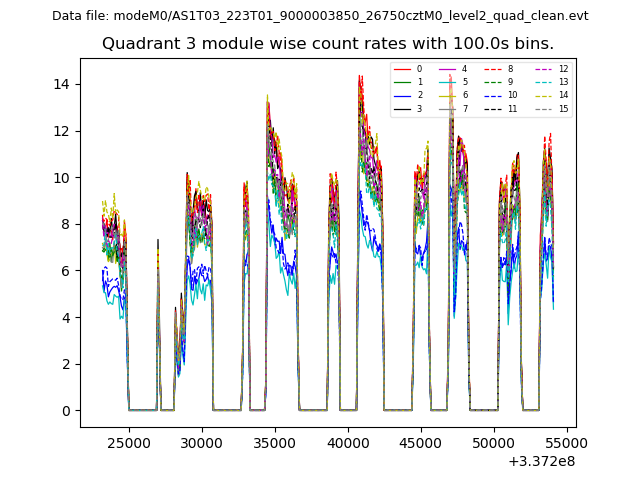
| Module-wise count rates for Quadrant A Data is divided into 100 sec bins |
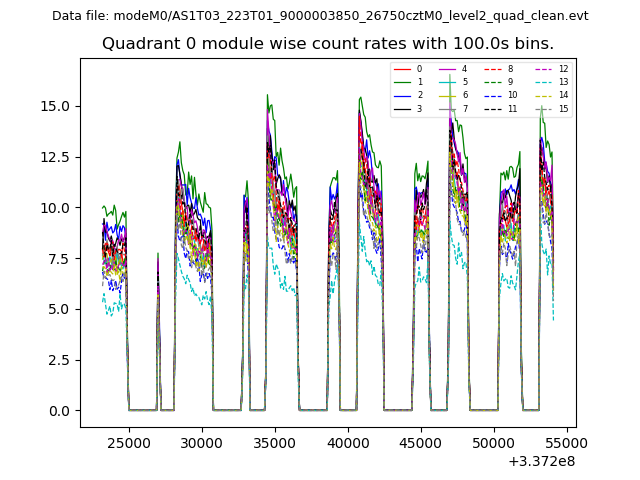 |
 |
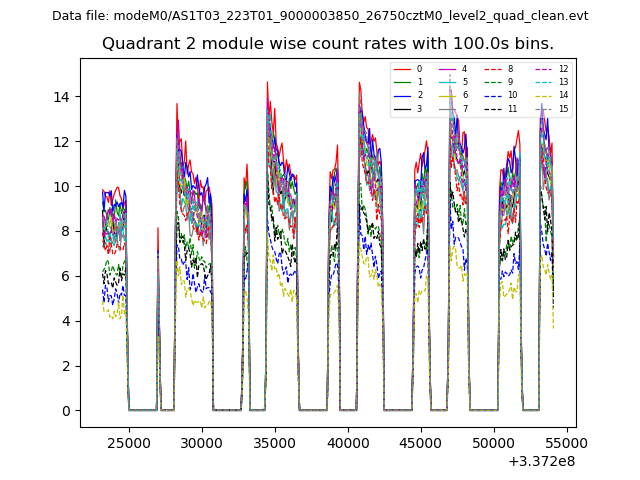
| Module-wise count rates for Quadrant B Data is divided into 100 sec bins |
 |
 |
| Module-wise count rates for Quadrant C Data is divided into 100 sec bins |
 |
 |
| Module-wise count rates for Quadrant D Data is divided into 100 sec bins |
 |
 |
| Parameter | Plot |
|---|---|
| CZT HV Monitor | 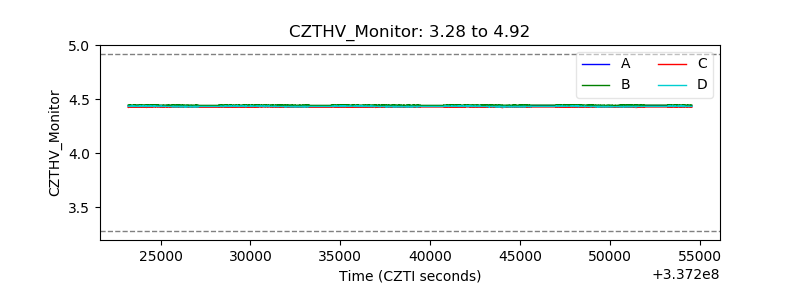 |
| D_VDD | 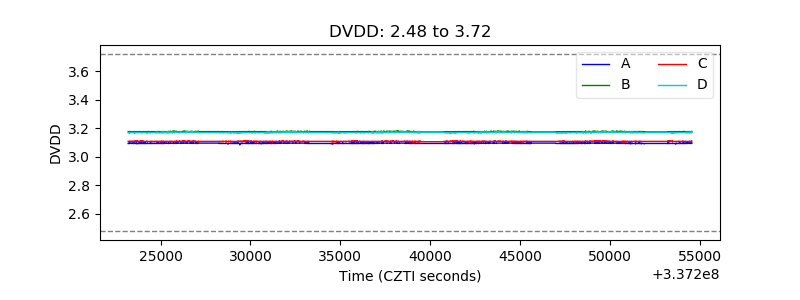 |
| Temperature 1 | 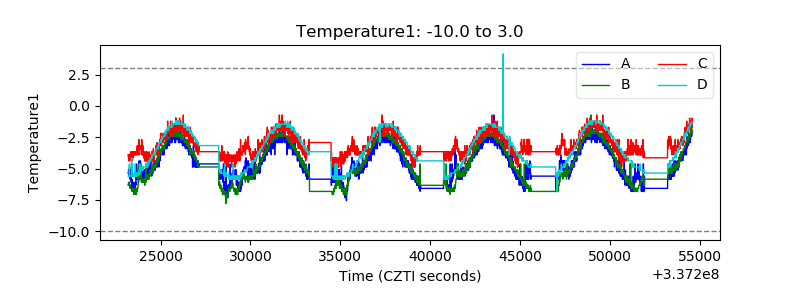 |
| Veto HV Monitor |  |
| Veto LLD | 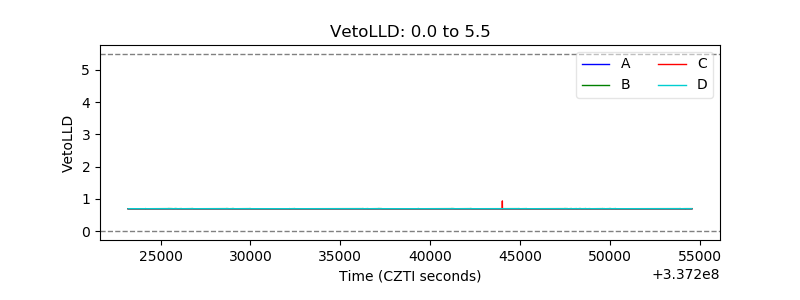 |
| Alpha Counter | 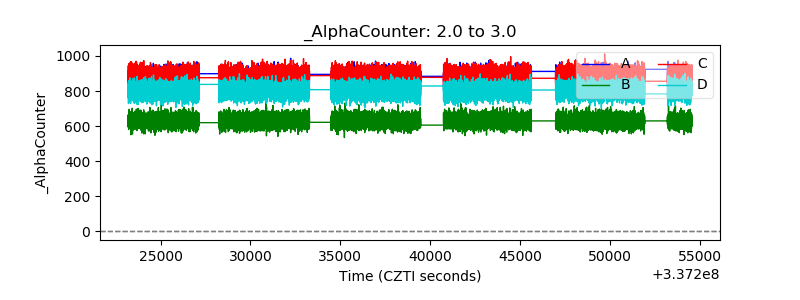 |
| _CPM_Rate |  |
| CZT Counter | 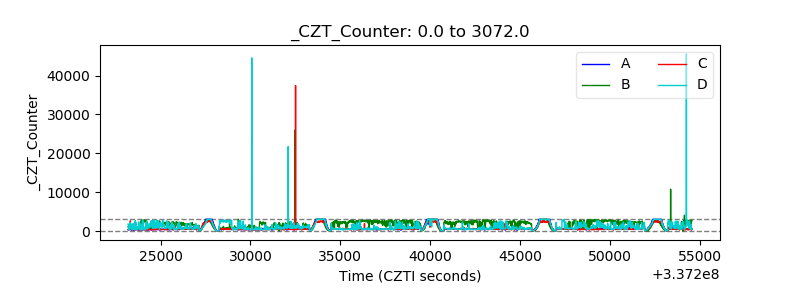 |
| +2.5 Volts monitor |  |
| +5 Volts monitor |  |
| _ROLL_ROT | 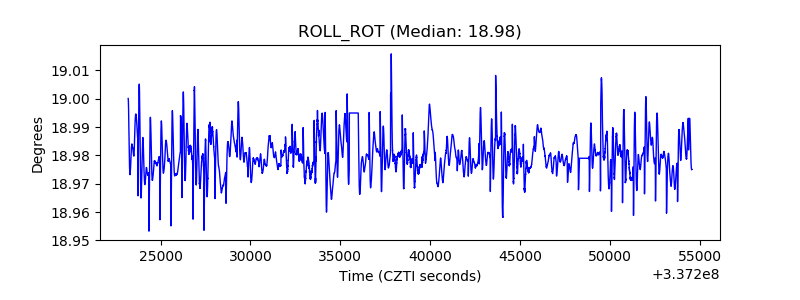 |
| _Roll_DEC |  |
| _Roll_RA |  |
| Veto Counter | 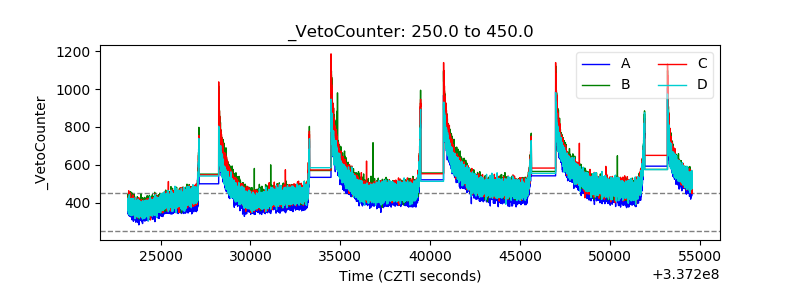 |