| Param | Original file | Final file |
|---|---|---|
| Filename | modeM0/AS1T03_223T01_9000003850_26751cztM0_level2.evt | modeM0/AS1T03_223T01_9000003850_26751cztM0_level2_quad_clean.evt |
| Size (bytes) | 994,824,000 | 80,285,760 |
| Size | 948.7 MB | 76.6 MB |
| Events in quadrant A | 4,092,907 | 544,627 |
| Events in quadrant B | 13,284,869 | 415,964 |
| Events in quadrant C | 3,666,279 | 530,199 |
| Events in quadrant D | 8,628,028 | 466,780 |
| Mode M9 | |||
|---|---|---|---|
| Quadrant | BADHDUFLAG | Total packets | Discarded packets |
| A | 0 | 11 | 0 |
| B | 0 | 11 | 0 |
| C | 0 | 11 | 0 |
| D | 0 | 11 | 0 |
| Mode M0 | |||
|---|---|---|---|
| Quadrant | BADHDUFLAG | Total packets | Discarded packets |
| A | 0 | 16299 | 0 |
| B | 0 | 44010 | 0 |
| C | 0 | 14683 | 0 |
| D | 0 | 30289 | 0 |
| Quadrant | Total seconds | Saturated seconds | Saturation percentage |
|---|---|---|---|
| A | 6771 | 171 | 2.525476% |
| B | 6772 | 4628 | 68.340224% |
| C | 6772 | 178 | 2.628470% |
| D | 6771 | 1737 | 25.653522% |
Noise dominated data is calculated using 1-second bins in cleaned event files. If a bin has >2000 counts, and if more than 50% of those come from <1% of pixels, then it is considered to be noise-dominated and hence unusable.
| Quadrant | # 1 sec bins | Bins with >0 counts | Bins with >2000 counts | High rate bins dominated by noise | Noise dominated (total time) | Noise dominated (detector-on time) | Marked lightcurve |
|---|---|---|---|---|---|---|---|
| A | 7891 | 6772 | 15 | 15 | 0.19% | 0.22% | 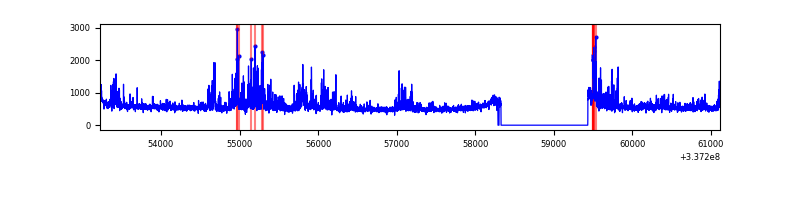 |
| B | 7892 | 6773 | 4065 | 4065 | 51.51% | 60.02% | 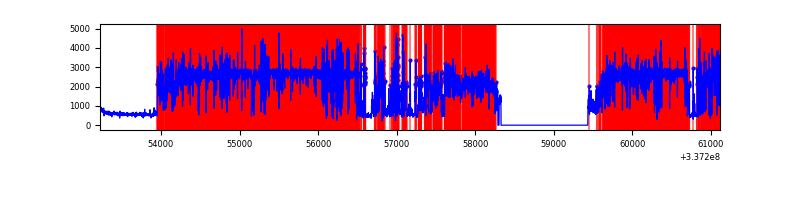 |
| C | 7892 | 6773 | 13 | 13 | 0.16% | 0.19% | 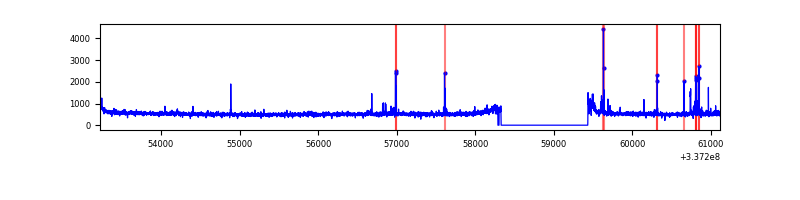 |
| D | 7891 | 6772 | 1296 | 1296 | 16.42% | 19.14% | 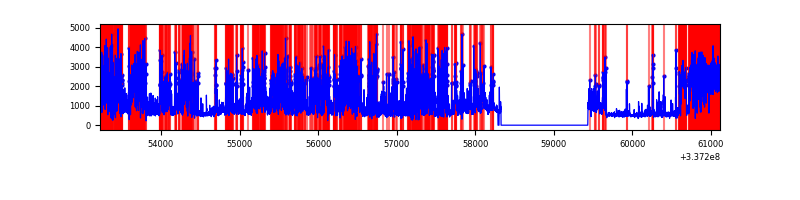 |
Top three noisy pixels from each quadrant. If the there are fewer than three noisy pixels in the level2.evt file, extra rows are filled as -1
| Pixel properties | Quadrant properties | ||||||
|---|---|---|---|---|---|---|---|
| Quadrant | DetID | PixID | Counts | Sigma | Mean | Median | Sigma |
| A | 0 | 13 | 560549 | 3091.93 | 916 | 900 | 181.0 |
| A | 13 | 254 | 10889 | 55.19 | 916 | 900 | 181.0 |
| A | 3 | 137 | 8108 | 39.82 | 916 | 900 | 181.0 |
| B | 0 | 189 | 11113660 | 107638.83 | 551 | 539 | 103.2 |
| B | 12 | 111 | 12023 | 111.23 | 551 | 539 | 103.2 |
| B | 11 | 111 | 10980 | 101.13 | 551 | 539 | 103.2 |
| C | 14 | 238 | 141924 | 705.11 | 863 | 871 | 200.0 |
| C | 14 | 176 | 125194 | 621.48 | 863 | 871 | 200.0 |
| C | 2 | 16 | 15811 | 74.68 | 863 | 871 | 200.0 |
| D | 7 | 80 | 2971879 | 14993.78 | 804 | 785 | 198.2 |
| D | 1 | 52 | 2114333 | 10666.13 | 804 | 785 | 198.2 |
| D | 2 | 250 | 303576 | 1528.05 | 804 | 785 | 198.2 |
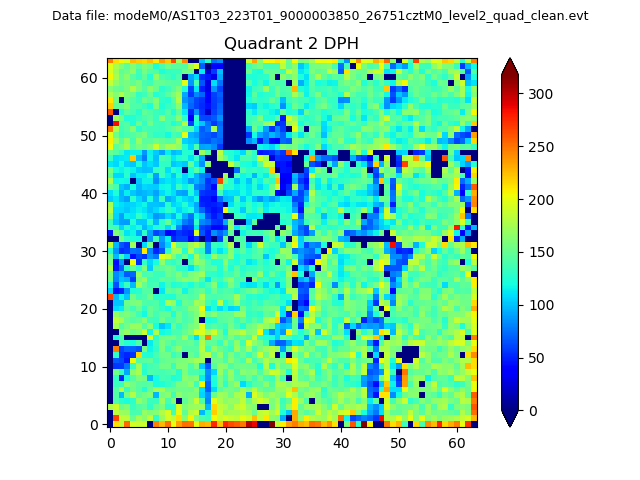
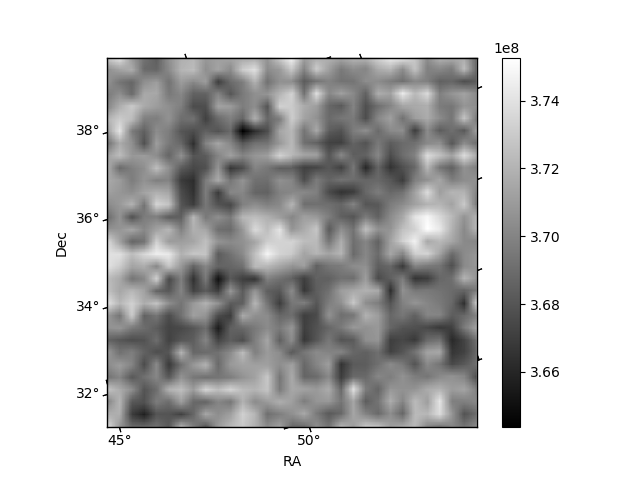
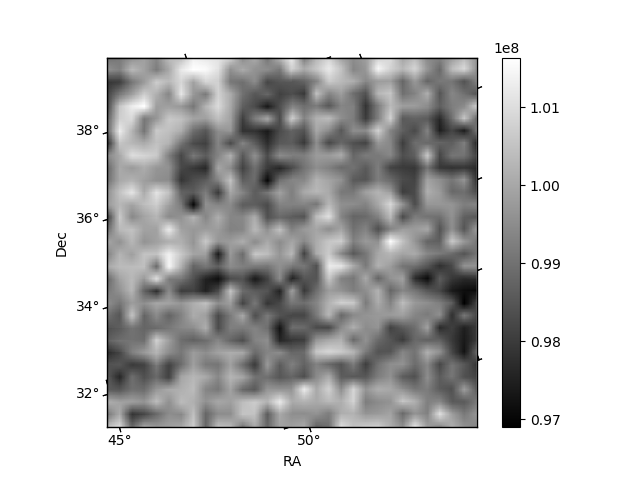
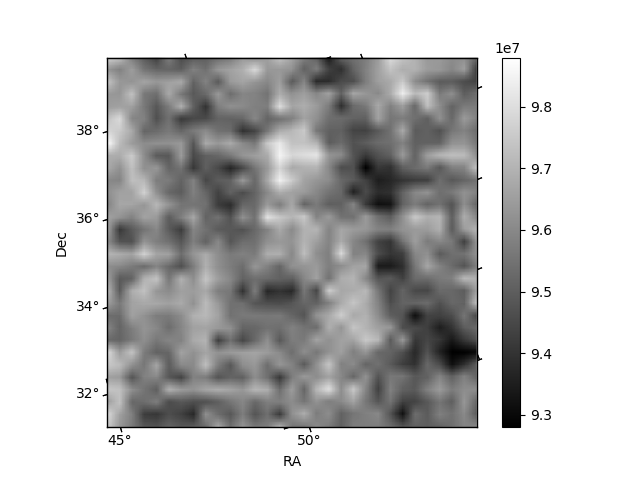
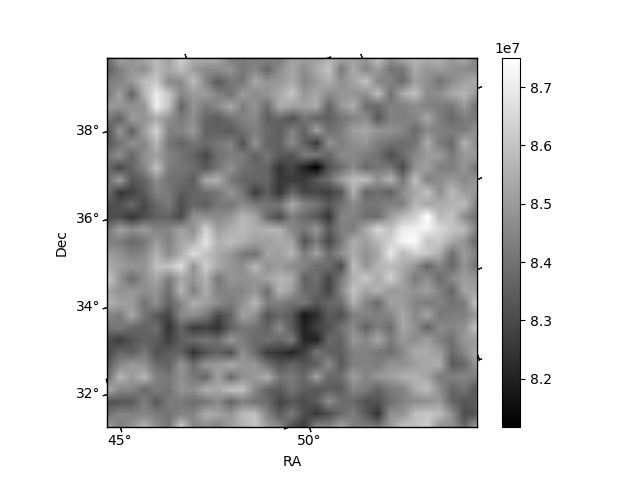
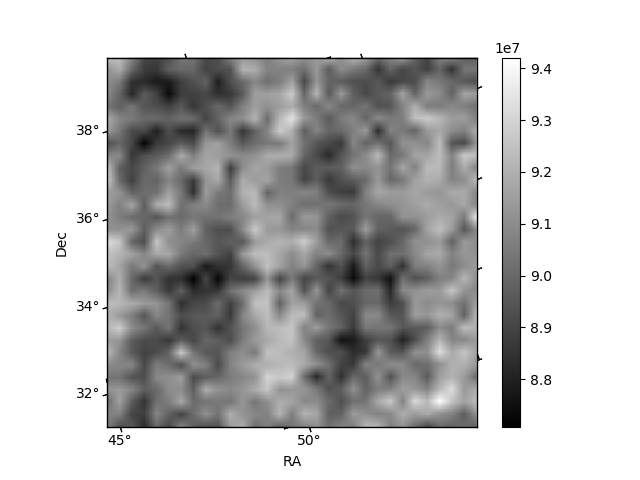
Histogram calculated using DETX and DETY for each event in the final _common_clean file
| Quadrant A | 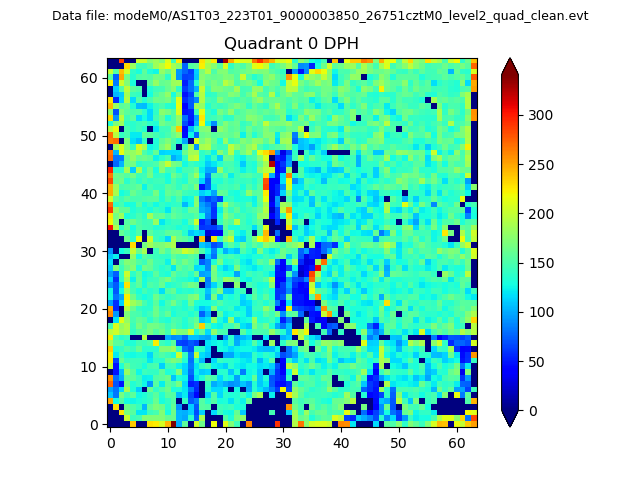 |
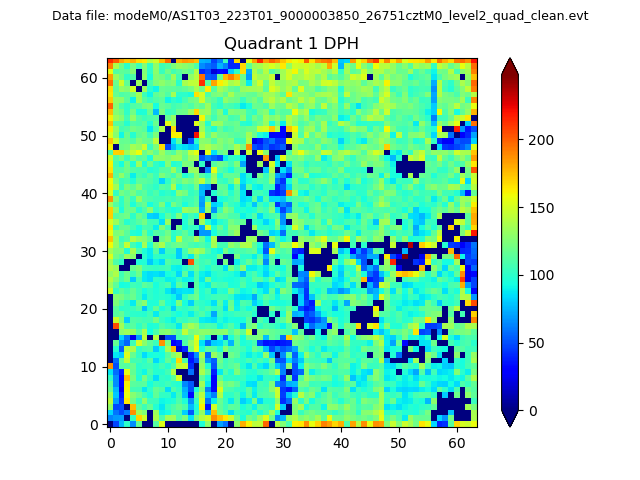 |
Quadrant B |
|---|---|---|---|
| Quadrant D | 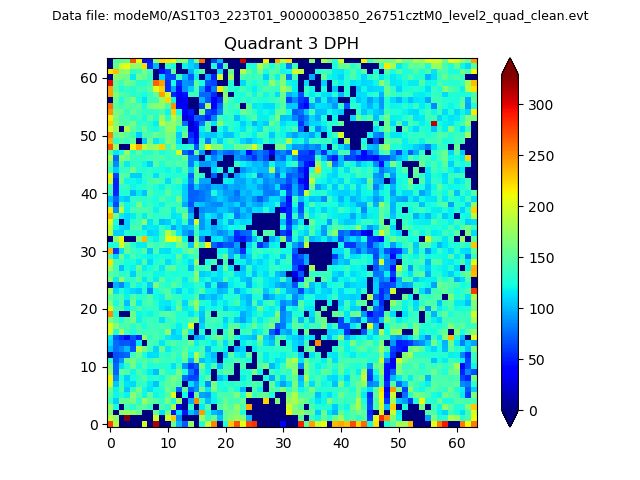 |
 |
Quadrant C |
| Plot type | Count rate plots | Images |
|---|---|---|
| Comparison with Poisson distribution Blue bars denote a histogram of data divided into 1 sec bins. Red curve is a Poisson curve with rate = median count rate of data. |
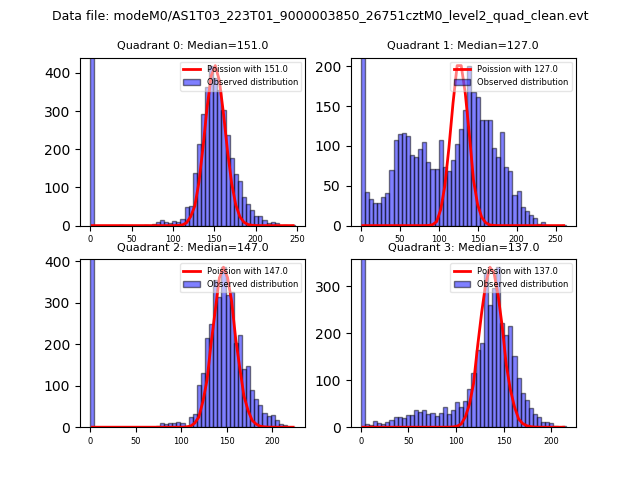 |
 |
| Quadrant-wise count rates Data is divided into 100 sec bins |
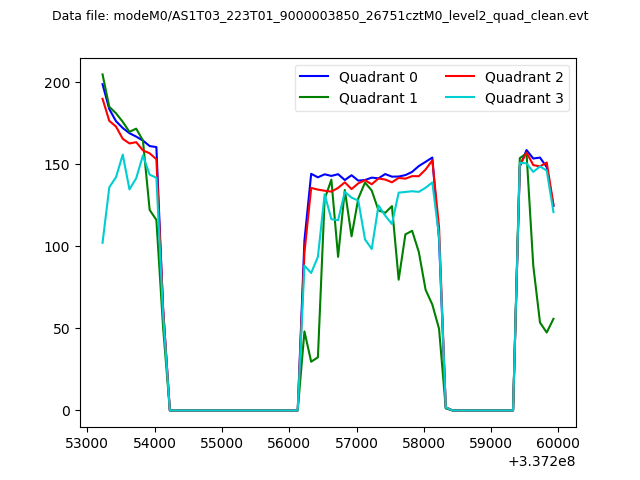 |
|
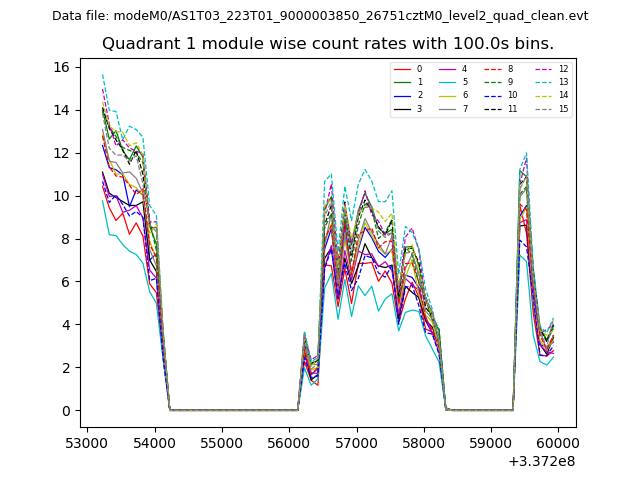
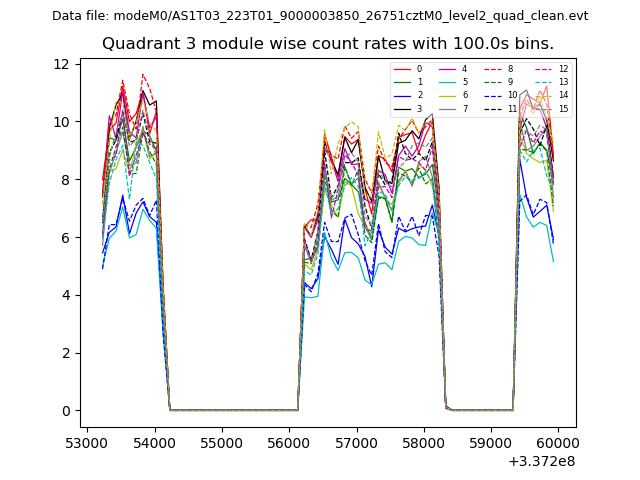
| Module-wise count rates for Quadrant A Data is divided into 100 sec bins |
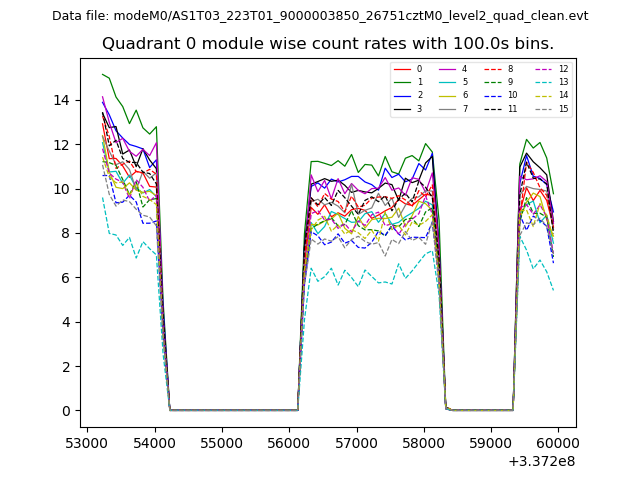 |
 |
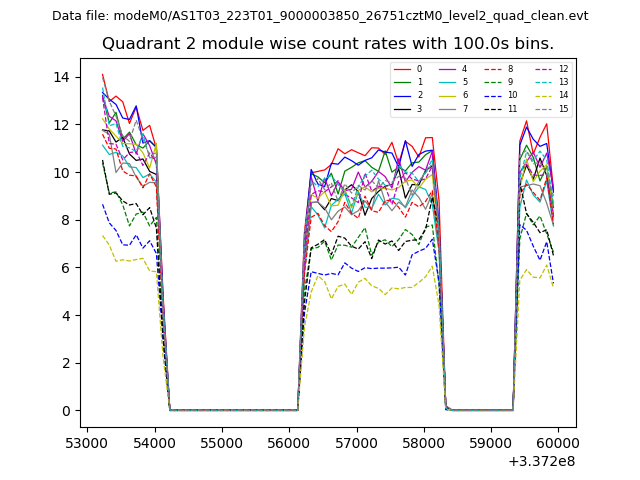
| Module-wise count rates for Quadrant B Data is divided into 100 sec bins |
 |
 |
| Module-wise count rates for Quadrant C Data is divided into 100 sec bins |
 |
 |
| Module-wise count rates for Quadrant D Data is divided into 100 sec bins |
 |
 |
| Parameter | Plot |
|---|---|
| CZT HV Monitor | 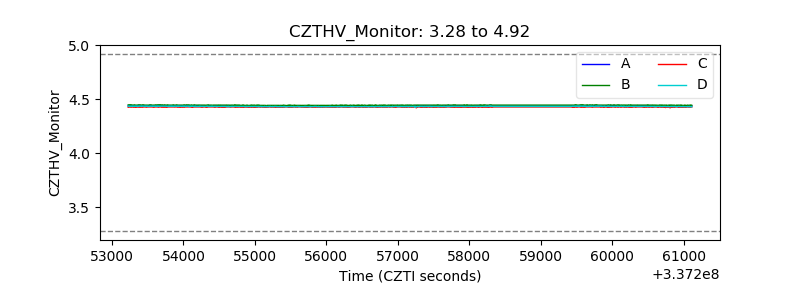 |
| D_VDD |  |
| Temperature 1 | 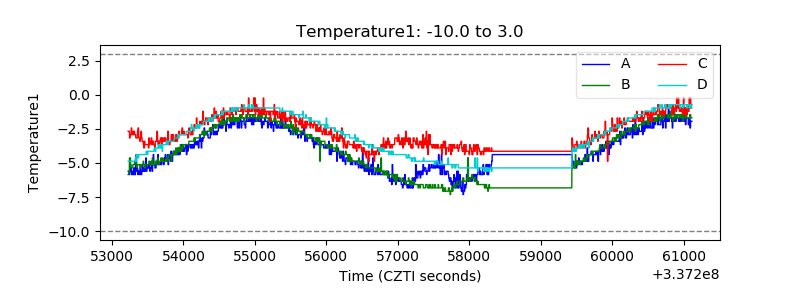 |
| Veto HV Monitor | 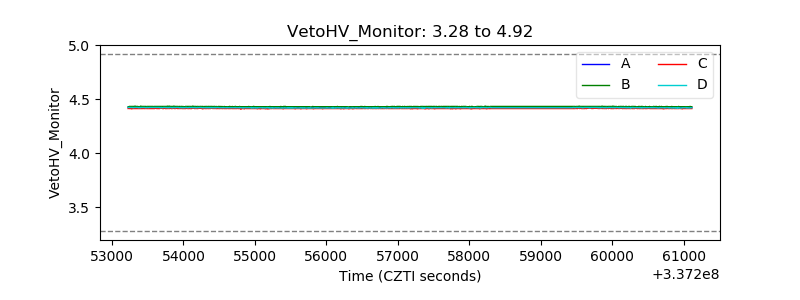 |
| Veto LLD | 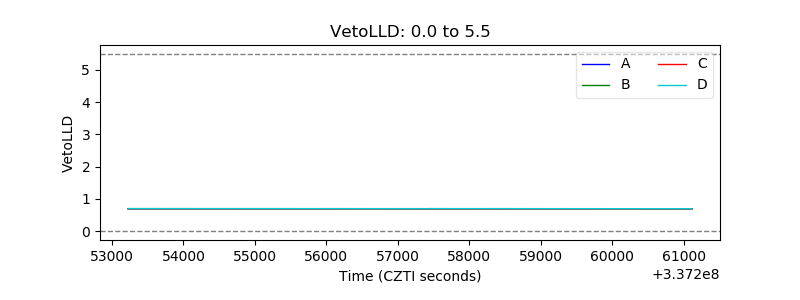 |
| Alpha Counter | 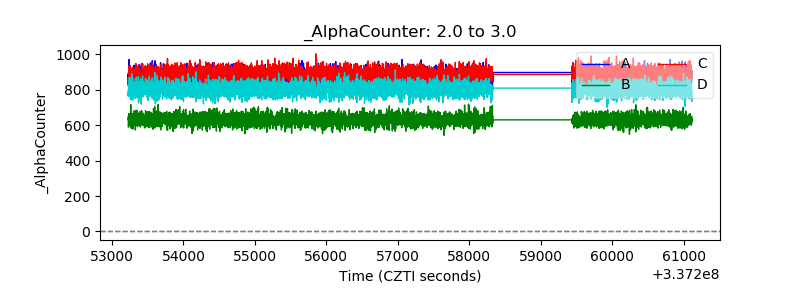 |
| _CPM_Rate | 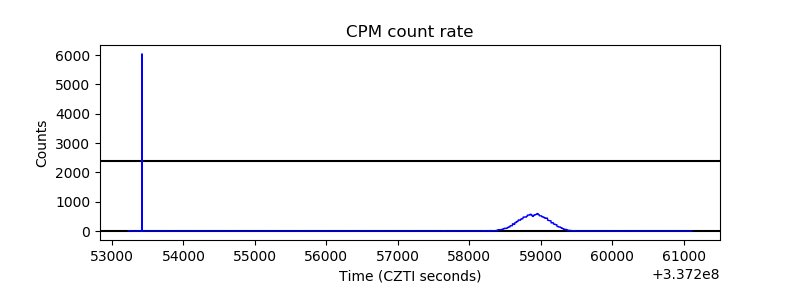 |
| CZT Counter | 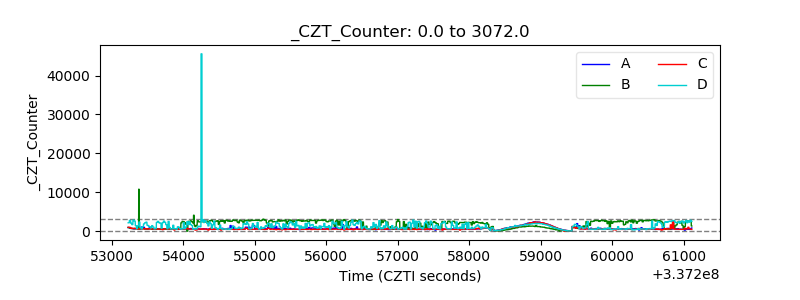 |
| +2.5 Volts monitor |  |
| +5 Volts monitor |  |
| _ROLL_ROT | 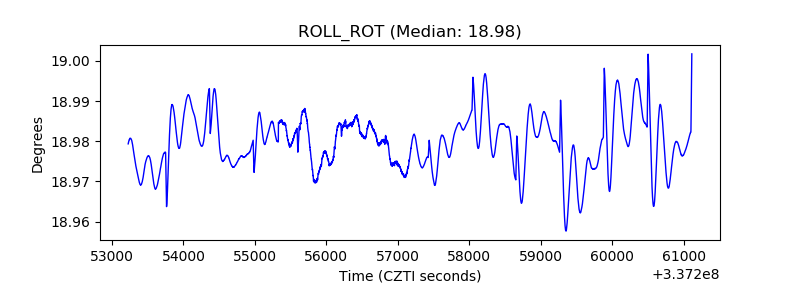 |
| _Roll_DEC | 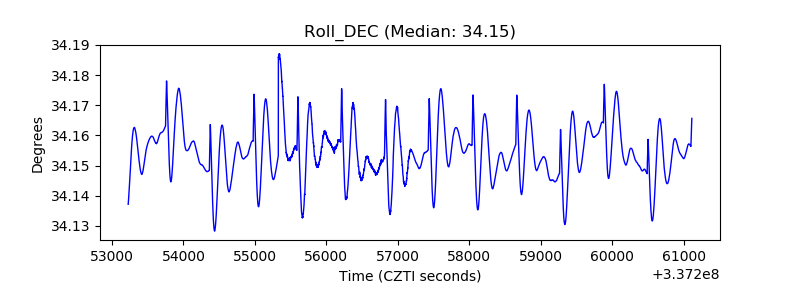 |
| _Roll_RA | 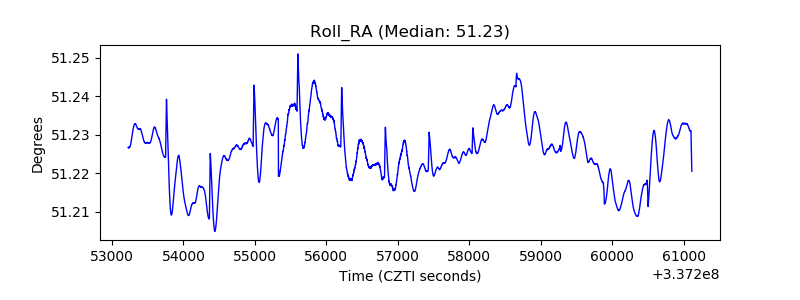 |
| Veto Counter | 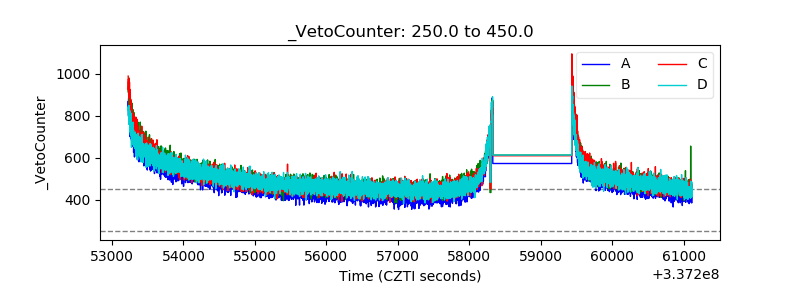 |