| Param | Original file | Final file |
|---|---|---|
| Filename | modeM0/AS1T03_223T01_9000003850_26752cztM0_level2.evt | modeM0/AS1T03_223T01_9000003850_26752cztM0_level2_quad_clean.evt |
| Size (bytes) | 833,114,880 | 65,957,760 |
| Size | 794.5 MB | 62.9 MB |
| Events in quadrant A | 3,667,929 | 418,239 |
| Events in quadrant B | 7,986,650 | 358,424 |
| Events in quadrant C | 3,522,970 | 408,268 |
| Events in quadrant D | 9,608,986 | 352,256 |
| Mode M9 | |||
|---|---|---|---|
| Quadrant | BADHDUFLAG | Total packets | Discarded packets |
| A | 0 | 9 | 0 |
| B | 0 | 9 | 0 |
| C | 0 | 9 | 0 |
| D | 0 | 9 | 0 |
| Mode M0 | |||
|---|---|---|---|
| Quadrant | BADHDUFLAG | Total packets | Discarded packets |
| A | 0 | 14929 | 0 |
| B | 0 | 27921 | 0 |
| C | 0 | 14278 | 0 |
| D | 0 | 33024 | 0 |
| Quadrant | Total seconds | Saturated seconds | Saturation percentage |
|---|---|---|---|
| A | 6587 | 107 | 1.624412% |
| B | 6587 | 2140 | 32.488234% |
| C | 6587 | 160 | 2.429027% |
| D | 6587 | 2376 | 36.071049% |
Noise dominated data is calculated using 1-second bins in cleaned event files. If a bin has >2000 counts, and if more than 50% of those come from <1% of pixels, then it is considered to be noise-dominated and hence unusable.
| Quadrant | # 1 sec bins | Bins with >0 counts | Bins with >2000 counts | High rate bins dominated by noise | Noise dominated (total time) | Noise dominated (detector-on time) | Marked lightcurve |
|---|---|---|---|---|---|---|---|
| A | 7427 | 6588 | 2 | 2 | 0.03% | 0.03% |  |
| B | 7427 | 6587 | 1677 | 1677 | 22.58% | 25.46% |  |
| C | 7427 | 6588 | 14 | 14 | 0.19% | 0.21% |  |
| D | 7427 | 6588 | 1821 | 1821 | 24.52% | 27.64% |  |
Top three noisy pixels from each quadrant. If the there are fewer than three noisy pixels in the level2.evt file, extra rows are filled as -1
| Pixel properties | Quadrant properties | ||||||
|---|---|---|---|---|---|---|---|
| Quadrant | DetID | PixID | Counts | Sigma | Mean | Median | Sigma |
| A | 0 | 13 | 409951 | 2410.56 | 844 | 828 | 169.7 |
| A | 13 | 254 | 11339 | 61.93 | 844 | 828 | 169.7 |
| A | 3 | 137 | 7806 | 41.11 | 844 | 828 | 169.7 |
| B | 0 | 189 | 5194196 | 39275.69 | 700 | 682 | 132.2 |
| B | 15 | 33 | 23517 | 172.68 | 700 | 682 | 132.2 |
| B | 12 | 111 | 15969 | 115.6 | 700 | 682 | 132.2 |
| C | 14 | 176 | 151691 | 806.94 | 799 | 803 | 187.0 |
| C | 14 | 238 | 128285 | 681.77 | 799 | 803 | 187.0 |
| C | 2 | 16 | 63715 | 336.45 | 799 | 803 | 187.0 |
| D | 7 | 80 | 5093399 | 29364.54 | 694 | 679 | 173.4 |
| D | 1 | 52 | 1095072 | 6310.25 | 694 | 679 | 173.4 |
| D | 13 | 168 | 278278 | 1600.63 | 694 | 679 | 173.4 |
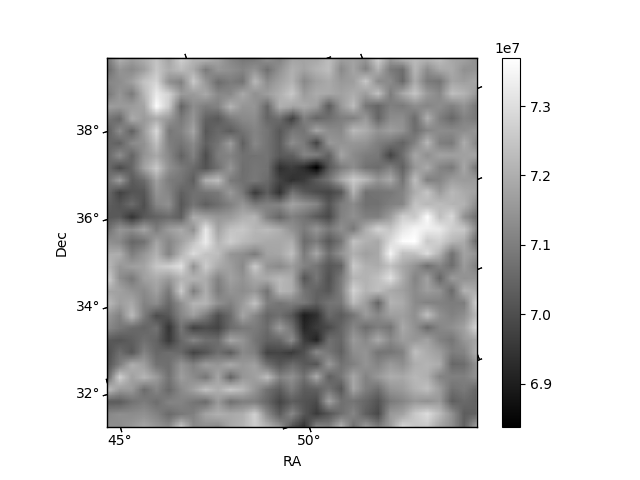
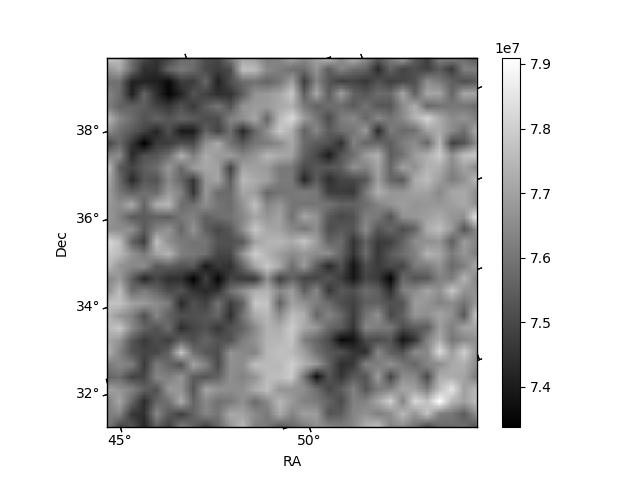
Histogram calculated using DETX and DETY for each event in the final _common_clean file
| Quadrant A | 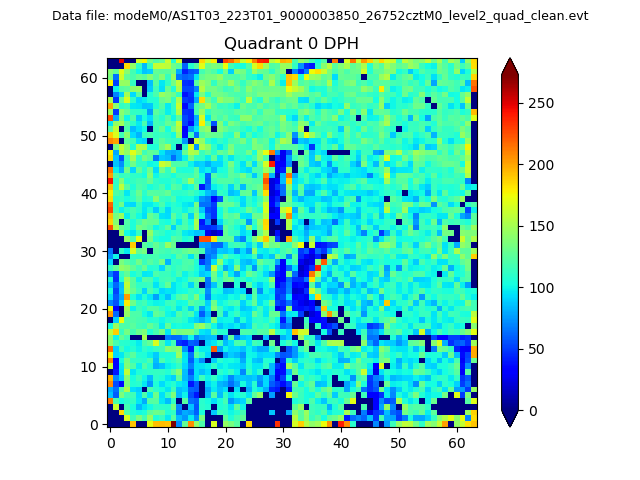 |
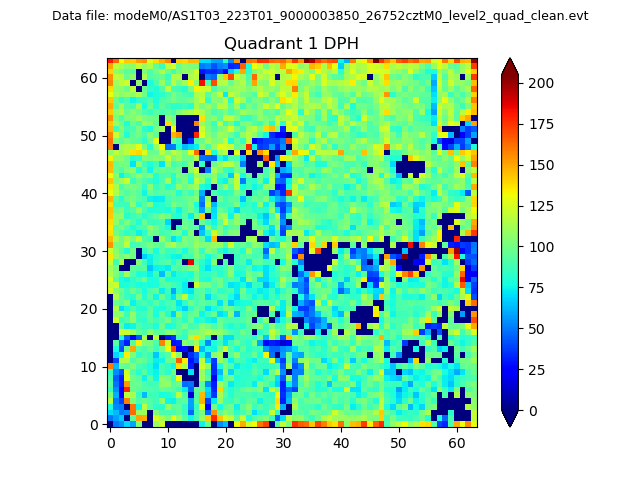 |
Quadrant B |
|---|---|---|---|
| Quadrant D | 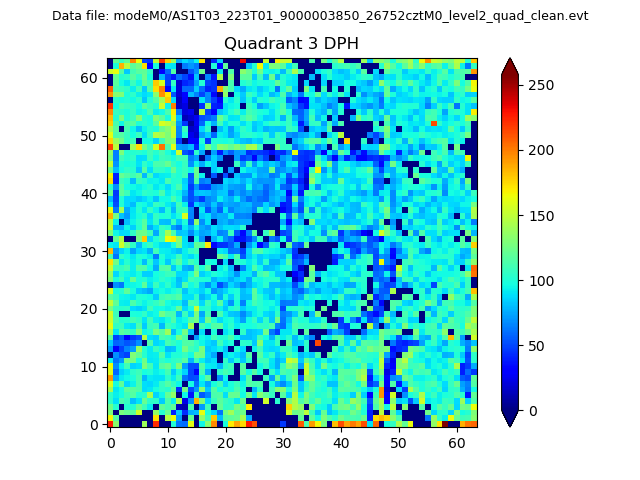 |
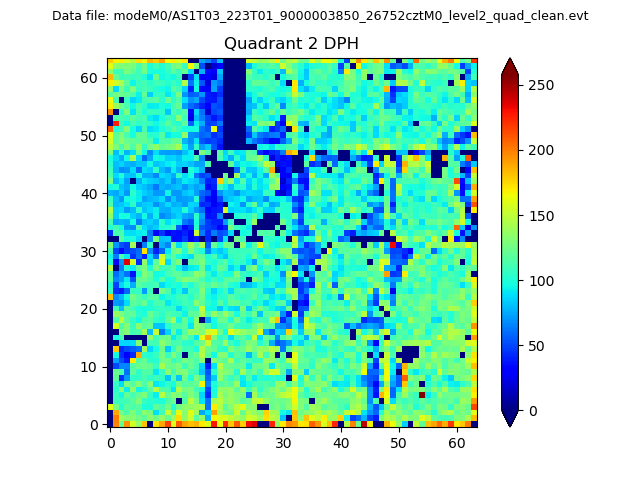 |
Quadrant C |
| Plot type | Count rate plots | Images |
|---|---|---|
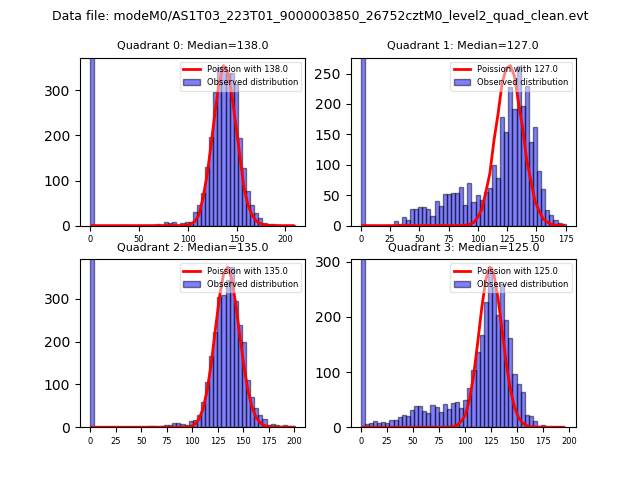
| Comparison with Poisson distribution Blue bars denote a histogram of data divided into 1 sec bins. Red curve is a Poisson curve with rate = median count rate of data. |
 |
 |
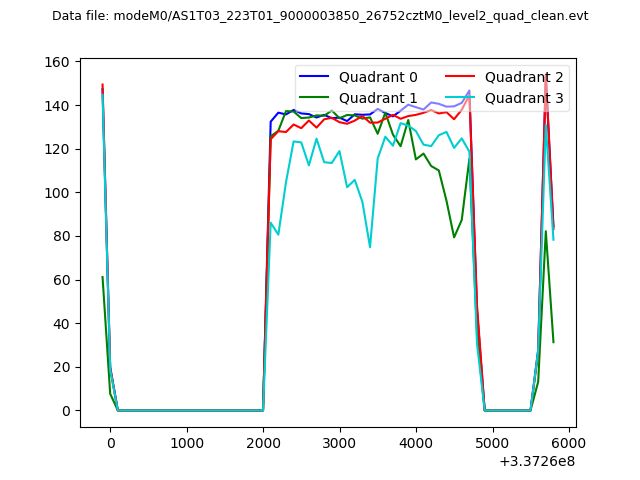
| Quadrant-wise count rates Data is divided into 100 sec bins |
 |
|
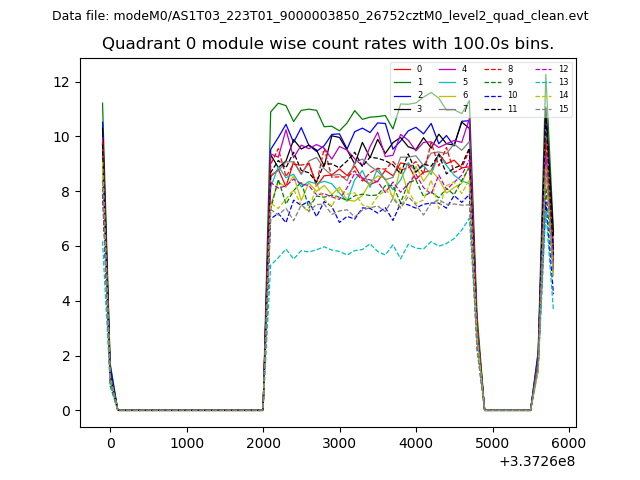
| Module-wise count rates for Quadrant A Data is divided into 100 sec bins |
 |
 |
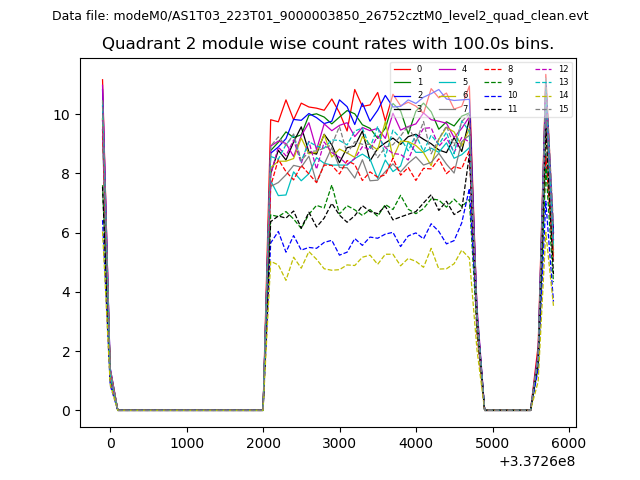
| Module-wise count rates for Quadrant B Data is divided into 100 sec bins |
 |
 |
| Module-wise count rates for Quadrant C Data is divided into 100 sec bins |
 |
 |
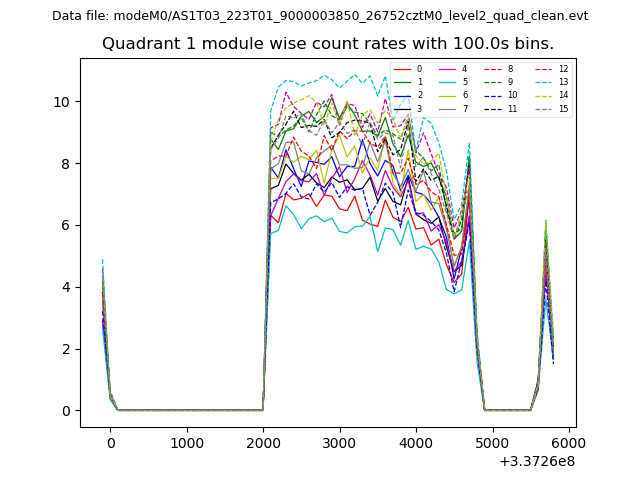
| Module-wise count rates for Quadrant D Data is divided into 100 sec bins |
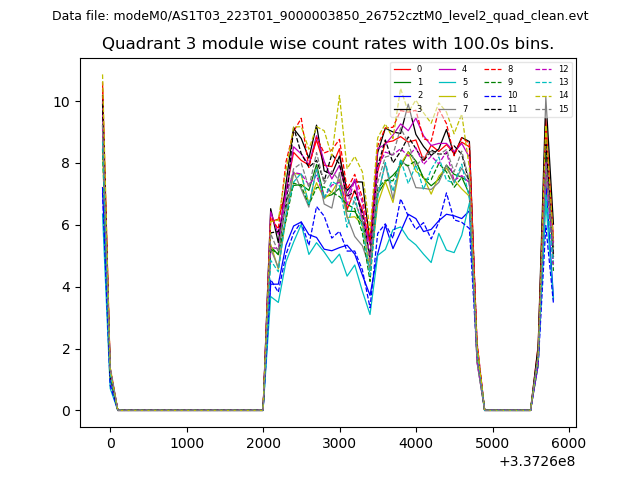 |
 |
| Parameter | Plot |
|---|---|
| CZT HV Monitor | 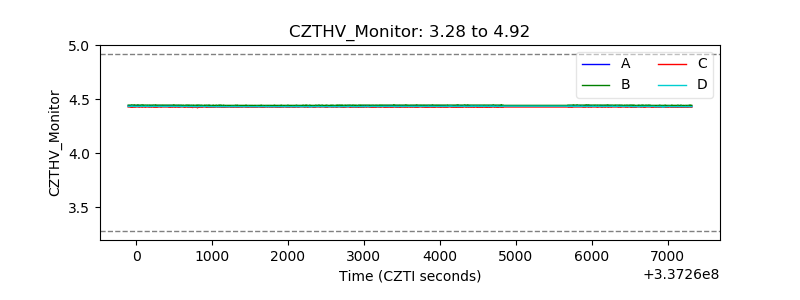 |
| D_VDD | 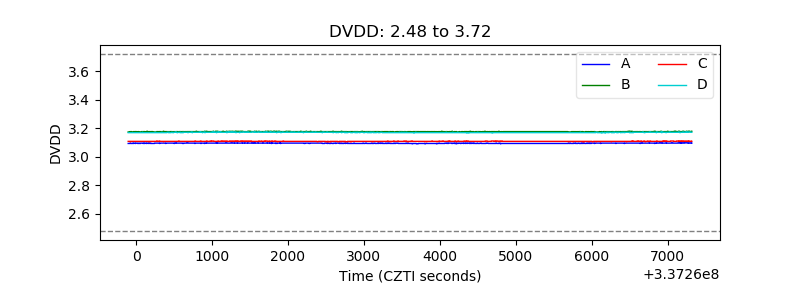 |
| Temperature 1 | 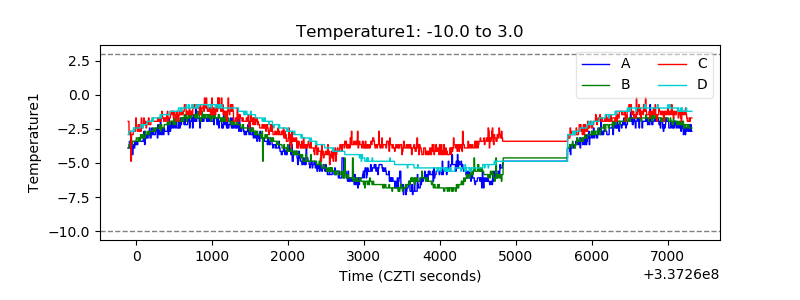 |
| Veto HV Monitor | 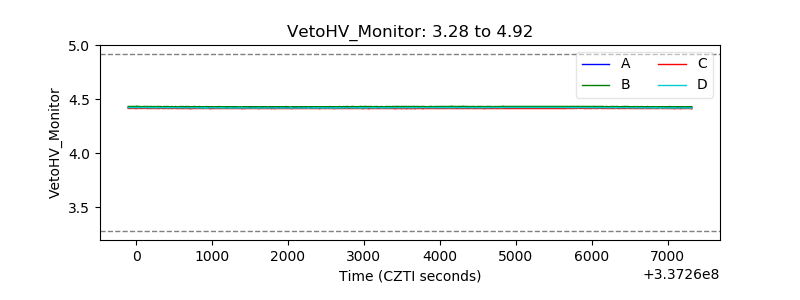 |
| Veto LLD | 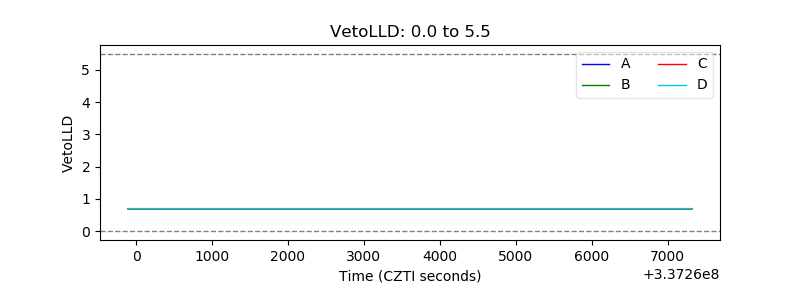 |
| Alpha Counter | 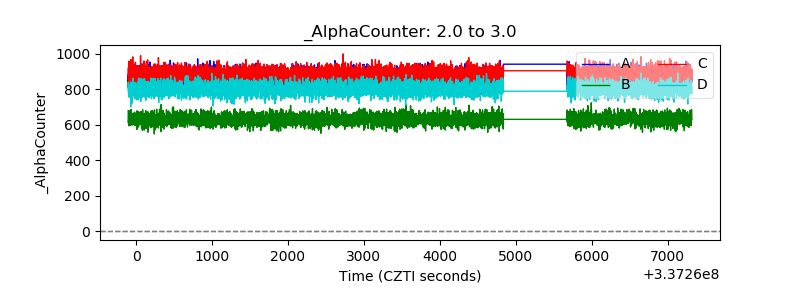 |
| _CPM_Rate | 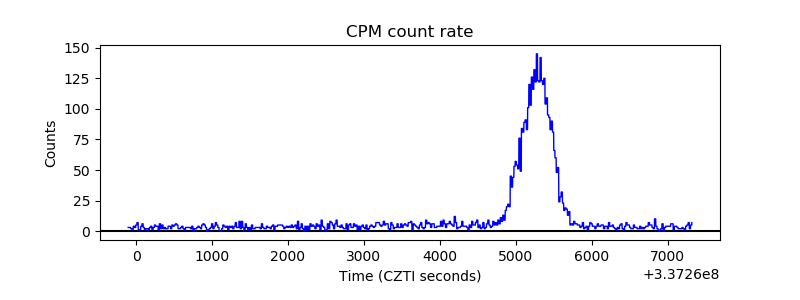 |
| CZT Counter | 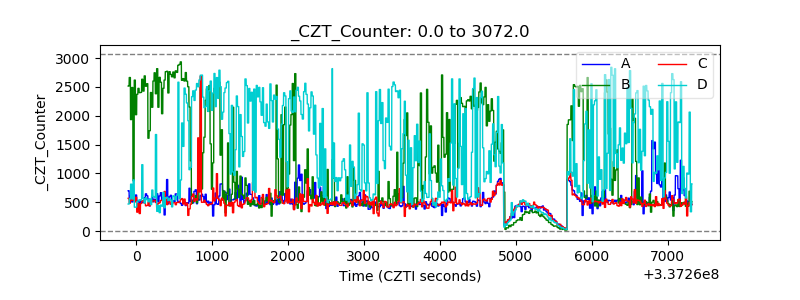 |
| +2.5 Volts monitor |  |
| +5 Volts monitor | 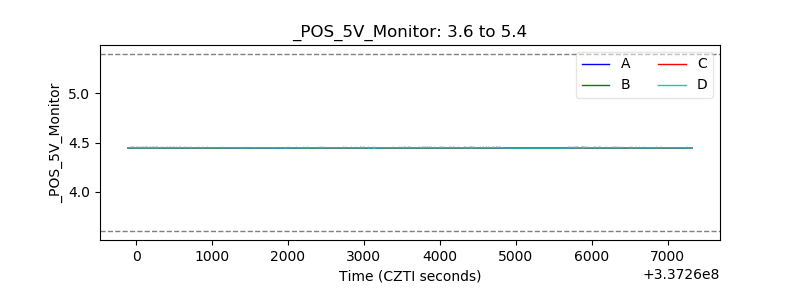 |
| _ROLL_ROT | 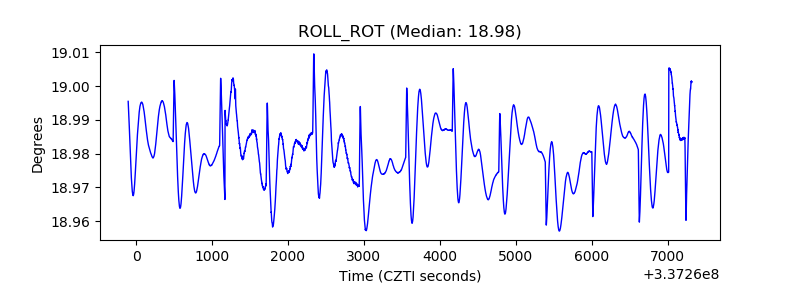 |
| _Roll_DEC | 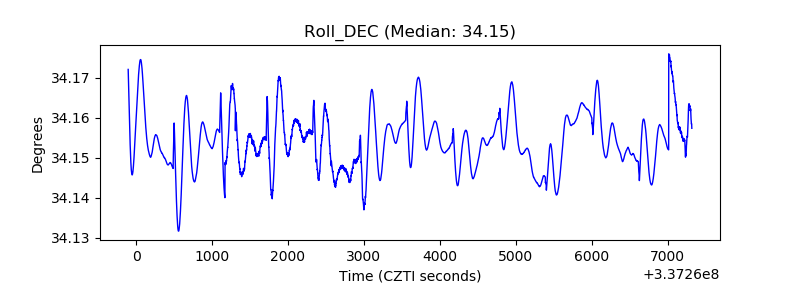 |
| _Roll_RA | 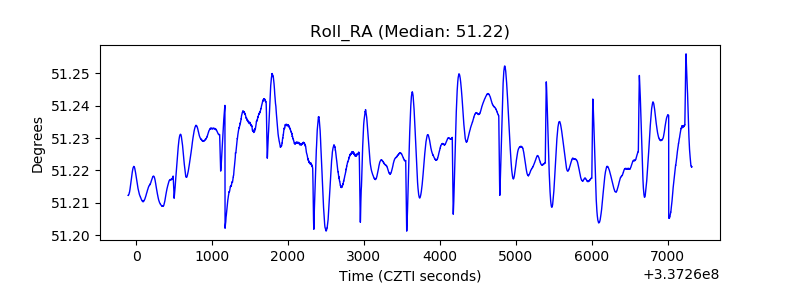 |
| Veto Counter | 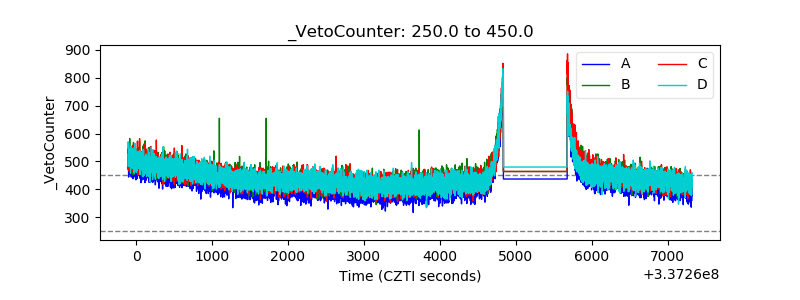 |