| Param | Original file | Final file |
|---|---|---|
| Filename | modeM0/AS1T03_223T01_9000003850_26753cztM0_level2.evt | modeM0/AS1T03_223T01_9000003850_26753cztM0_level2_quad_clean.evt |
| Size (bytes) | 878,472,000 | 72,115,200 |
| Size | 837.8 MB | 68.8 MB |
| Events in quadrant A | 4,587,455 | 454,911 |
| Events in quadrant B | 9,930,590 | 346,886 |
| Events in quadrant C | 3,615,066 | 450,407 |
| Events in quadrant D | 7,988,758 | 432,546 |
| Mode M9 | |||
|---|---|---|---|
| Quadrant | BADHDUFLAG | Total packets | Discarded packets |
| A | 0 | 5 | 0 |
| B | 0 | 5 | 0 |
| C | 0 | 5 | 0 |
| D | 0 | 5 | 0 |
| Mode M0 | |||
|---|---|---|---|
| Quadrant | BADHDUFLAG | Total packets | Discarded packets |
| A | 0 | 18193 | 0 |
| B | 0 | 34169 | 0 |
| C | 0 | 15147 | 0 |
| D | 0 | 28717 | 0 |
| Quadrant | Total seconds | Saturated seconds | Saturation percentage |
|---|---|---|---|
| A | 7157 | 170 | 2.375297% |
| B | 7157 | 2960 | 41.358111% |
| C | 7158 | 179 | 2.500699% |
| D | 7158 | 1253 | 17.504890% |
Noise dominated data is calculated using 1-second bins in cleaned event files. If a bin has >2000 counts, and if more than 50% of those come from <1% of pixels, then it is considered to be noise-dominated and hence unusable.
| Quadrant | # 1 sec bins | Bins with >0 counts | Bins with >2000 counts | High rate bins dominated by noise | Noise dominated (total time) | Noise dominated (detector-on time) | Marked lightcurve |
|---|---|---|---|---|---|---|---|
| A | 7602 | 7158 | 29 | 29 | 0.38% | 0.41% | 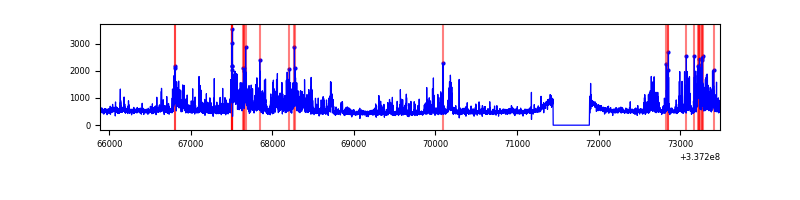 |
| B | 7601 | 7156 | 2646 | 2646 | 34.81% | 36.98% | 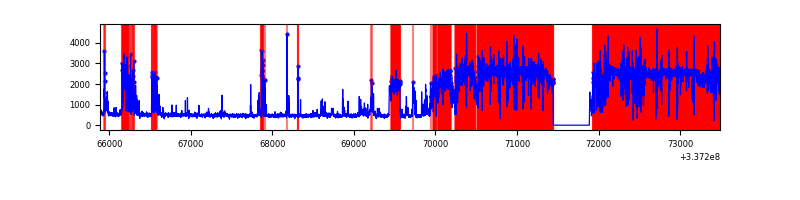 |
| C | 7603 | 7159 | 12 | 12 | 0.16% | 0.17% | 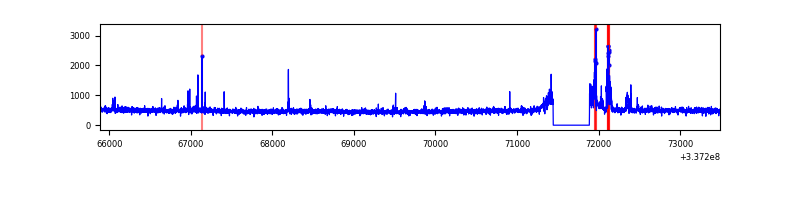 |
| D | 7603 | 7159 | 923 | 923 | 12.14% | 12.89% | 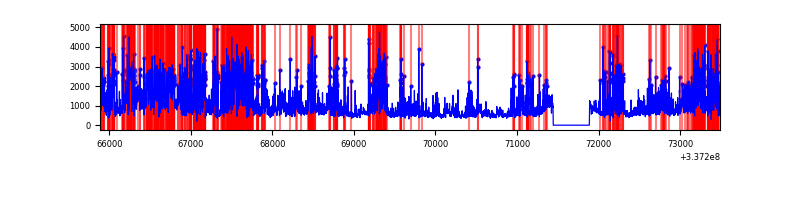 |
Top three noisy pixels from each quadrant. If the there are fewer than three noisy pixels in the level2.evt file, extra rows are filled as -1
| Pixel properties | Quadrant properties | ||||||
|---|---|---|---|---|---|---|---|
| Quadrant | DetID | PixID | Counts | Sigma | Mean | Median | Sigma |
| A | 0 | 13 | 1125086 | 6264.91 | 895 | 877 | 179.4 |
| A | 13 | 254 | 10991 | 56.36 | 895 | 877 | 179.4 |
| A | 3 | 137 | 8625 | 43.18 | 895 | 877 | 179.4 |
| B | 0 | 189 | 7412512 | 60564.44 | 640 | 623 | 122.4 |
| B | 12 | 111 | 14435 | 112.86 | 640 | 623 | 122.4 |
| B | 11 | 111 | 13032 | 101.4 | 640 | 623 | 122.4 |
| C | 14 | 238 | 135550 | 675.36 | 850 | 854 | 199.4 |
| C | 2 | 16 | 95236 | 473.22 | 850 | 854 | 199.4 |
| C | 10 | 22 | 51804 | 255.46 | 850 | 854 | 199.4 |
| D | 7 | 80 | 3490469 | 16888.69 | 804 | 786 | 206.6 |
| D | 1 | 52 | 937234 | 4532.04 | 804 | 786 | 206.6 |
| D | 12 | 227 | 207075 | 998.36 | 804 | 786 | 206.6 |
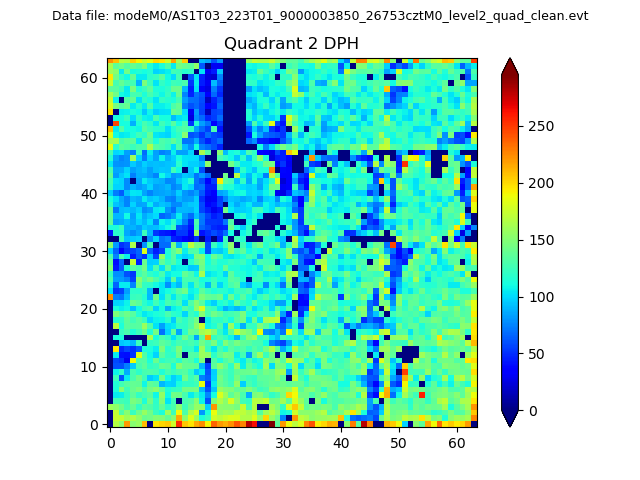
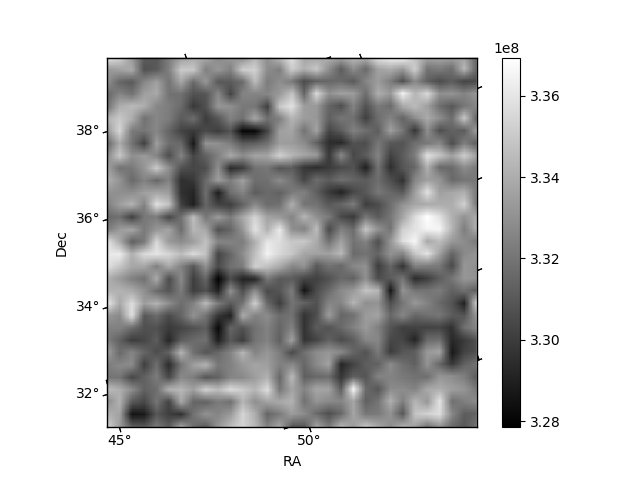
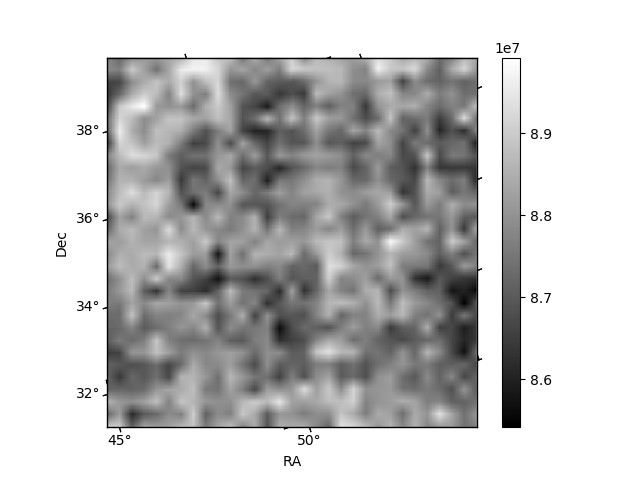
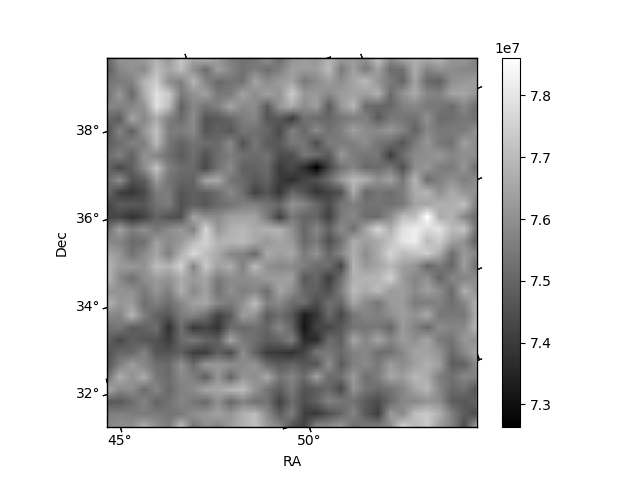
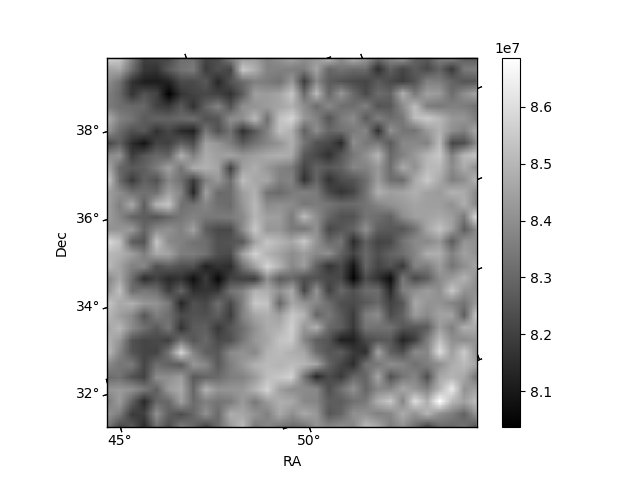
Histogram calculated using DETX and DETY for each event in the final _common_clean file
| Quadrant A | 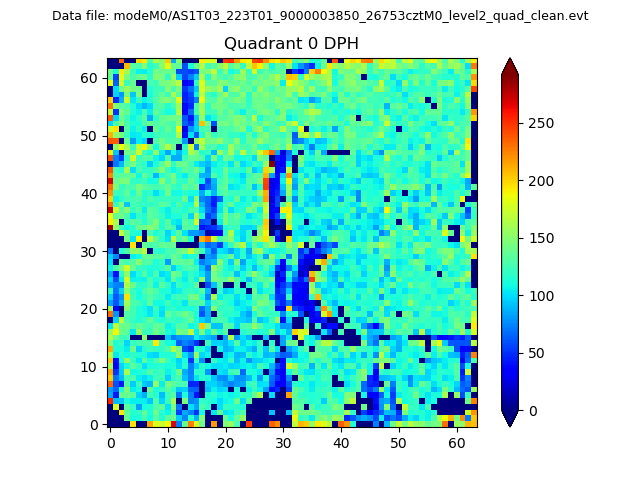 |
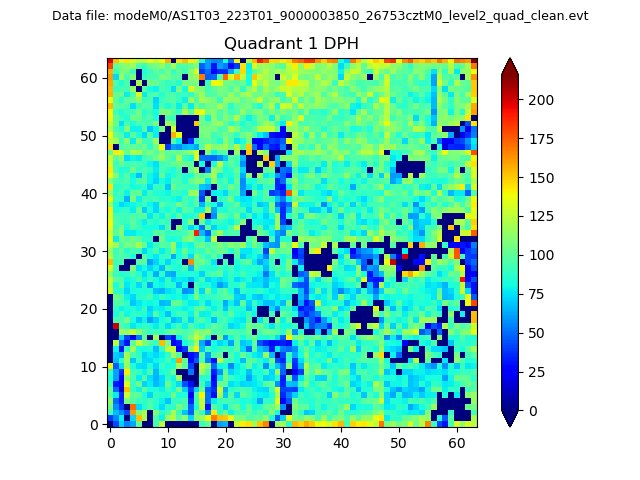 |
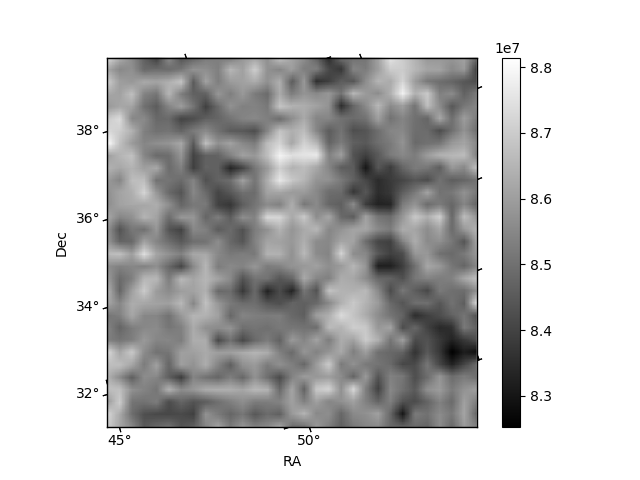
Quadrant B |
|---|---|---|---|
| Quadrant D | 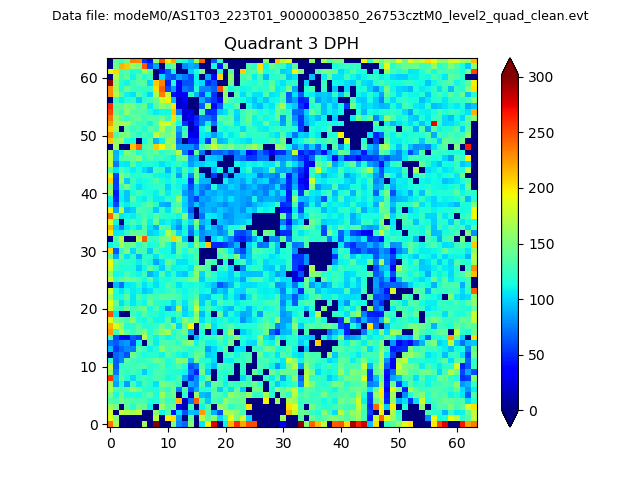 |
 |
Quadrant C |
| Plot type | Count rate plots | Images |
|---|---|---|
| Comparison with Poisson distribution Blue bars denote a histogram of data divided into 1 sec bins. Red curve is a Poisson curve with rate = median count rate of data. |
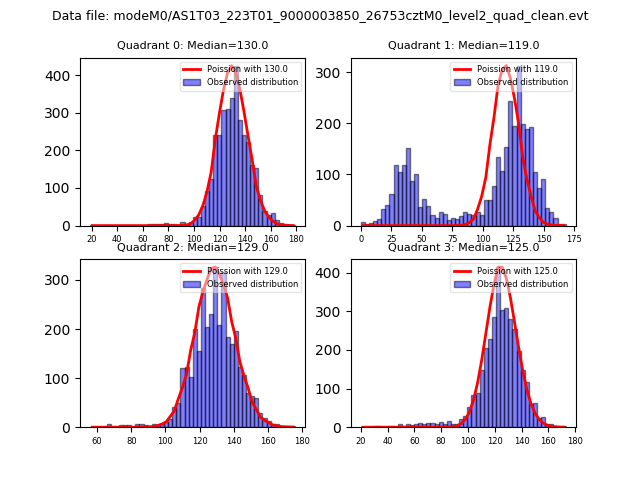 |
 |
| Quadrant-wise count rates Data is divided into 100 sec bins |
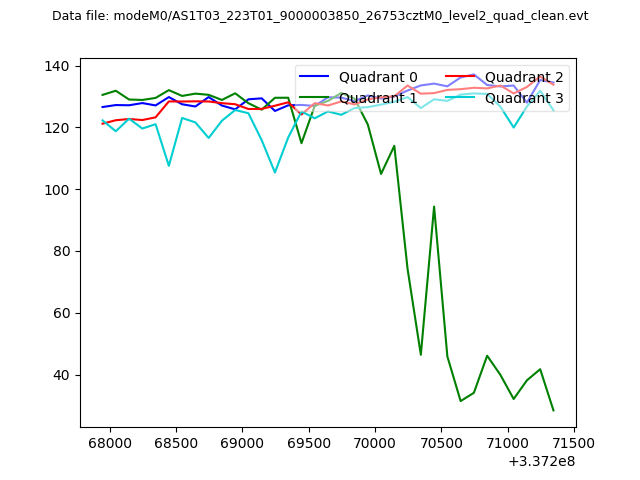 |
|
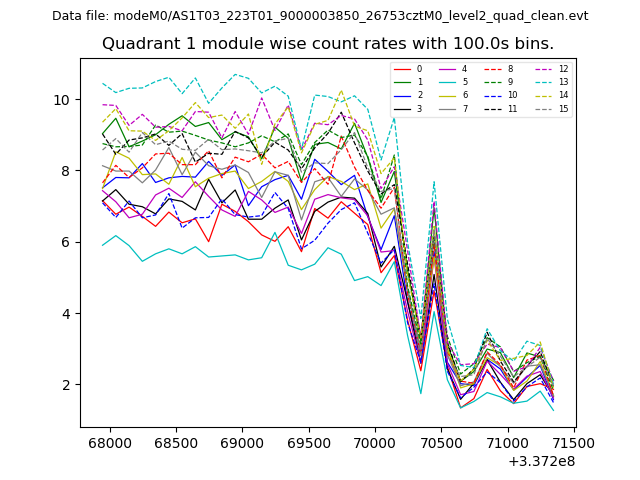
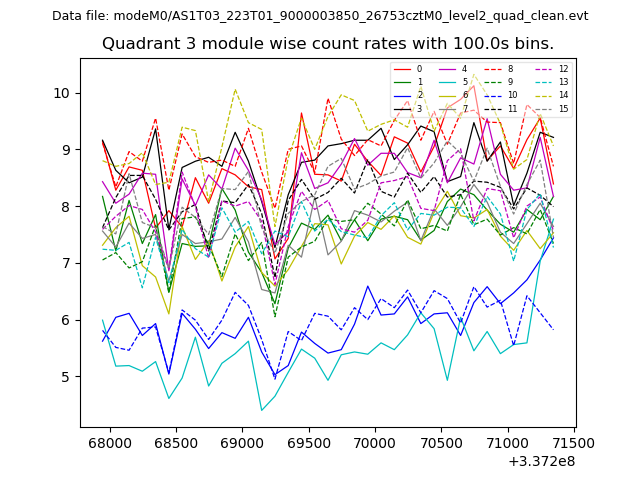
| Module-wise count rates for Quadrant A Data is divided into 100 sec bins |
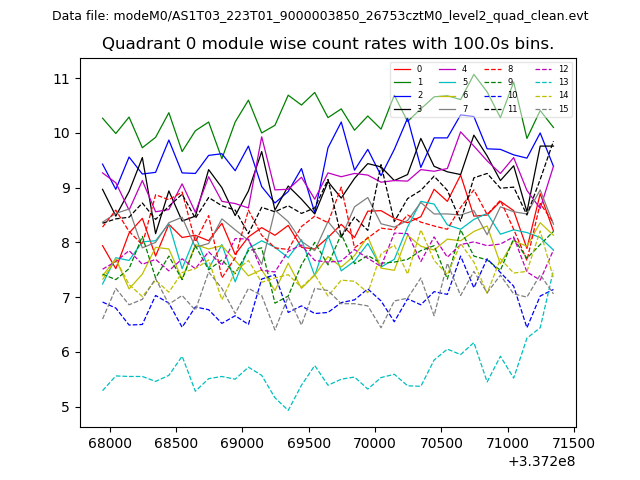 |
 |
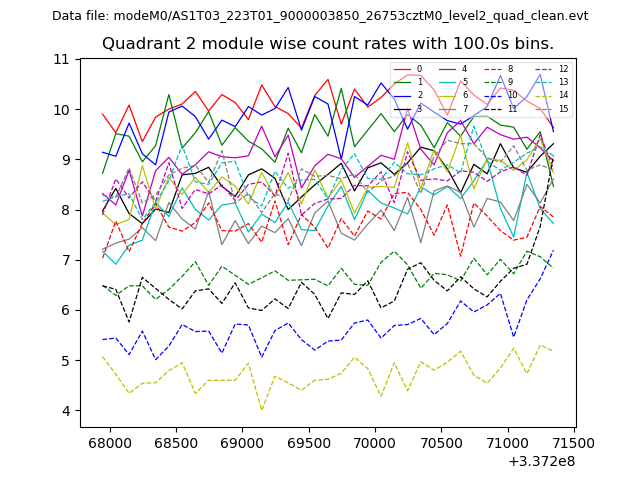
| Module-wise count rates for Quadrant B Data is divided into 100 sec bins |
 |
 |
| Module-wise count rates for Quadrant C Data is divided into 100 sec bins |
 |
 |
| Module-wise count rates for Quadrant D Data is divided into 100 sec bins |
 |
 |
| Parameter | Plot |
|---|---|
| CZT HV Monitor |  |
| D_VDD | 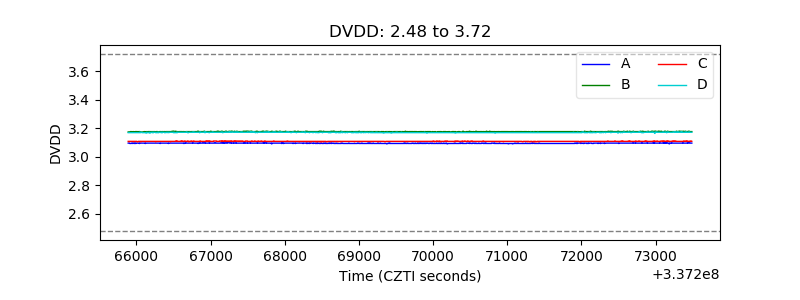 |
| Temperature 1 | 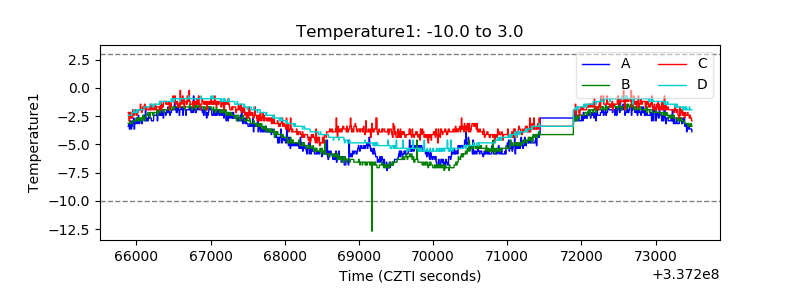 |
| Veto HV Monitor | 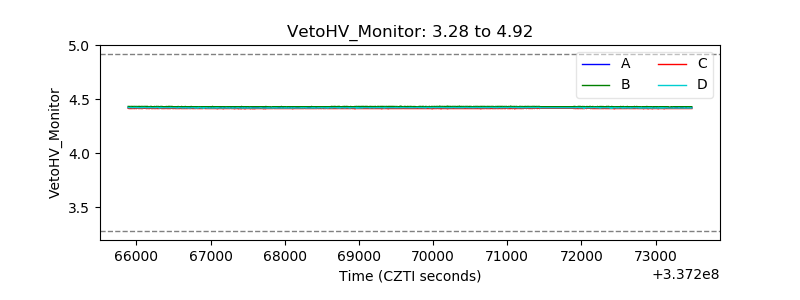 |
| Veto LLD | 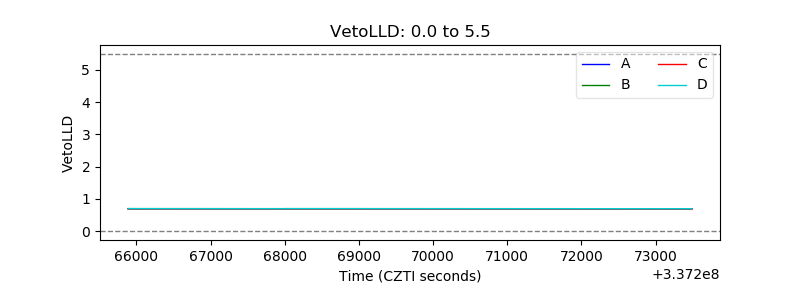 |
| Alpha Counter | 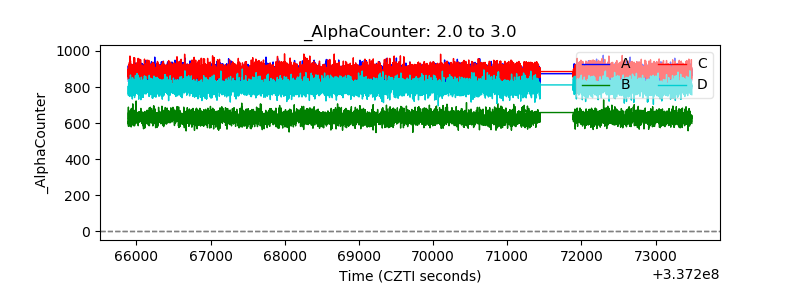 |
| _CPM_Rate | 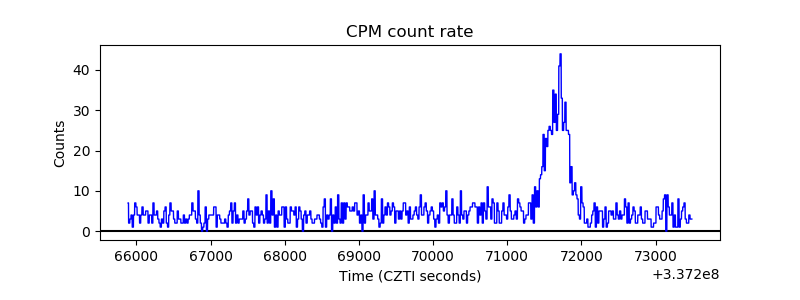 |
| CZT Counter | 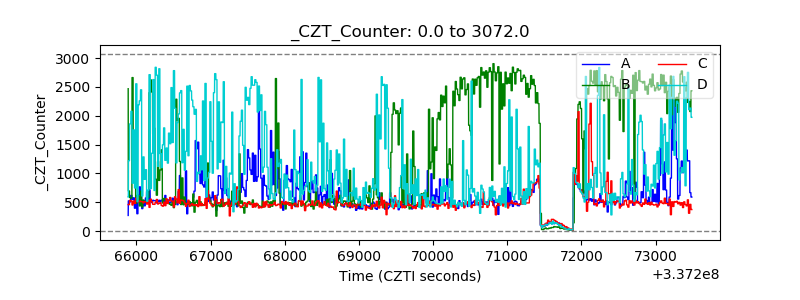 |
| +2.5 Volts monitor |  |
| +5 Volts monitor |  |
| _ROLL_ROT | 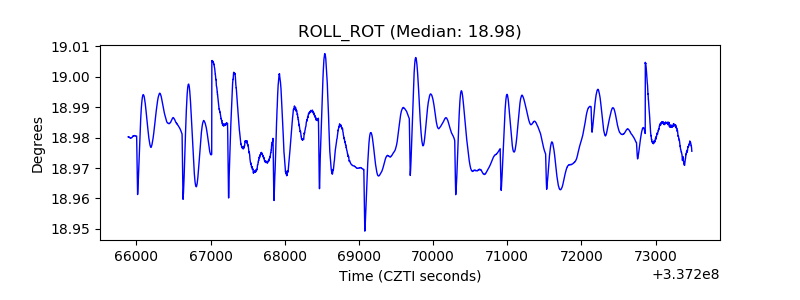 |
| _Roll_DEC | 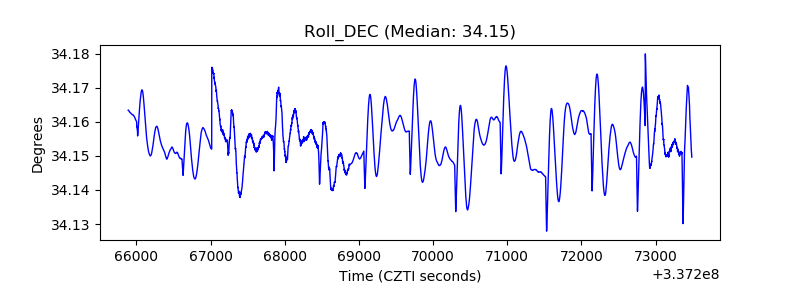 |
| _Roll_RA | 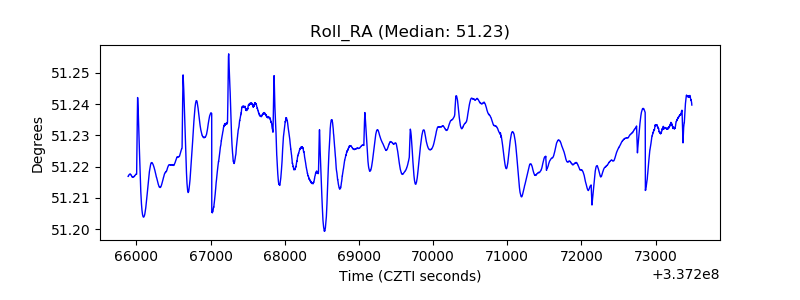 |
| Veto Counter | 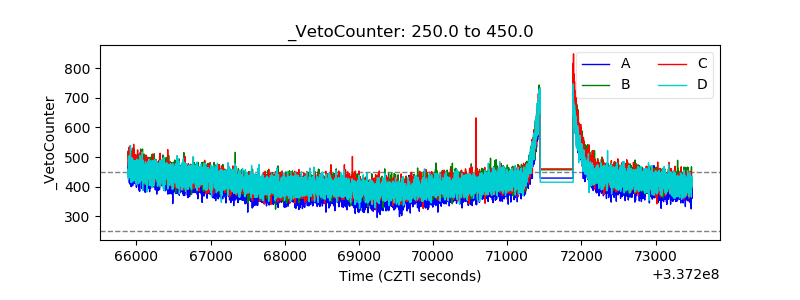 |