| Param | Original file | Final file |
|---|---|---|
| Filename | modeM0/AS1T03_223T01_9000003850_26754cztM0_level2.evt | modeM0/AS1T03_223T01_9000003850_26754cztM0_level2_quad_clean.evt |
| Size (bytes) | 1,051,606,080 | 67,026,240 |
| Size | 1002.9 MB | 63.9 MB |
| Events in quadrant A | 4,505,445 | 482,286 |
| Events in quadrant B | 16,618,537 | 102,691 |
| Events in quadrant C | 3,545,044 | 477,502 |
| Events in quadrant D | 6,688,706 | 459,034 |
| Mode M9 | |||
|---|---|---|---|
| Quadrant | BADHDUFLAG | Total packets | Discarded packets |
| A | 0 | 3 | 0 |
| B | 0 | 3 | 0 |
| C | 0 | 3 | 0 |
| D | 0 | 3 | 0 |
| Mode M0 | |||
|---|---|---|---|
| Quadrant | BADHDUFLAG | Total packets | Discarded packets |
| A | 0 | 18118 | 0 |
| B | 0 | 54282 | 0 |
| C | 0 | 15029 | 0 |
| D | 0 | 24982 | 0 |
| Quadrant | Total seconds | Saturated seconds | Saturation percentage |
|---|---|---|---|
| A | 7267 | 212 | 2.917297% |
| B | 7266 | 6206 | 85.411506% |
| C | 7266 | 123 | 1.692816% |
| D | 7266 | 1001 | 13.776493% |
Noise dominated data is calculated using 1-second bins in cleaned event files. If a bin has >2000 counts, and if more than 50% of those come from <1% of pixels, then it is considered to be noise-dominated and hence unusable.
| Quadrant | # 1 sec bins | Bins with >0 counts | Bins with >2000 counts | High rate bins dominated by noise | Noise dominated (total time) | Noise dominated (detector-on time) | Marked lightcurve |
|---|---|---|---|---|---|---|---|
| A | 7537 | 7268 | 38 | 38 | 0.50% | 0.52% | 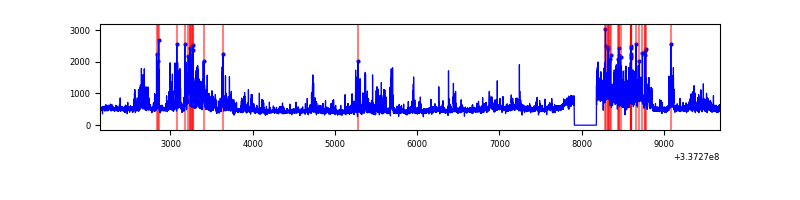 |
| B | 7535 | 7265 | 5787 | 5787 | 76.80% | 79.66% | 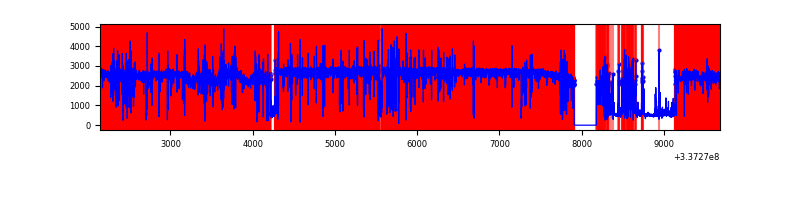 |
| C | 7536 | 7267 | 1 | 1 | 0.01% | 0.01% | 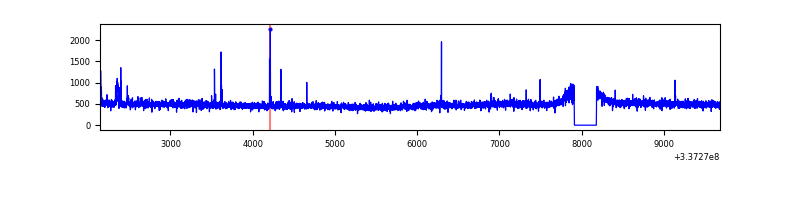 |
| D | 7536 | 7267 | 683 | 683 | 9.06% | 9.40% | 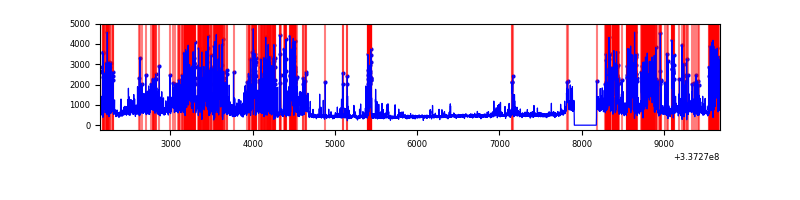 |
Top three noisy pixels from each quadrant. If the there are fewer than three noisy pixels in the level2.evt file, extra rows are filled as -1
| Pixel properties | Quadrant properties | ||||||
|---|---|---|---|---|---|---|---|
| Quadrant | DetID | PixID | Counts | Sigma | Mean | Median | Sigma |
| A | 0 | 13 | 1041810 | 5749.12 | 895 | 876 | 181.1 |
| A | 13 | 254 | 11510 | 58.73 | 895 | 876 | 181.1 |
| A | 3 | 137 | 8611 | 42.72 | 895 | 876 | 181.1 |
| B | 0 | 189 | 15397075 | 257571.91 | 307 | 299 | 59.8 |
| B | 10 | 246 | 14100 | 230.88 | 307 | 299 | 59.8 |
| B | 12 | 111 | 6725 | 107.5 | 307 | 299 | 59.8 |
| C | 14 | 238 | 136489 | 676.68 | 858 | 860 | 200.4 |
| C | 2 | 16 | 46877 | 229.59 | 858 | 860 | 200.4 |
| C | 10 | 22 | 8859 | 39.91 | 858 | 860 | 200.4 |
| D | 7 | 80 | 2376720 | 11160.98 | 820 | 800 | 212.9 |
| D | 1 | 52 | 775969 | 3641.39 | 820 | 800 | 212.9 |
| D | 2 | 250 | 274772 | 1286.99 | 820 | 800 | 212.9 |
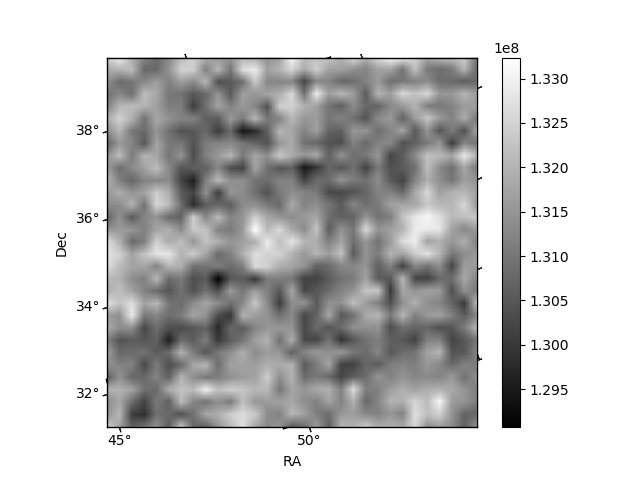
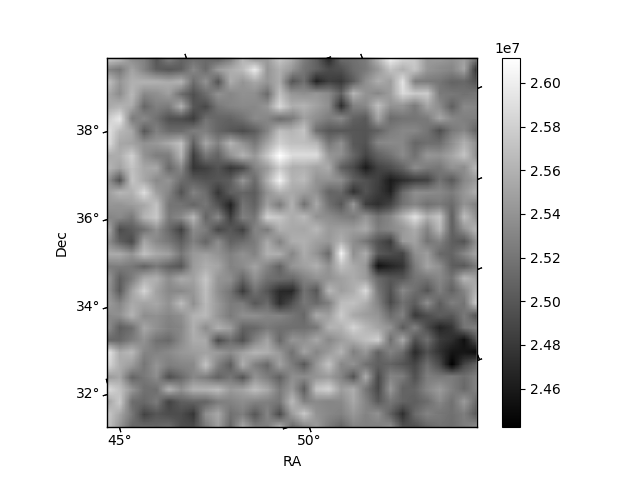
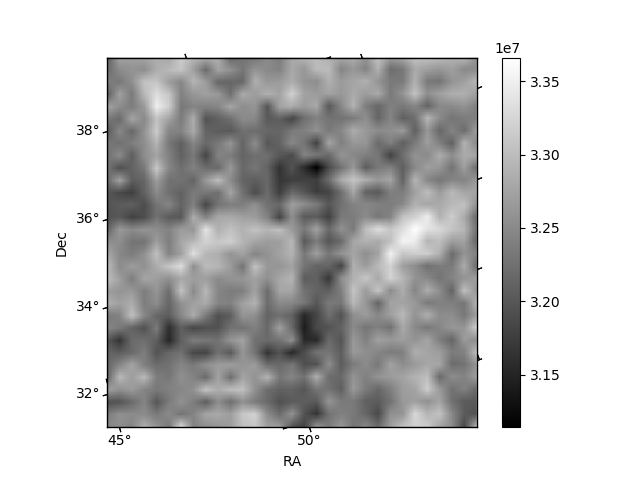
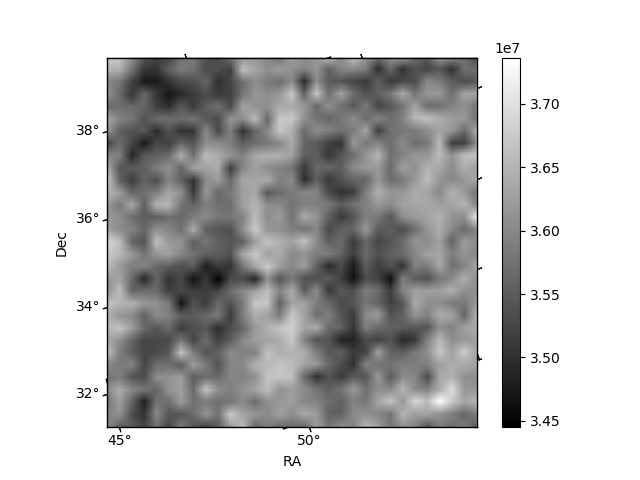
Histogram calculated using DETX and DETY for each event in the final _common_clean file
| Quadrant A | 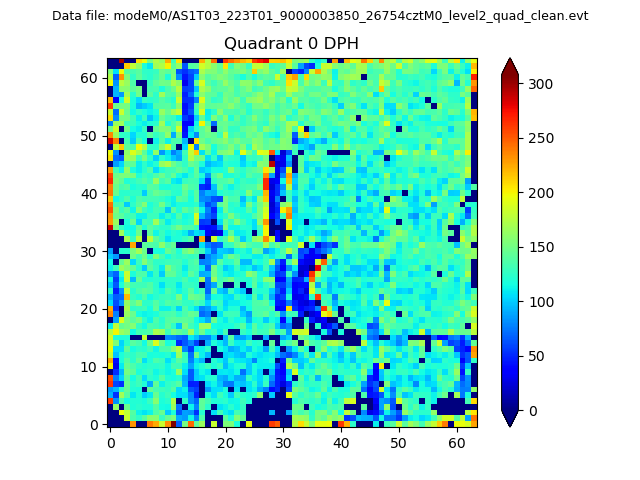 |
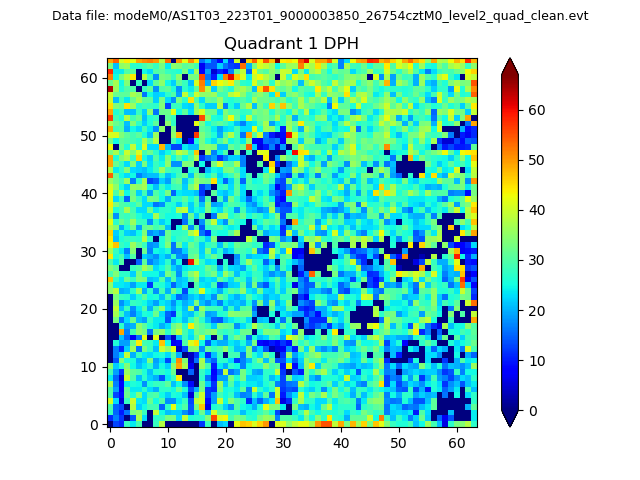 |
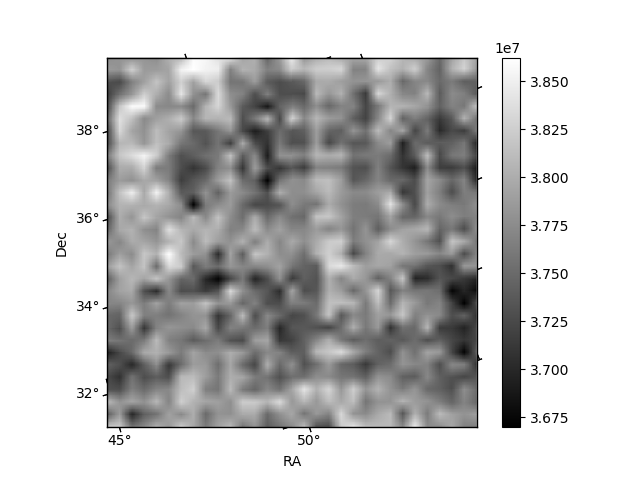
Quadrant B |
|---|---|---|---|
| Quadrant D | 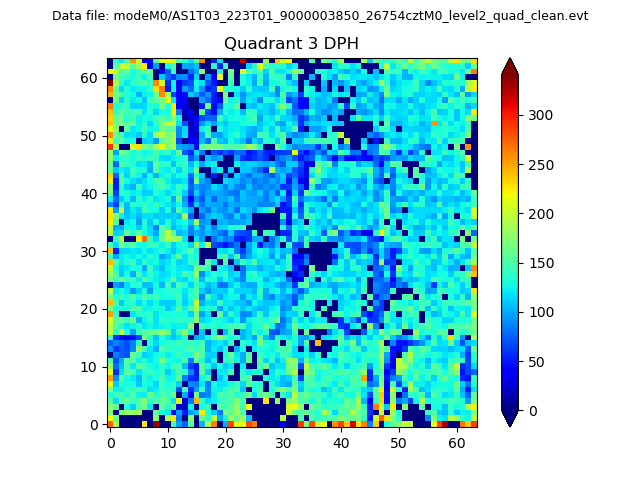 |
 |
Quadrant C |
| Plot type | Count rate plots | Images |
|---|---|---|
| Comparison with Poisson distribution Blue bars denote a histogram of data divided into 1 sec bins. Red curve is a Poisson curve with rate = median count rate of data. |
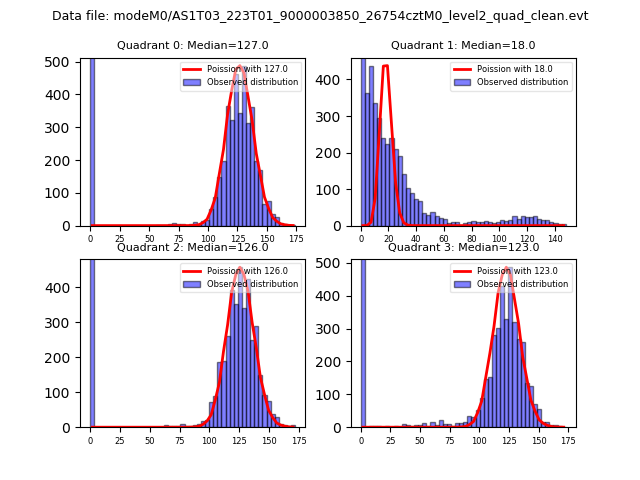 |
 |
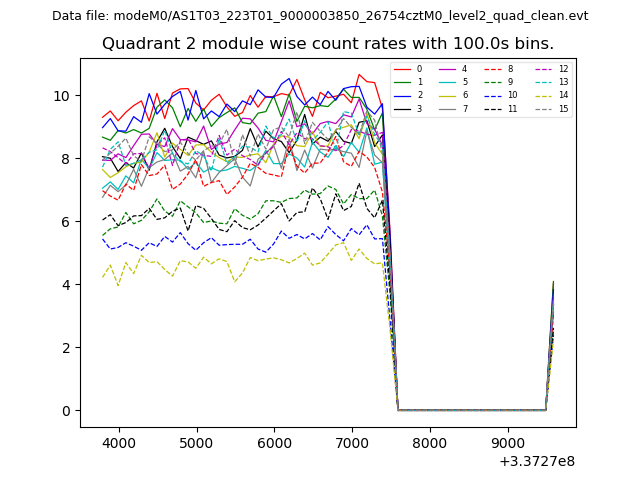
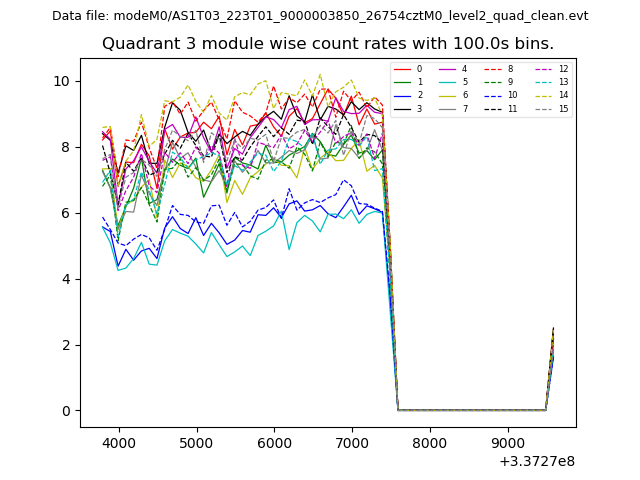
| Quadrant-wise count rates Data is divided into 100 sec bins |
 |
|
| Module-wise count rates for Quadrant A Data is divided into 100 sec bins |
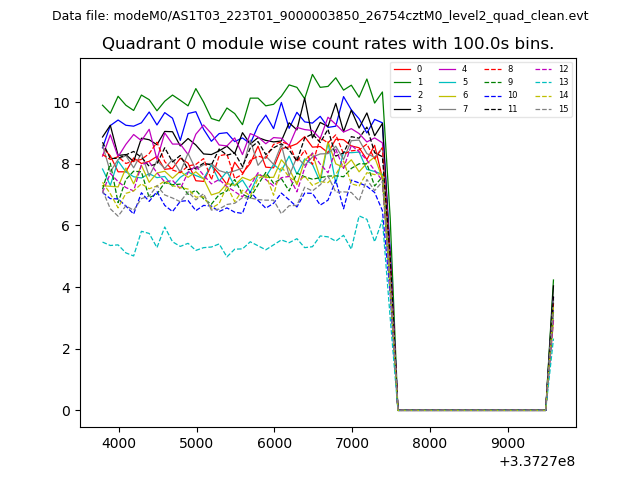 |
 |
| Module-wise count rates for Quadrant B Data is divided into 100 sec bins |
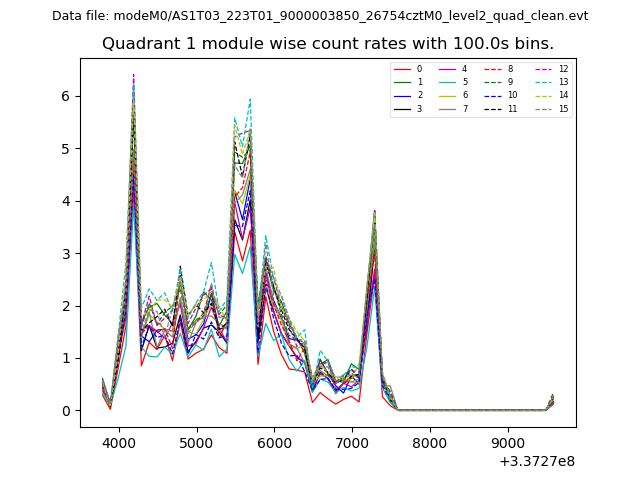 |
 |
| Module-wise count rates for Quadrant C Data is divided into 100 sec bins |
 |
 |
| Module-wise count rates for Quadrant D Data is divided into 100 sec bins |
 |
 |
| Parameter | Plot |
|---|---|
| CZT HV Monitor | 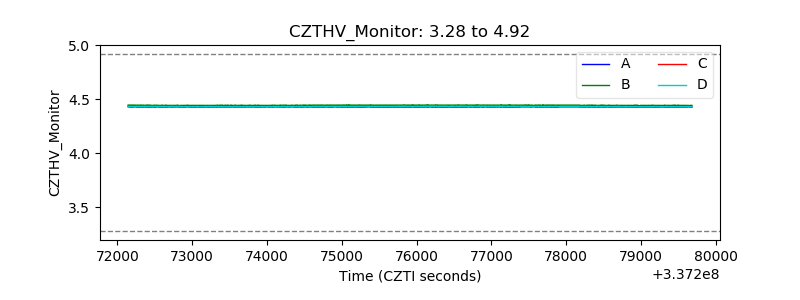 |
| D_VDD | 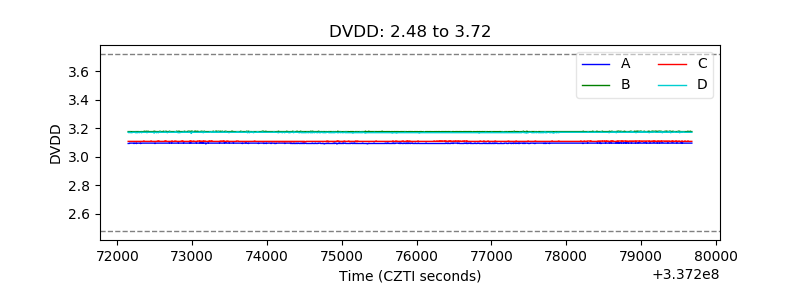 |
| Temperature 1 | 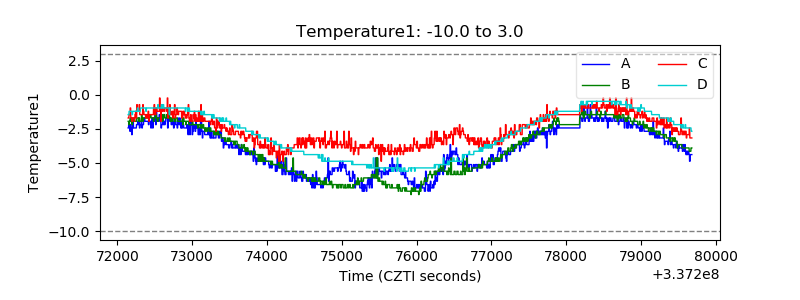 |
| Veto HV Monitor |  |
| Veto LLD | 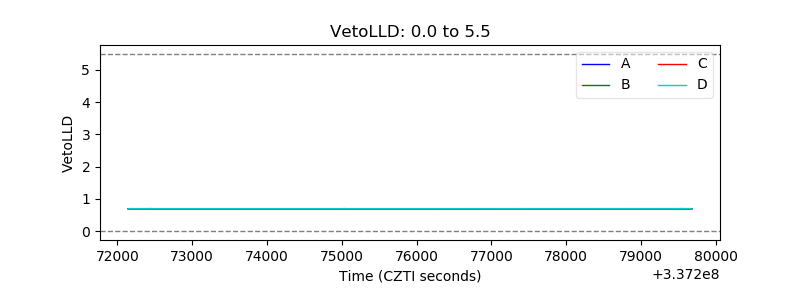 |
| Alpha Counter | 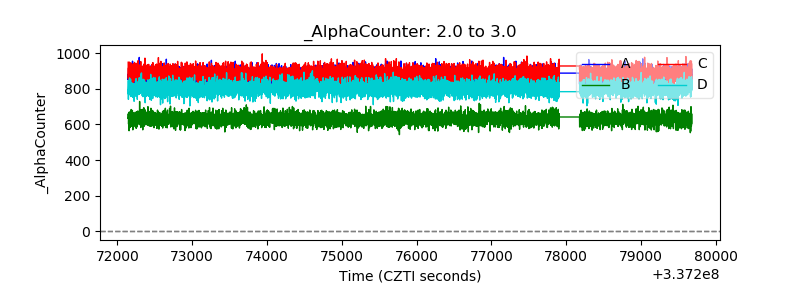 |
| _CPM_Rate |  |
| CZT Counter | 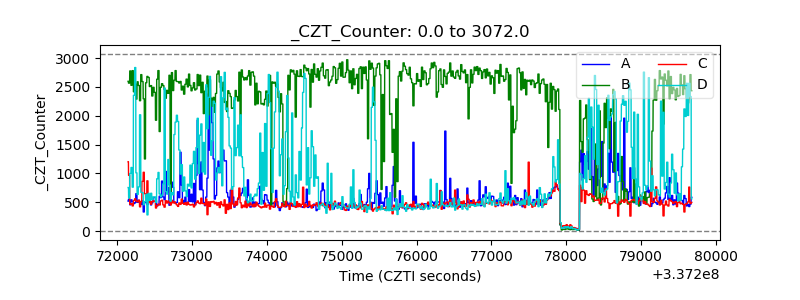 |
| +2.5 Volts monitor | 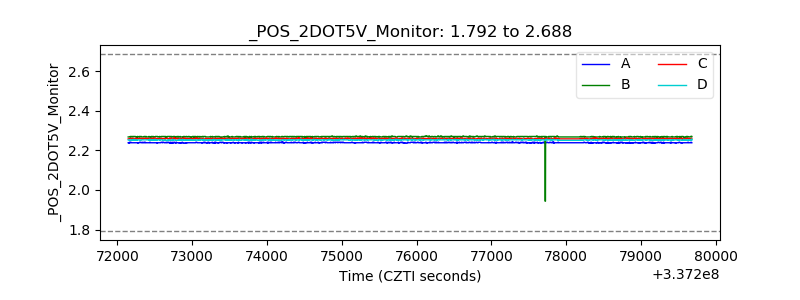 |
| +5 Volts monitor |  |
| _ROLL_ROT | 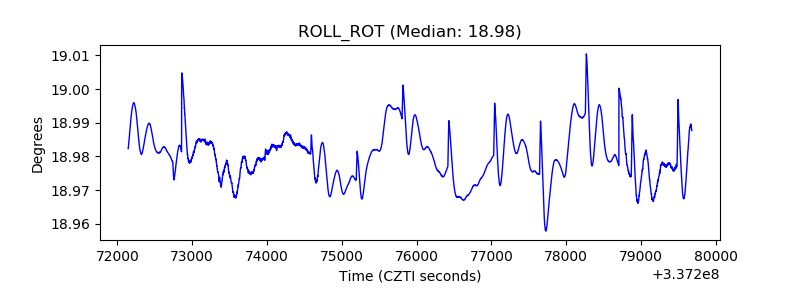 |
| _Roll_DEC | 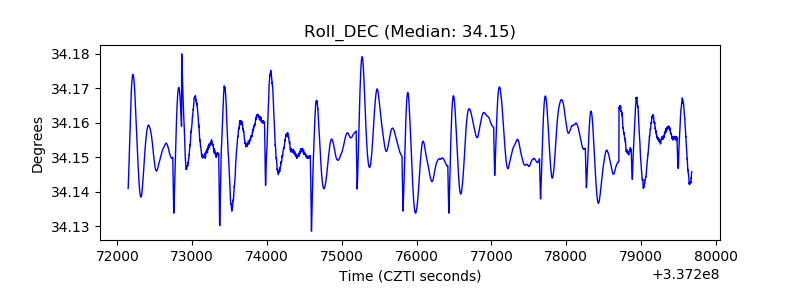 |
| _Roll_RA | 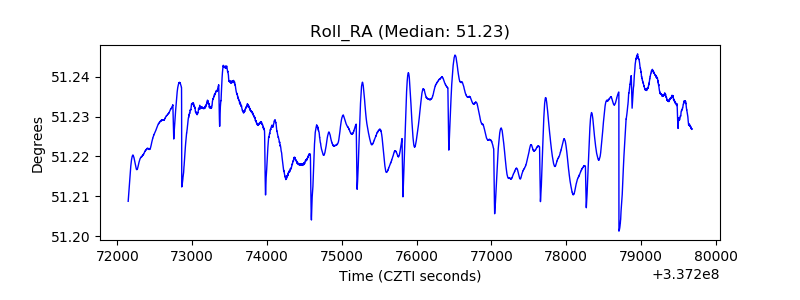 |
| Veto Counter | 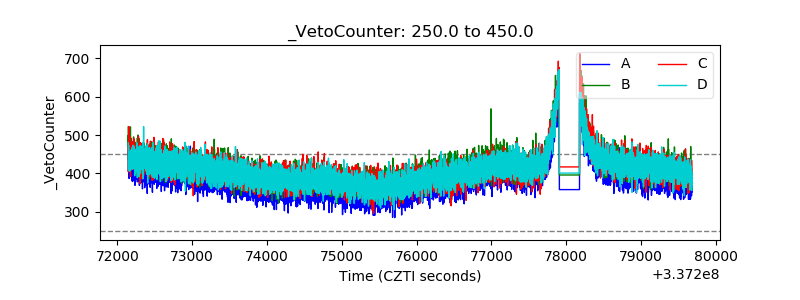 |