| Param | Original file | Final file |
|---|---|---|
| Filename | modeM0/AS1T03_223T01_9000003850_26755cztM0_level2.evt | modeM0/AS1T03_223T01_9000003850_26755cztM0_level2_quad_clean.evt |
| Size (bytes) | 980,352,000 | 69,543,360 |
| Size | 934.9 MB | 66.3 MB |
| Events in quadrant A | 4,680,746 | 519,126 |
| Events in quadrant B | 13,081,171 | 198,245 |
| Events in quadrant C | 3,323,738 | 516,956 |
| Events in quadrant D | 8,182,723 | 432,063 |
| Mode M9 | |||
|---|---|---|---|
| Quadrant | BADHDUFLAG | Total packets | Discarded packets |
| A | 0 | 8 | 4 |
| B | 0 | 16 | 12 |
| C | 0 | 5 | 1 |
| D | 0 | 8 | 4 |
| Mode M0 | |||
|---|---|---|---|
| Quadrant | BADHDUFLAG | Total packets | Discarded packets |
| A | 0 | 18336 | 0 |
| B | 0 | 43085 | 0 |
| C | 0 | 14095 | 0 |
| D | 0 | 28884 | 0 |
| Quadrant | Total seconds | Saturated seconds | Saturation percentage |
|---|---|---|---|
| A | 6712 | 190 | 2.830751% |
| B | 6376 | 4731 | 74.200125% |
| C | 6723 | 134 | 1.993158% |
| D | 6553 | 1811 | 27.636197% |
Noise dominated data is calculated using 1-second bins in cleaned event files. If a bin has >2000 counts, and if more than 50% of those come from <1% of pixels, then it is considered to be noise-dominated and hence unusable.
| Quadrant | # 1 sec bins | Bins with >0 counts | Bins with >2000 counts | High rate bins dominated by noise | Noise dominated (total time) | Noise dominated (detector-on time) | Marked lightcurve |
|---|---|---|---|---|---|---|---|
| A | 7290 | 6882 | 83 | 83 | 1.14% | 1.21% | 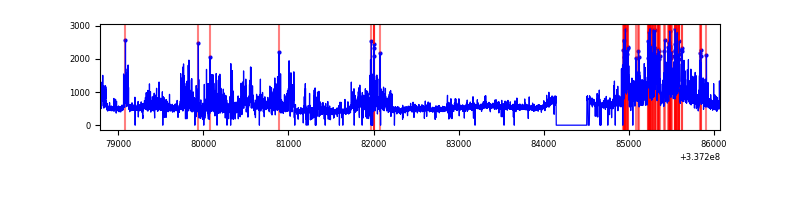 |
| B | 7291 | 6521 | 4254 | 4254 | 58.35% | 65.24% | 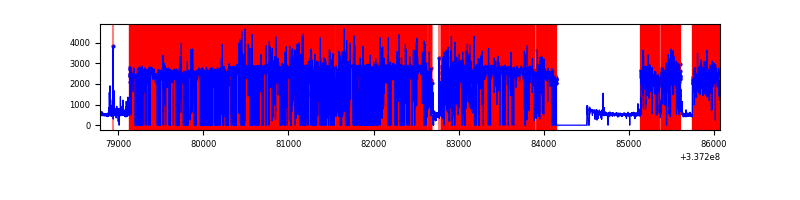 |
| C | 7291 | 6887 | 21 | 21 | 0.29% | 0.30% | 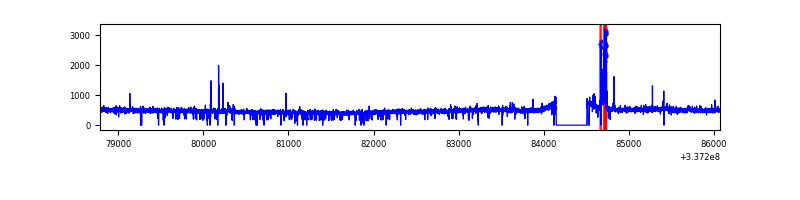 |
| D | 7290 | 6805 | 1246 | 1246 | 17.09% | 18.31% | 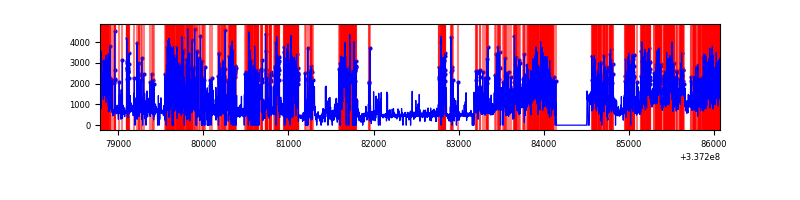 |
Top three noisy pixels from each quadrant. If the there are fewer than three noisy pixels in the level2.evt file, extra rows are filled as -1
| Pixel properties | Quadrant properties | ||||||
|---|---|---|---|---|---|---|---|
| Quadrant | DetID | PixID | Counts | Sigma | Mean | Median | Sigma |
| A | 0 | 13 | 1527531 | 9262.8 | 813 | 795 | 164.8 |
| A | 13 | 254 | 11690 | 66.1 | 813 | 795 | 164.8 |
| A | 3 | 137 | 7761 | 42.26 | 813 | 795 | 164.8 |
| B | 0 | 189 | 11480059 | 144580.76 | 406 | 395 | 79.4 |
| B | 12 | 111 | 9231 | 111.29 | 406 | 395 | 79.4 |
| B | 11 | 111 | 8248 | 98.9 | 406 | 395 | 79.4 |
| C | 14 | 238 | 123664 | 665.94 | 784 | 787 | 184.5 |
| C | 2 | 16 | 103787 | 558.22 | 784 | 787 | 184.5 |
| C | 3 | 233 | 19734 | 102.68 | 784 | 787 | 184.5 |
| D | 7 | 80 | 4404293 | 24367.84 | 687 | 670 | 180.7 |
| D | 1 | 52 | 572165 | 3162.42 | 687 | 670 | 180.7 |
| D | 12 | 227 | 174730 | 963.18 | 687 | 670 | 180.7 |
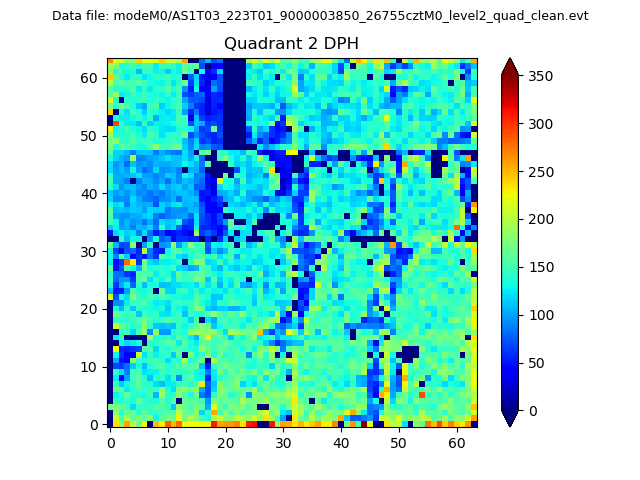
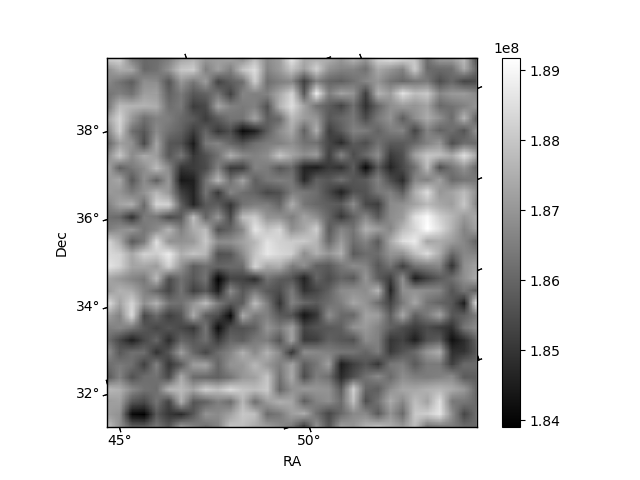
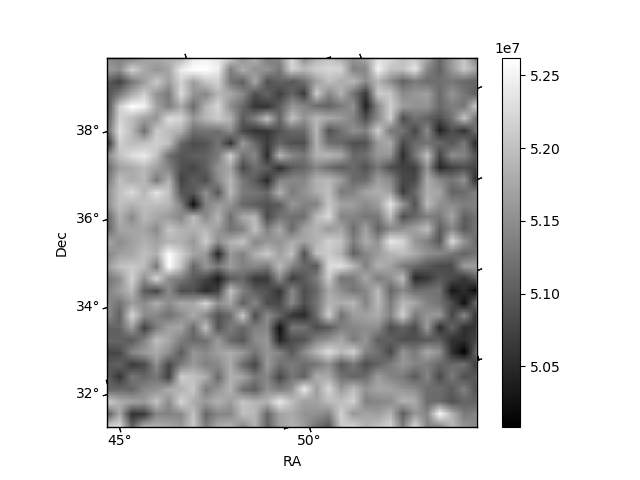
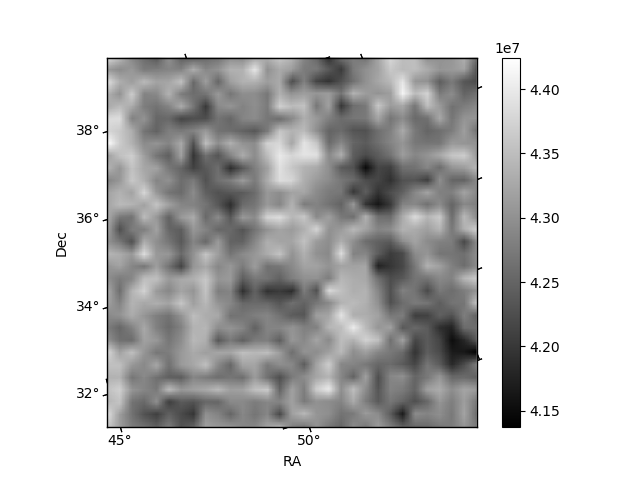
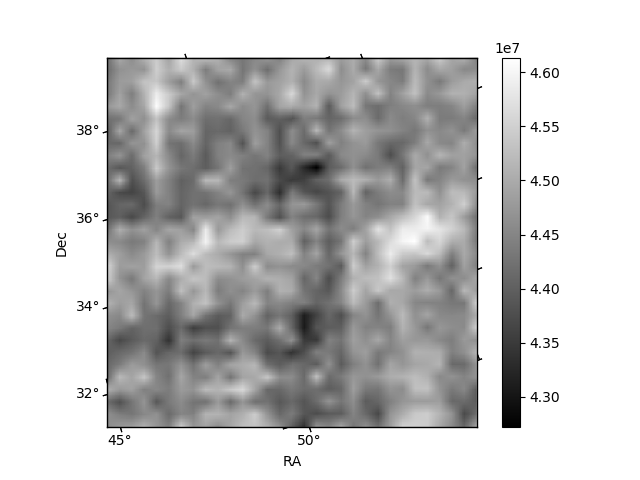
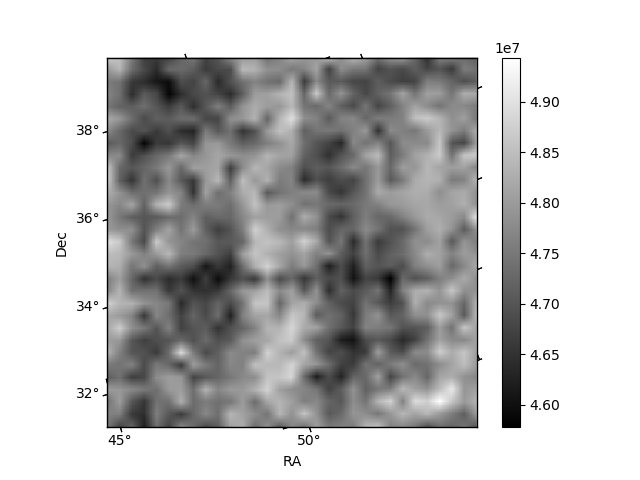
Histogram calculated using DETX and DETY for each event in the final _common_clean file
| Quadrant A | 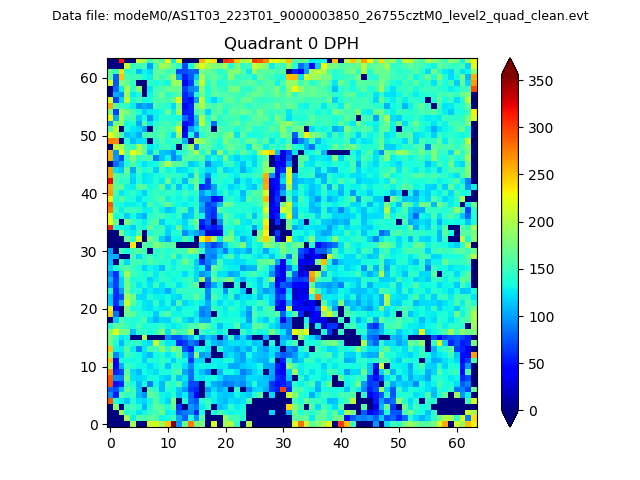 |
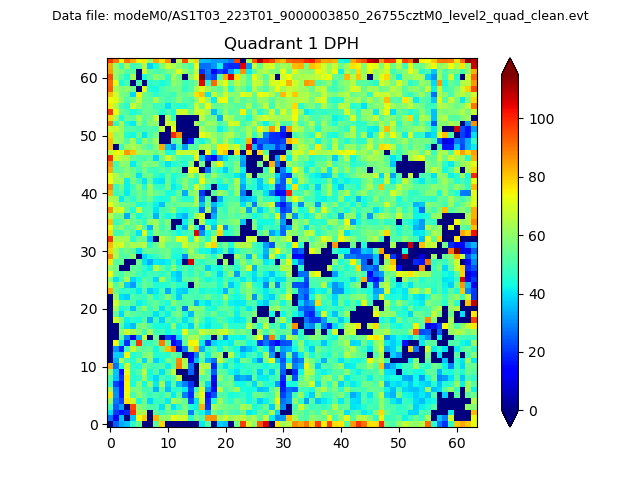 |
Quadrant B |
|---|---|---|---|
| Quadrant D | 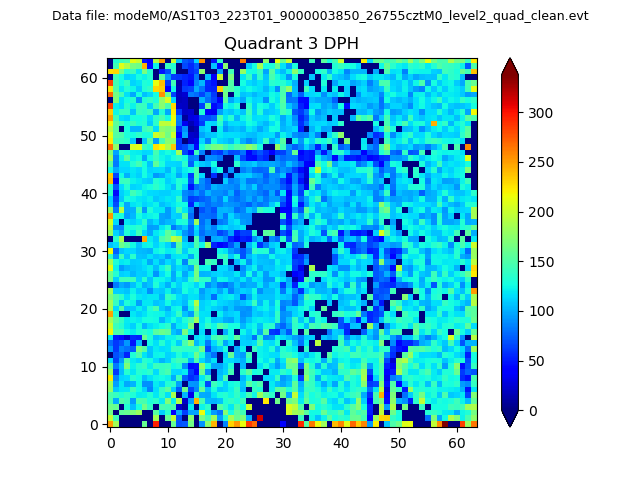 |
 |
Quadrant C |
| Plot type | Count rate plots | Images |
|---|---|---|
| Comparison with Poisson distribution Blue bars denote a histogram of data divided into 1 sec bins. Red curve is a Poisson curve with rate = median count rate of data. |
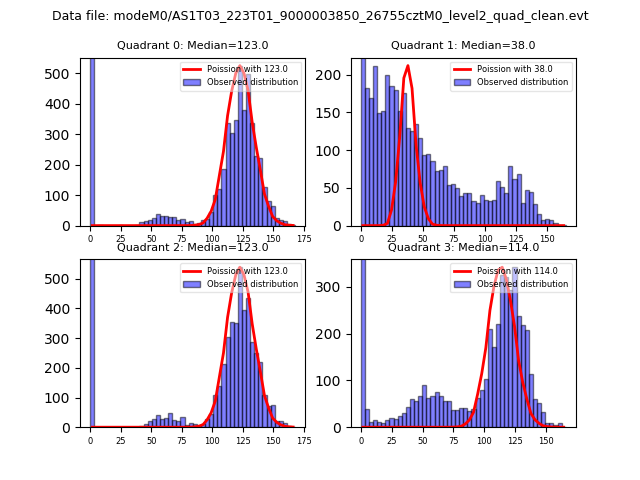 |
 |
| Quadrant-wise count rates Data is divided into 100 sec bins |
 |
|
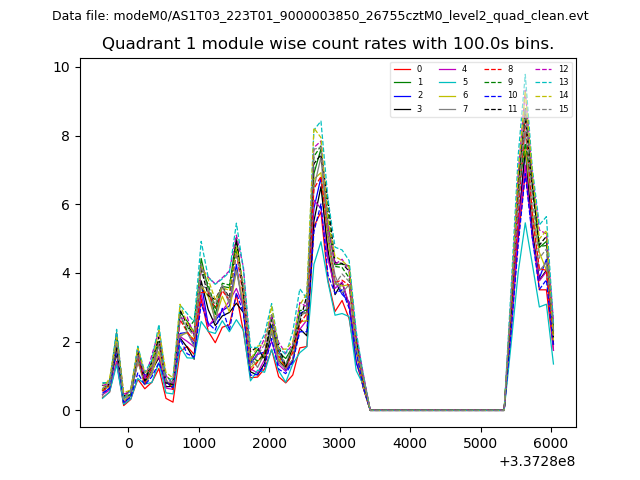
| Module-wise count rates for Quadrant A Data is divided into 100 sec bins |
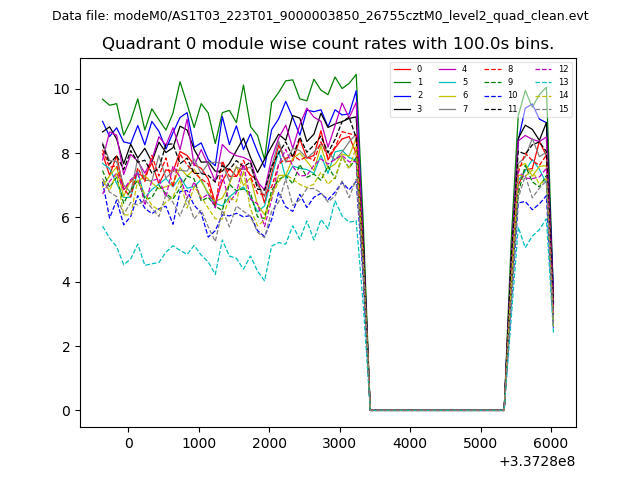 |
 |
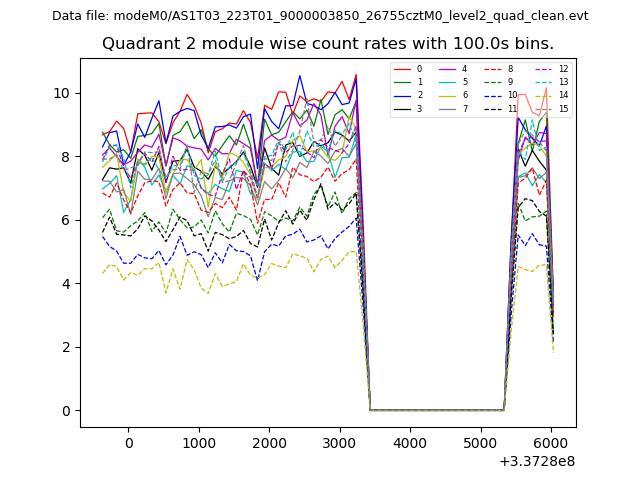
| Module-wise count rates for Quadrant B Data is divided into 100 sec bins |
 |
 |
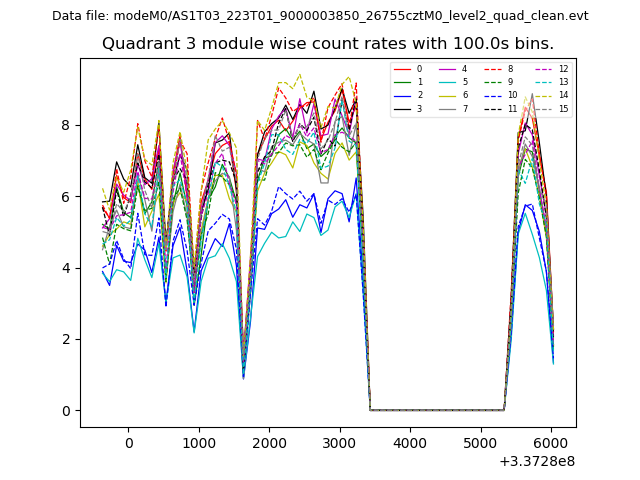
| Module-wise count rates for Quadrant C Data is divided into 100 sec bins |
 |
 |
| Module-wise count rates for Quadrant D Data is divided into 100 sec bins |
 |
 |
| Parameter | Plot |
|---|---|
| CZT HV Monitor | 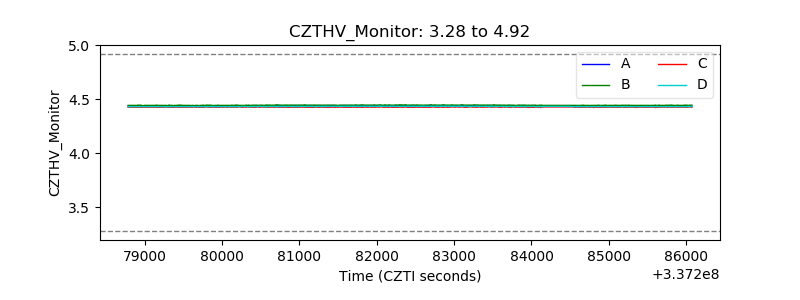 |
| D_VDD | 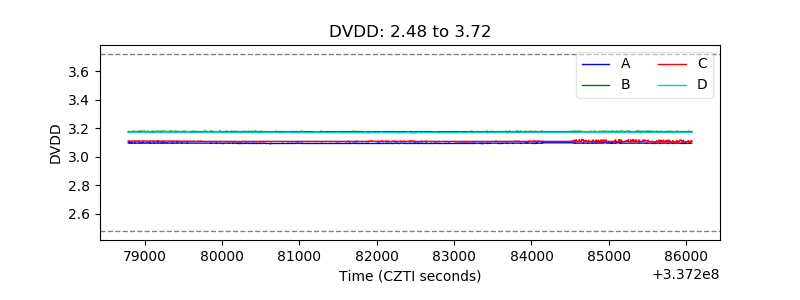 |
| Temperature 1 | 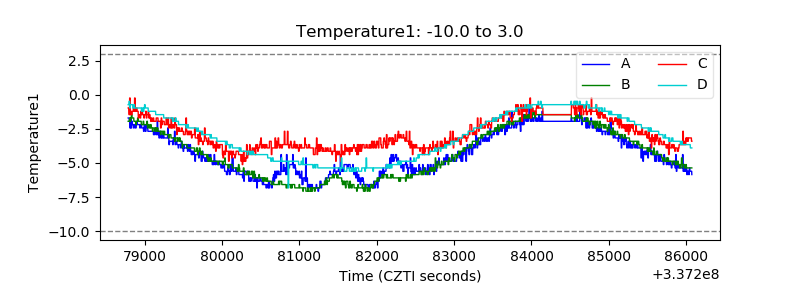 |
| Veto HV Monitor | 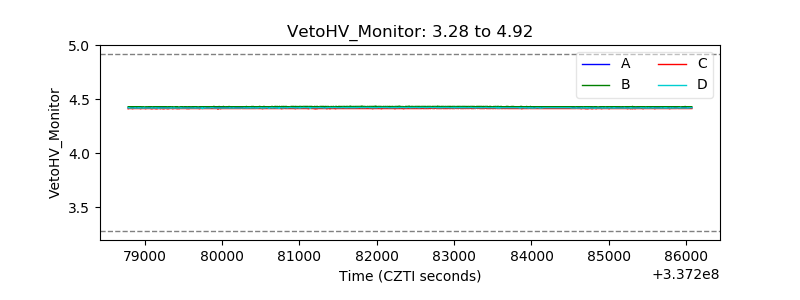 |
| Veto LLD | 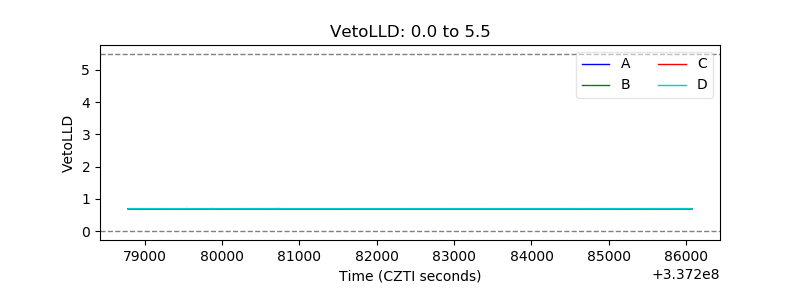 |
| Alpha Counter | 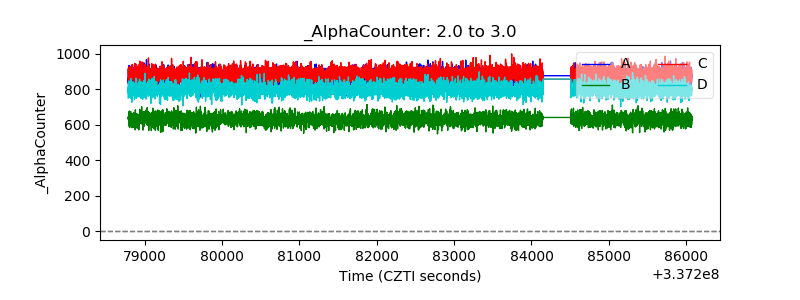 |
| _CPM_Rate |  |
| CZT Counter | 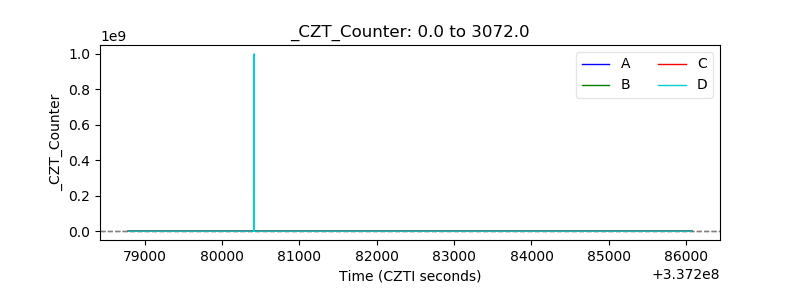 |
| +2.5 Volts monitor |  |
| +5 Volts monitor |  |
| _ROLL_ROT | 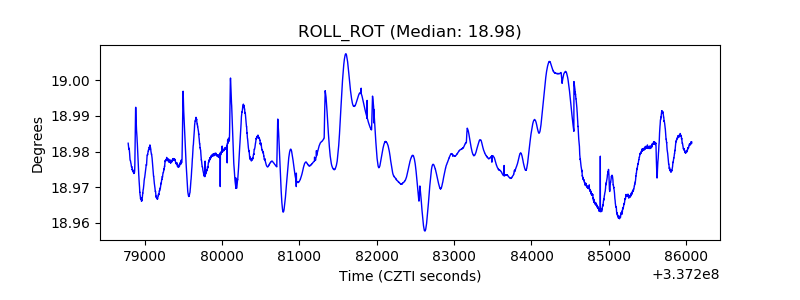 |
| _Roll_DEC | 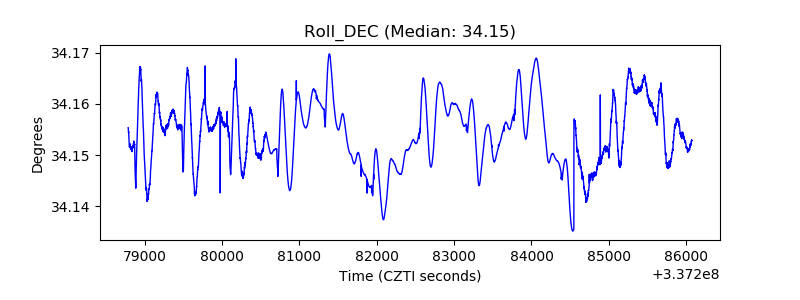 |
| _Roll_RA |  |
| Veto Counter | 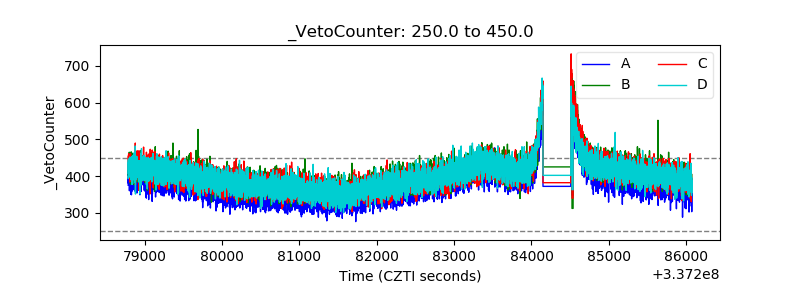 |