| Param | Original file | Final file |
|---|---|---|
| Filename | modeM0/AS1T03_223T01_9000003850_26758cztM0_level2.evt | modeM0/AS1T03_223T01_9000003850_26758cztM0_level2_quad_clean.evt |
| Size (bytes) | 935,683,200 | 89,000,640 |
| Size | 892.3 MB | 84.9 MB |
| Events in quadrant A | 5,421,799 | 593,834 |
| Events in quadrant B | 11,101,378 | 489,670 |
| Events in quadrant C | 3,271,889 | 598,386 |
| Events in quadrant D | 8,085,731 | 539,664 |
| Mode M9 | |||
|---|---|---|---|
| Quadrant | BADHDUFLAG | Total packets | Discarded packets |
| A | 0 | 5 | 0 |
| B | 0 | 5 | 0 |
| C | 0 | 5 | 0 |
| D | 0 | 5 | 0 |
| Mode M0 | |||
|---|---|---|---|
| Quadrant | BADHDUFLAG | Total packets | Discarded packets |
| A | 0 | 20822 | 0 |
| B | 0 | 37632 | 0 |
| C | 0 | 14001 | 0 |
| D | 0 | 28758 | 0 |
| Quadrant | Total seconds | Saturated seconds | Saturation percentage |
|---|---|---|---|
| A | 6780 | 203 | 2.994100% |
| B | 6781 | 3317 | 48.916089% |
| C | 6781 | 91 | 1.341985% |
| D | 6781 | 1530 | 22.563044% |
Noise dominated data is calculated using 1-second bins in cleaned event files. If a bin has >2000 counts, and if more than 50% of those come from <1% of pixels, then it is considered to be noise-dominated and hence unusable.
| Quadrant | # 1 sec bins | Bins with >0 counts | Bins with >2000 counts | High rate bins dominated by noise | Noise dominated (total time) | Noise dominated (detector-on time) | Marked lightcurve |
|---|---|---|---|---|---|---|---|
| A | 7335 | 6781 | 114 | 114 | 1.55% | 1.68% | 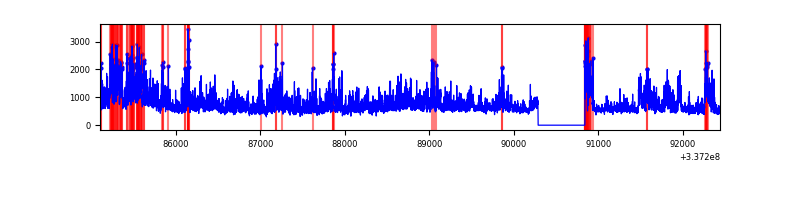 |
| B | 7336 | 6781 | 2889 | 2889 | 39.38% | 42.60% | 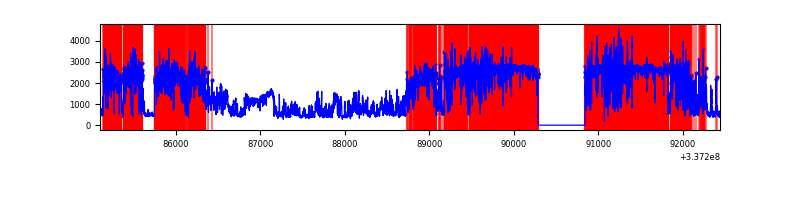 |
| C | 7336 | 6782 | 6 | 6 | 0.08% | 0.09% | 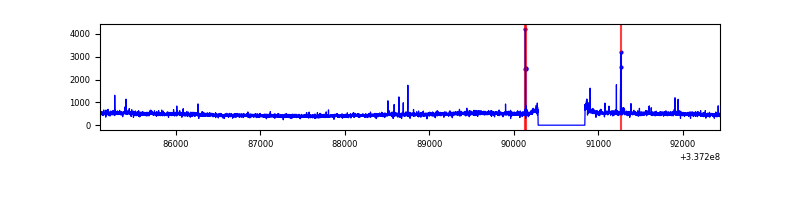 |
| D | 7336 | 6782 | 1141 | 1141 | 15.55% | 16.82% | 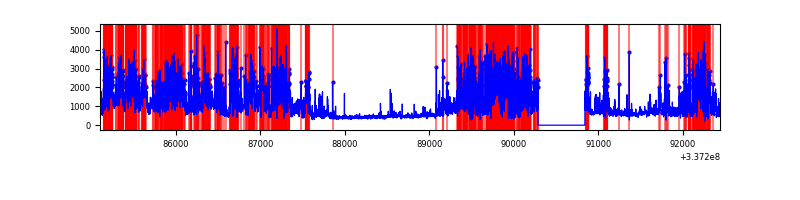 |
Top three noisy pixels from each quadrant. If the there are fewer than three noisy pixels in the level2.evt file, extra rows are filled as -1
| Pixel properties | Quadrant properties | ||||||
|---|---|---|---|---|---|---|---|
| Quadrant | DetID | PixID | Counts | Sigma | Mean | Median | Sigma |
| A | 0 | 13 | 2286510 | 14013.77 | 807 | 789 | 163.1 |
| A | 13 | 254 | 11980 | 68.61 | 807 | 789 | 163.1 |
| A | 13 | 34 | 10403 | 58.94 | 807 | 789 | 163.1 |
| B | 0 | 189 | 8831157 | 79809.74 | 573 | 558 | 110.6 |
| B | 10 | 246 | 22740 | 200.48 | 573 | 558 | 110.6 |
| B | 12 | 111 | 12989 | 112.35 | 573 | 558 | 110.6 |
| C | 14 | 238 | 125730 | 669.91 | 786 | 790 | 186.5 |
| C | 2 | 16 | 58483 | 309.34 | 786 | 790 | 186.5 |
| C | 3 | 233 | 17667 | 90.49 | 786 | 790 | 186.5 |
| D | 7 | 80 | 3579958 | 18545.08 | 713 | 698 | 193.0 |
| D | 1 | 52 | 1000510 | 5180.29 | 713 | 698 | 193.0 |
| D | 12 | 227 | 299527 | 1548.31 | 713 | 698 | 193.0 |
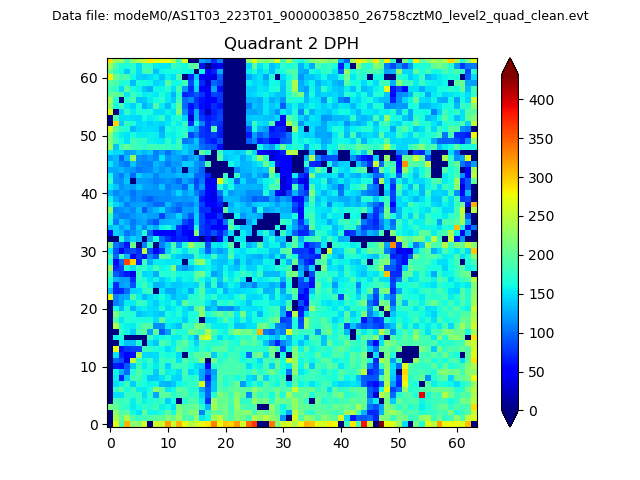
Histogram calculated using DETX and DETY for each event in the final _common_clean file
| Quadrant A | 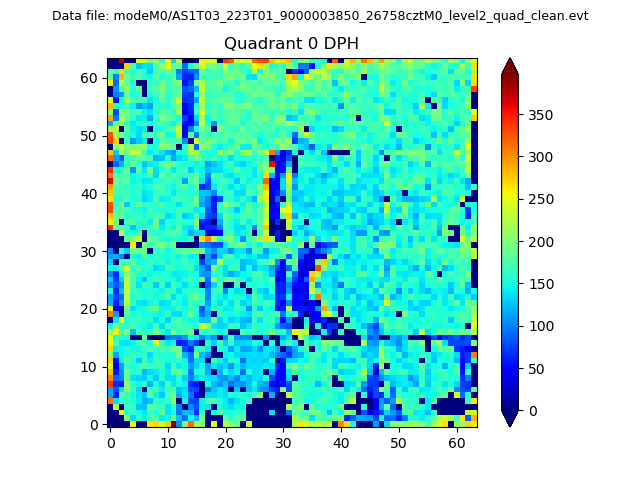 |
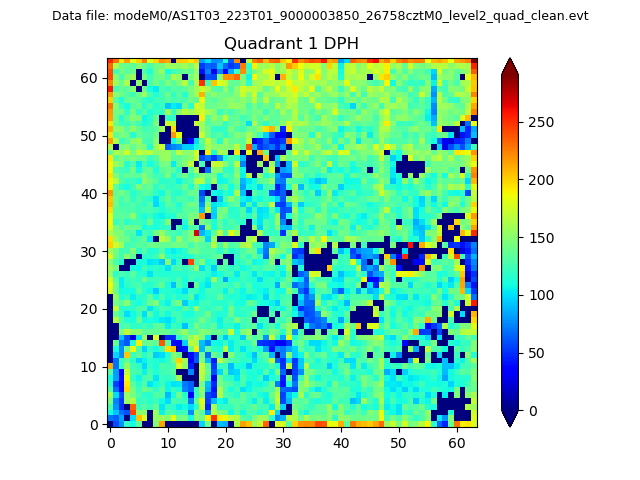 |
Quadrant B |
|---|---|---|---|
| Quadrant D | 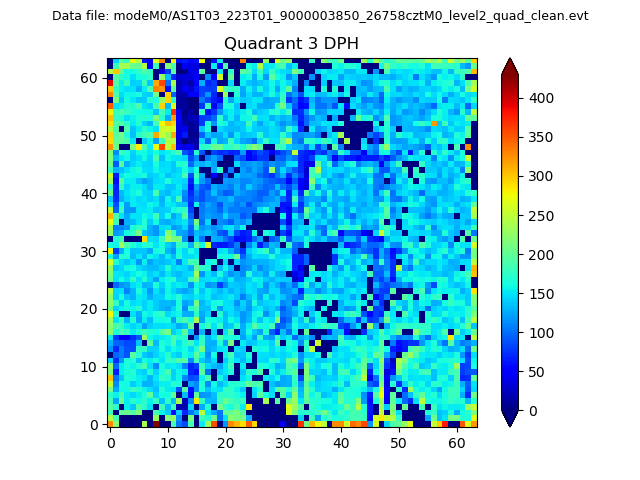 |
 |
Quadrant C |
| Plot type | Count rate plots | Images |
|---|---|---|
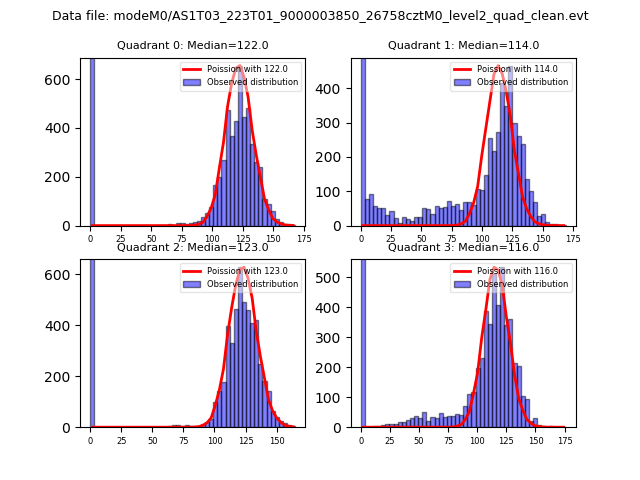
| Comparison with Poisson distribution Blue bars denote a histogram of data divided into 1 sec bins. Red curve is a Poisson curve with rate = median count rate of data. |
 |
 |
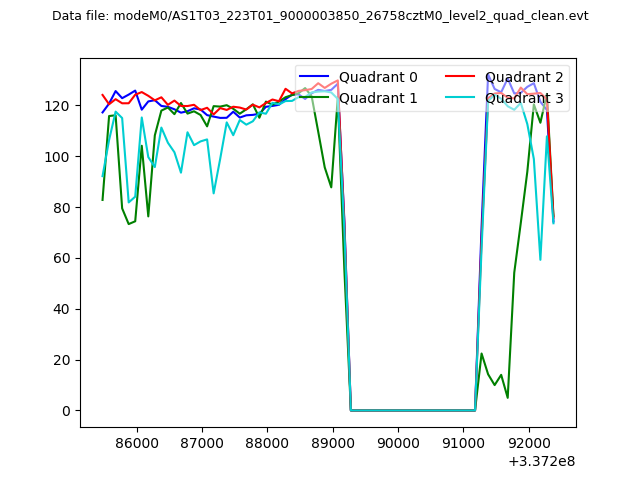
| Quadrant-wise count rates Data is divided into 100 sec bins |
 |
|
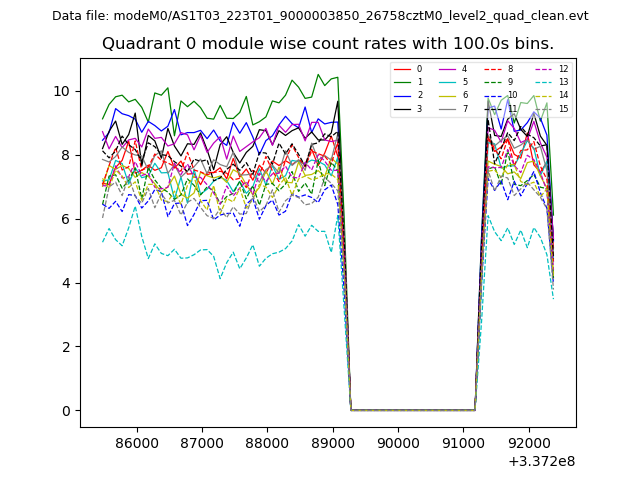
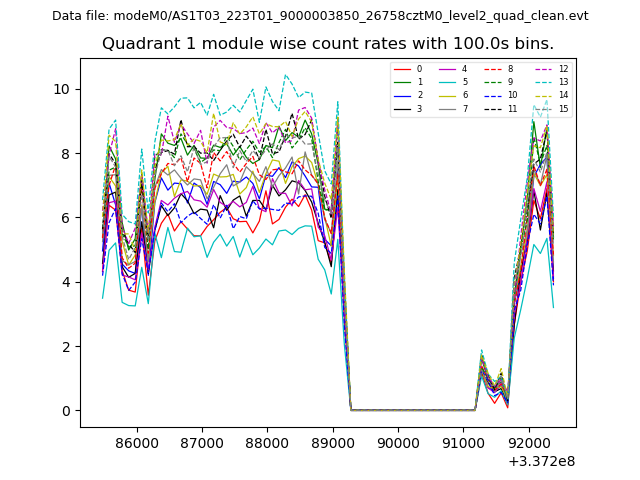
| Module-wise count rates for Quadrant A Data is divided into 100 sec bins |
 |
 |
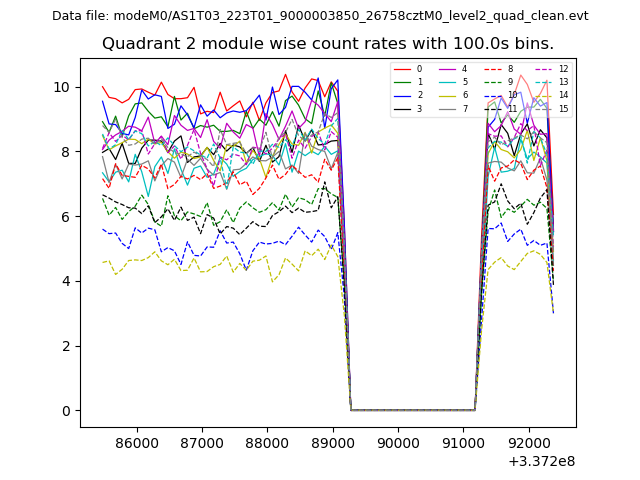
| Module-wise count rates for Quadrant B Data is divided into 100 sec bins |
 |
 |
| Module-wise count rates for Quadrant C Data is divided into 100 sec bins |
 |
 |
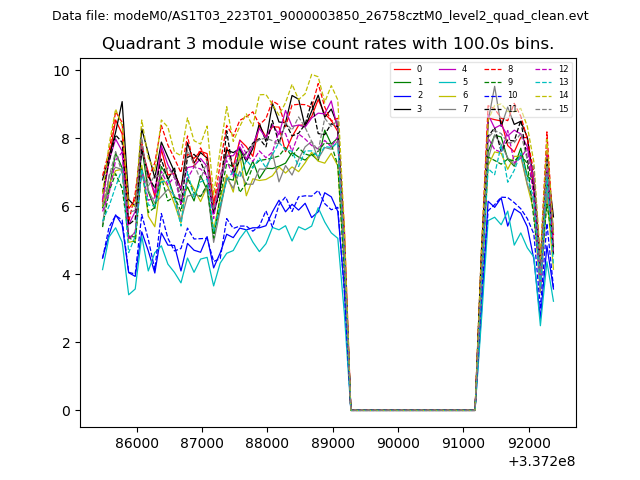
| Module-wise count rates for Quadrant D Data is divided into 100 sec bins |
 |
 |
| Parameter | Plot |
|---|---|
| CZT HV Monitor |  |
| D_VDD | 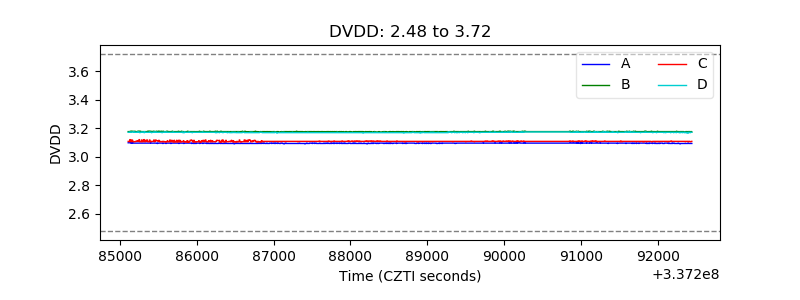 |
| Temperature 1 | 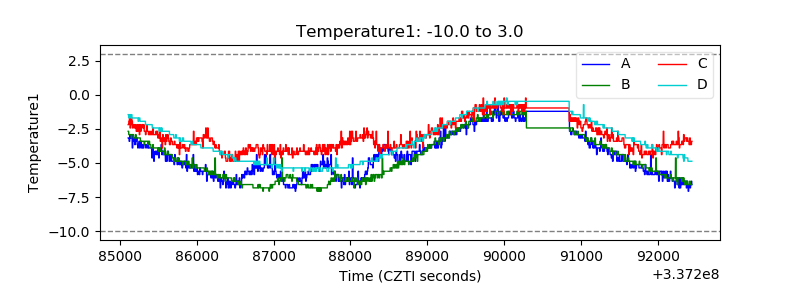 |
| Veto HV Monitor | 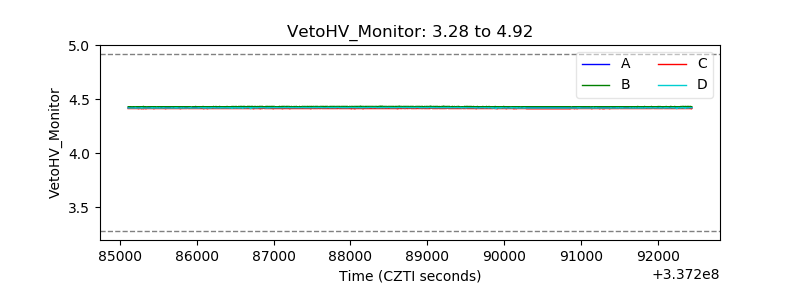 |
| Veto LLD | 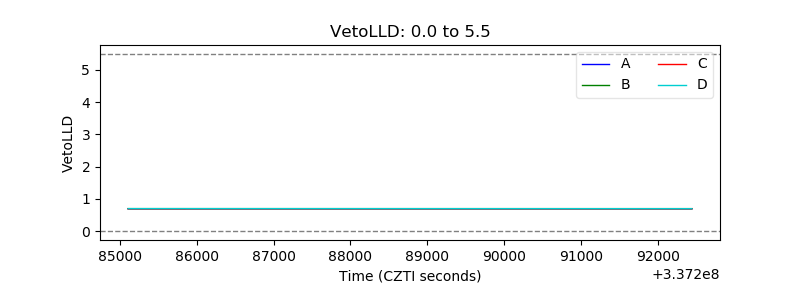 |
| Alpha Counter | 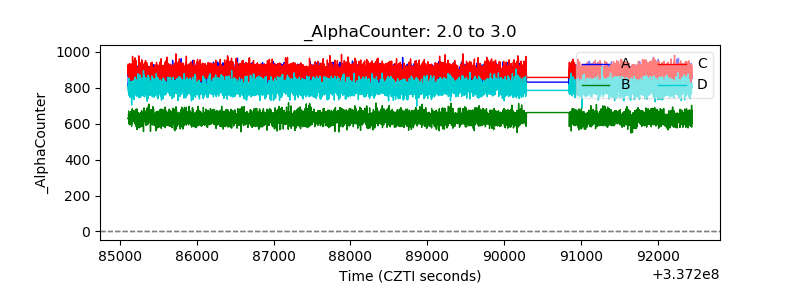 |
| _CPM_Rate | 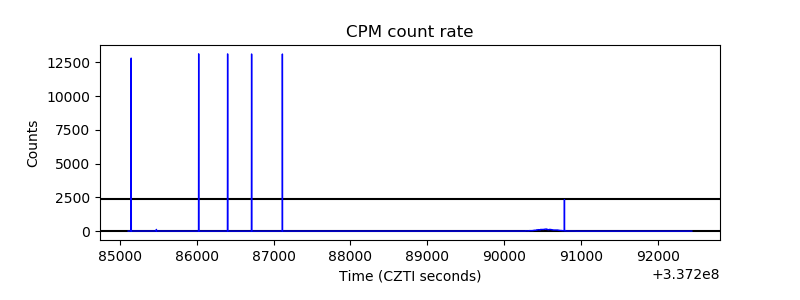 |
| CZT Counter | 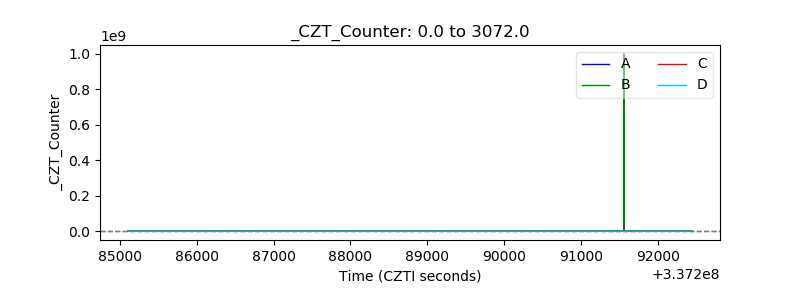 |
| +2.5 Volts monitor |  |
| +5 Volts monitor |  |
| _ROLL_ROT | 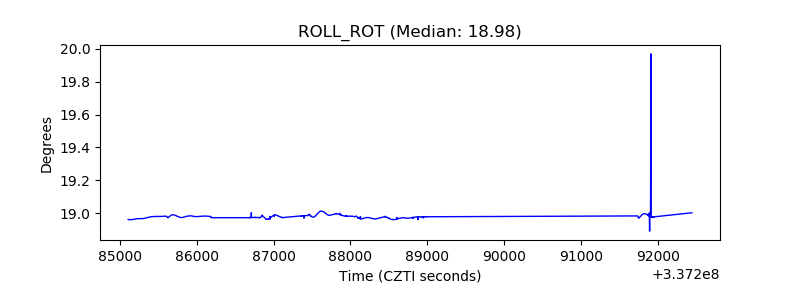 |
| _Roll_DEC | 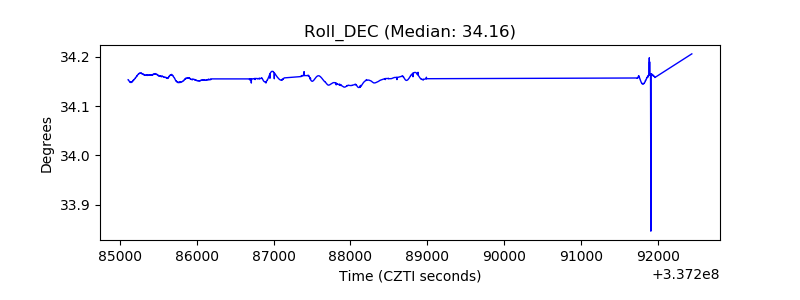 |
| _Roll_RA | 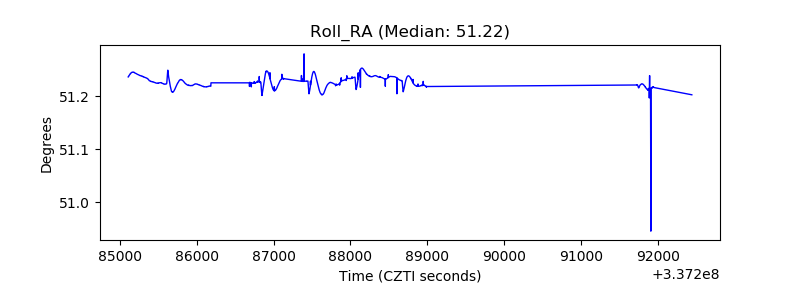 |
| Veto Counter | 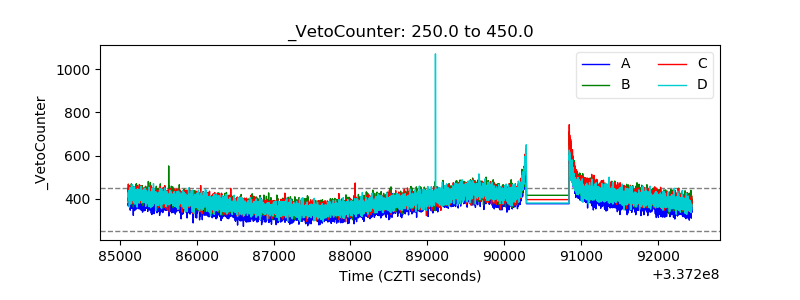 |