| Param | Original file | Final file |
|---|---|---|
| Filename | modeM0/AS1A09_044T02_9000003852cztM0_level2.fits | modeM0/AS1A09_044T02_9000003852cztM0_level2_quad_clean.evt |
| Size (bytes) | 403,496,640 | 185,152,320 |
| Size | 384.8 MB | 176.6 MB |
| Events in quadrant A | 2,733,766 | 930,251 |
| Events in quadrant B | 2,163,144 | 473,198 |
| Events in quadrant C | 2,605,832 | 874,109 |
| Events in quadrant D | 1,981,232 | 599,503 |
| Mode SS | |||
|---|---|---|---|
| Quadrant | BADHDUFLAG | Total packets | Discarded packets |
| A | 0 | 812 | 0 |
| B | 0 | 812 | 0 |
| C | 0 | 812 | 0 |
| D | 0 | 812 | 0 |
| Mode M9 | |||
|---|---|---|---|
| Quadrant | BADHDUFLAG | Total packets | Discarded packets |
| A | 0 | 89 | 0 |
| B | 0 | 89 | 0 |
| C | 0 | 89 | 0 |
| D | 0 | 89 | 0 |
| Mode M0 | |||
|---|---|---|---|
| Quadrant | BADHDUFLAG | Total packets | Discarded packets |
| A | 0 | 95767 | 0 |
| B | 0 | 166049 | 0 |
| C | 0 | 87755 | 0 |
| D | 0 | 183971 | 0 |
| Quadrant | Total seconds | Saturated seconds | Saturation percentage |
|---|---|---|---|
| A | 39696 | 445 | 1.121020% |
| B | 39696 | 11547 | 29.088573% |
| C | 39696 | 742 | 1.869206% |
| D | 39696 | 10841 | 27.310056% |
Noise dominated data is calculated using 1-second bins in cleaned event files. If a bin has >2000 counts, and if more than 50% of those come from <1% of pixels, then it is considered to be noise-dominated and hence unusable.
| Quadrant | # 1 sec bins | Bins with >0 counts | Bins with >2000 counts | High rate bins dominated by noise | Noise dominated (total time) | Noise dominated (detector-on time) | Marked lightcurve |
|---|---|---|---|---|---|---|---|
| A | 48701 | 39695 | 0 | 0 | 0.00% | 0.00% |  |
| B | 48701 | 39366 | 0 | 0 | 0.00% | 0.00% |  |
| C | 48701 | 39695 | 0 | 0 | 0.00% | 0.00% |  |
| D | 48701 | 39578 | 0 | 0 | 0.00% | 0.00% |  |
Top three noisy pixels from each quadrant. If the there are fewer than three noisy pixels in the level2.evt file, extra rows are filled as -1
| Pixel properties | Quadrant properties | ||||||
|---|---|---|---|---|---|---|---|
| Quadrant | DetID | PixID | Counts | Sigma | Mean | Median | Sigma |
| A | 7 | 110 | 2183 | 8.68 | 713 | 673 | 173.9 |
| A | 0 | 29 | 2168 | 8.6 | 713 | 673 | 173.9 |
| A | 9 | 19 | 1971 | 7.46 | 713 | 673 | 173.9 |
| B | 2 | 9 | 1604 | 9.26 | 572 | 548 | 114.0 |
| B | 5 | 225 | 1421 | 7.65 | 572 | 548 | 114.0 |
| B | 5 | 128 | 1379 | 7.29 | 572 | 548 | 114.0 |
| C | 1 | 80 | 2036 | 8.05 | 687 | 647 | 172.4 |
| C | 1 | 81 | 1969 | 7.67 | 687 | 647 | 172.4 |
| C | 12 | 241 | 1802 | 6.7 | 687 | 647 | 172.4 |
| D | 6 | 231 | 1424 | 6.06 | 567 | 518 | 149.5 |
| D | 6 | 67 | 1395 | 5.87 | 567 | 518 | 149.5 |
| D | 3 | 14 | 1387 | 5.81 | 567 | 518 | 149.5 |
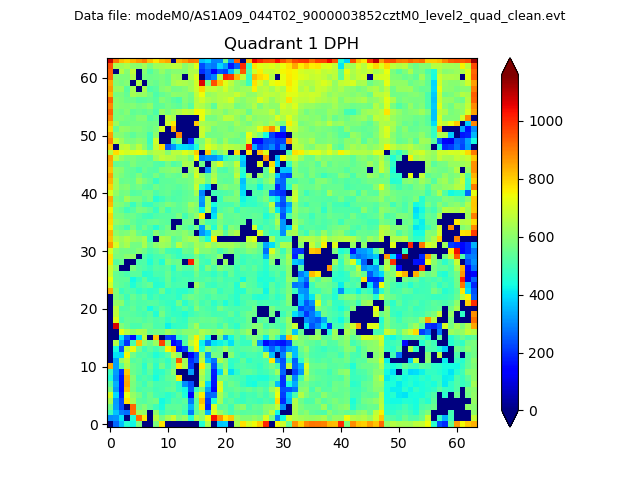
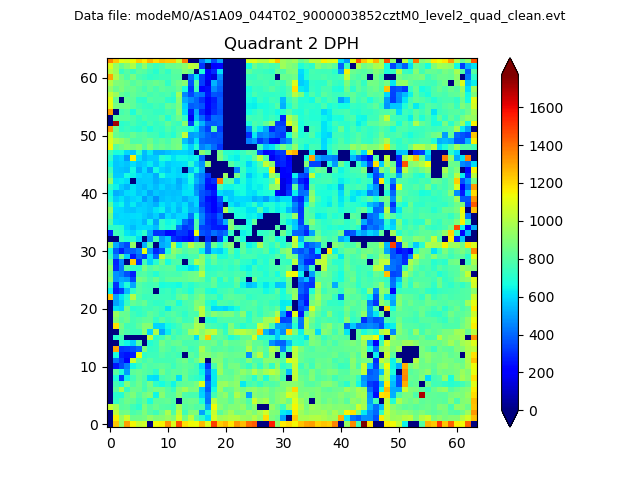
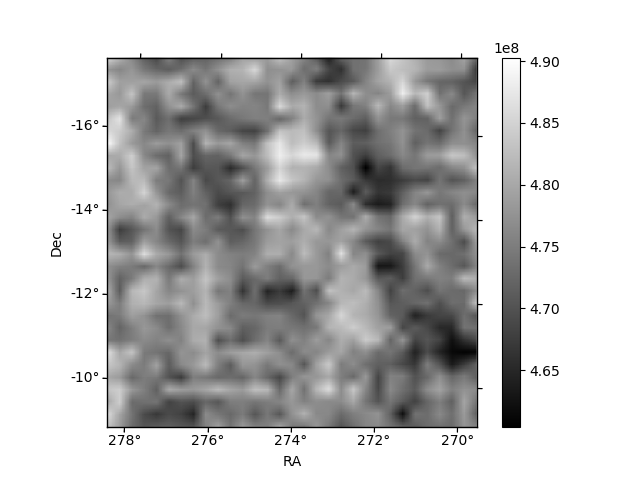
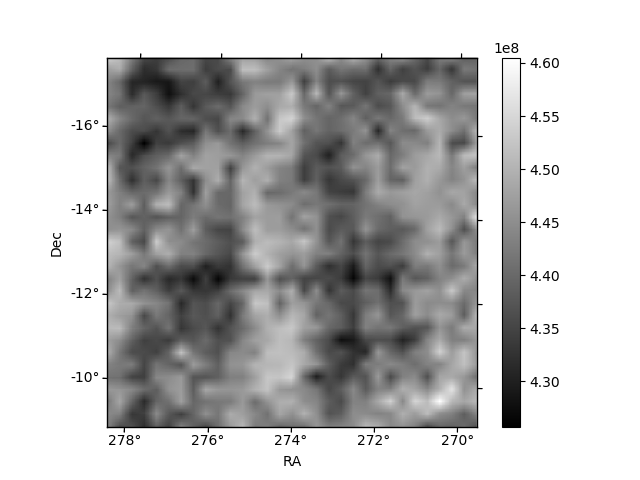
Histogram calculated using DETX and DETY for each event in the final _common_clean file
| Quadrant A |  |
 |
Quadrant B |
|---|---|---|---|
| Quadrant D | 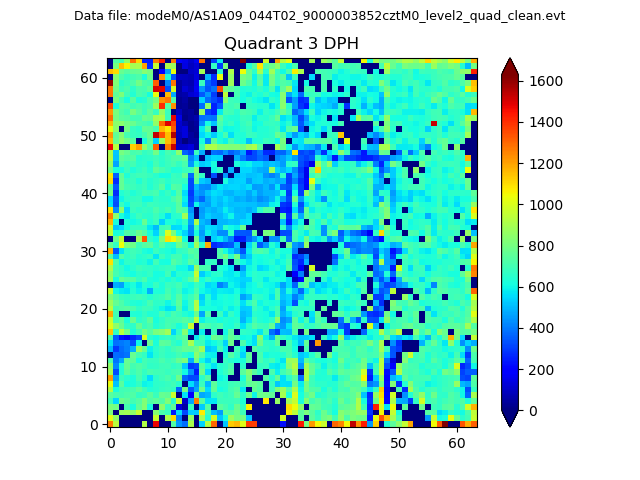 |
 |
Quadrant C |
| Plot type | Count rate plots | Images |
|---|---|---|
| Comparison with Poisson distribution Blue bars denote a histogram of data divided into 1 sec bins. Red curve is a Poisson curve with rate = median count rate of data. |
 |
 |
| Quadrant-wise count rates Data is divided into 100 sec bins |
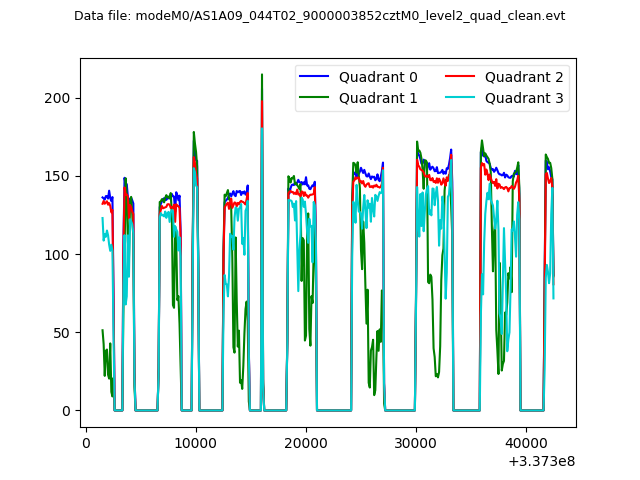 |
|
| Module-wise count rates for Quadrant A Data is divided into 100 sec bins |
 |
 |
| Module-wise count rates for Quadrant B Data is divided into 100 sec bins |
 |
 |
| Module-wise count rates for Quadrant C Data is divided into 100 sec bins |
 |
 |
| Module-wise count rates for Quadrant D Data is divided into 100 sec bins |
 |
 |
| Parameter | Plot |
|---|---|
| CZT HV Monitor | 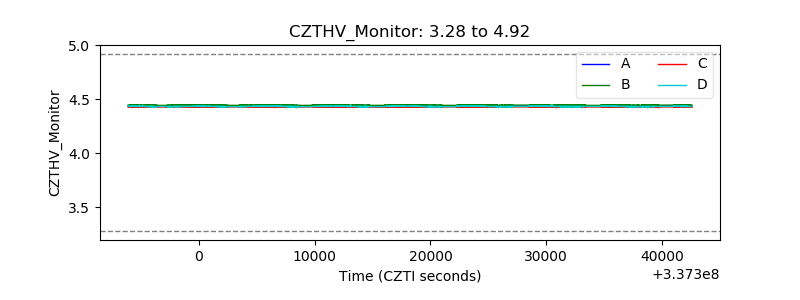 |
| D_VDD |  |
| Temperature 1 | 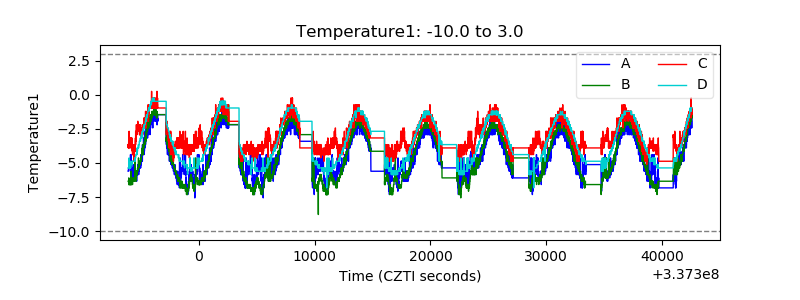 |
| Veto HV Monitor |  |
| Veto LLD |  |
| Alpha Counter |  |
| _CPM_Rate |  |
| CZT Counter |  |
| +2.5 Volts monitor |  |
| +5 Volts monitor |  |
| _ROLL_ROT |  |
| _Roll_DEC | 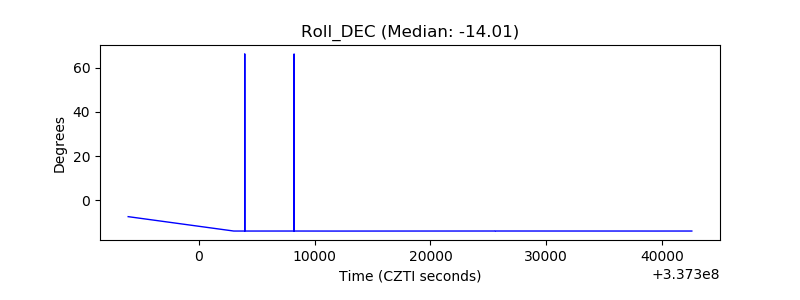 |
| _Roll_RA |  |
| Veto Counter |  |