| Param | Original file | Final file |
|---|---|---|
| Filename | modeM0/AS1A09_044T02_9000003852_26758cztM0_level2.evt | modeM0/AS1A09_044T02_9000003852_26758cztM0_level2_quad_clean.evt |
| Size (bytes) | 1,203,989,760 | 108,083,520 |
| Size | 1.1 GB | 103.1 MB |
| Events in quadrant A | 5,724,253 | 750,641 |
| Events in quadrant B | 11,490,910 | 586,338 |
| Events in quadrant C | 4,640,533 | 726,677 |
| Events in quadrant D | 13,971,769 | 552,199 |
| Mode M9 | |||
|---|---|---|---|
| Quadrant | BADHDUFLAG | Total packets | Discarded packets |
| A | 0 | 16 | 0 |
| B | 0 | 16 | 0 |
| C | 0 | 16 | 0 |
| D | 0 | 16 | 0 |
| Mode M0 | |||
|---|---|---|---|
| Quadrant | BADHDUFLAG | Total packets | Discarded packets |
| A | 0 | 23175 | 0 |
| B | 0 | 40241 | 0 |
| C | 0 | 19547 | 0 |
| D | 0 | 48038 | 0 |
| Quadrant | Total seconds | Saturated seconds | Saturation percentage |
|---|---|---|---|
| A | 9451 | 78 | 0.825309% |
| B | 9451 | 2780 | 29.414877% |
| C | 9451 | 90 | 0.952280% |
| D | 9451 | 3123 | 33.044122% |
Noise dominated data is calculated using 1-second bins in cleaned event files. If a bin has >2000 counts, and if more than 50% of those come from <1% of pixels, then it is considered to be noise-dominated and hence unusable.
| Quadrant | # 1 sec bins | Bins with >0 counts | Bins with >2000 counts | High rate bins dominated by noise | Noise dominated (total time) | Noise dominated (detector-on time) | Marked lightcurve |
|---|---|---|---|---|---|---|---|
| A | 11056 | 9453 | 8 | 8 | 0.07% | 0.08% | 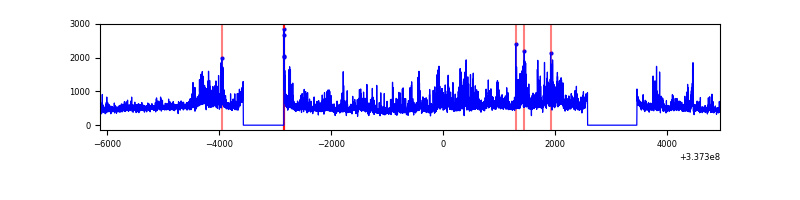 |
| B | 11056 | 9452 | 2357 | 2357 | 21.32% | 24.94% | 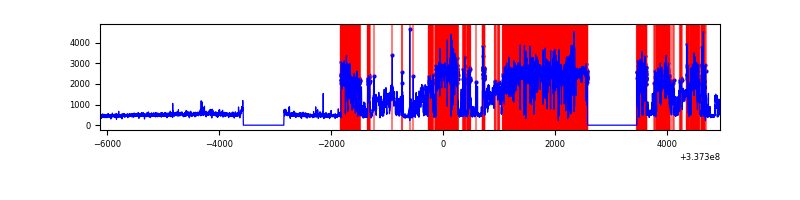 |
| C | 11056 | 9453 | 6 | 6 | 0.05% | 0.06% | 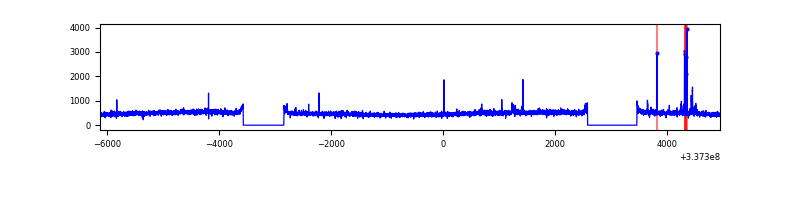 |
| D | 11056 | 9452 | 2457 | 2457 | 22.22% | 25.99% | 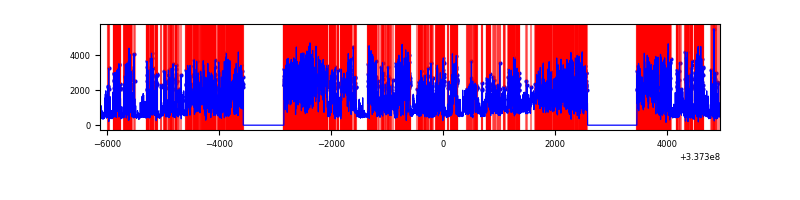 |
Top three noisy pixels from each quadrant. If the there are fewer than three noisy pixels in the level2.evt file, extra rows are filled as -1
| Pixel properties | Quadrant properties | ||||||
|---|---|---|---|---|---|---|---|
| Quadrant | DetID | PixID | Counts | Sigma | Mean | Median | Sigma |
| A | 0 | 13 | 1160550 | 4891.7 | 1176 | 1152 | 237.0 |
| A | 13 | 254 | 16246 | 63.68 | 1176 | 1152 | 237.0 |
| A | 6 | 16 | 13021 | 50.08 | 1176 | 1152 | 237.0 |
| B | 0 | 189 | 7547241 | 40064.97 | 982 | 955 | 188.4 |
| B | 10 | 246 | 69552 | 364.2 | 982 | 955 | 188.4 |
| B | 12 | 111 | 23218 | 118.2 | 982 | 955 | 188.4 |
| C | 14 | 238 | 177239 | 666.08 | 1120 | 1126 | 264.4 |
| C | 2 | 16 | 80928 | 301.82 | 1120 | 1126 | 264.4 |
| C | 3 | 233 | 7909 | 25.65 | 1120 | 1126 | 264.4 |
| D | 7 | 80 | 8786454 | 33829.26 | 967 | 947 | 259.7 |
| D | 1 | 52 | 1113356 | 4283.41 | 967 | 947 | 259.7 |
| D | 2 | 250 | 195385 | 748.7 | 967 | 947 | 259.7 |
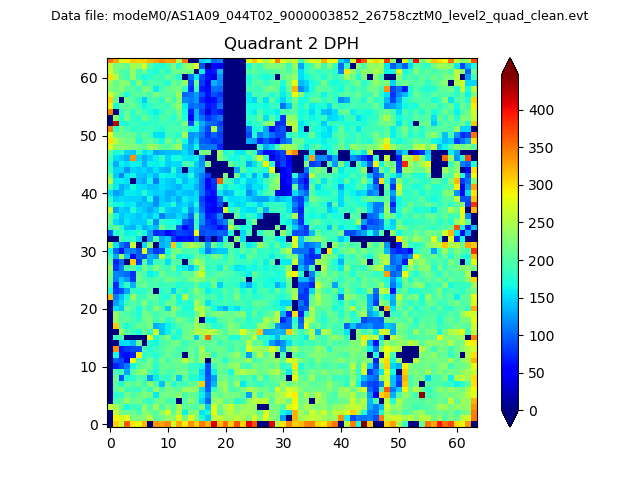
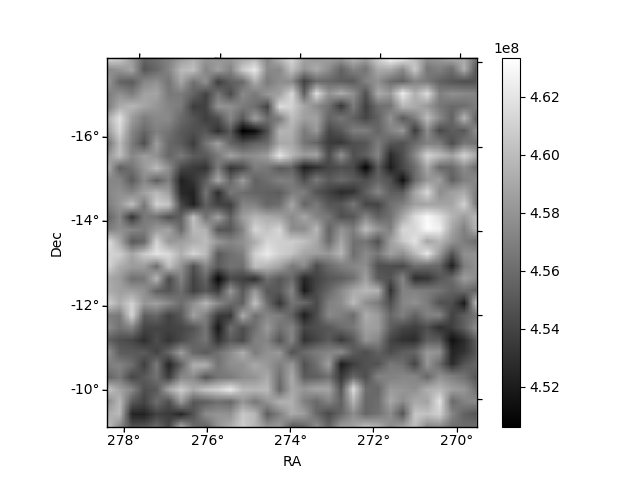
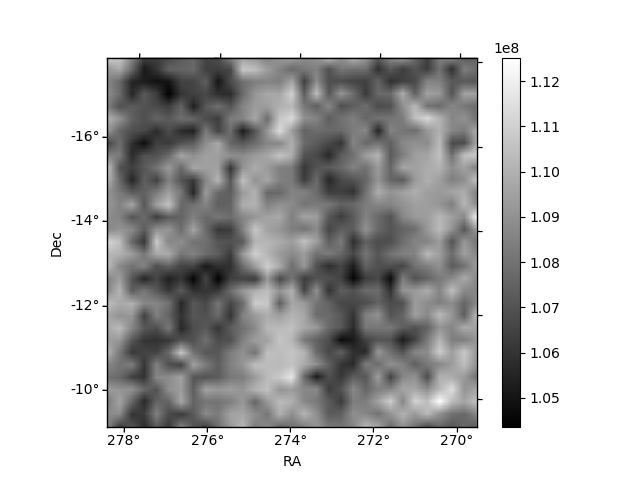
Histogram calculated using DETX and DETY for each event in the final _common_clean file
| Quadrant A | 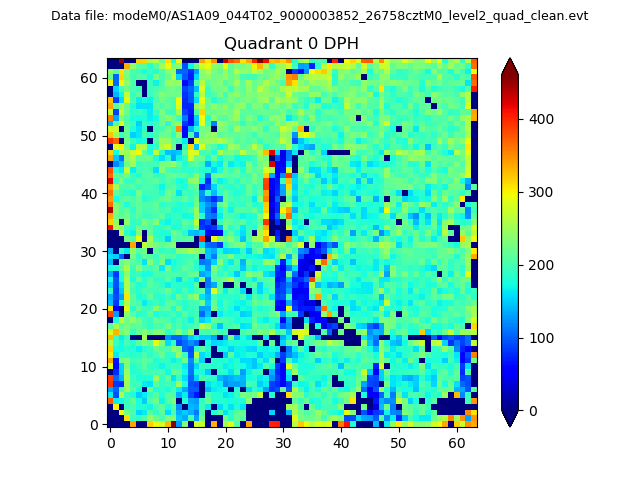 |
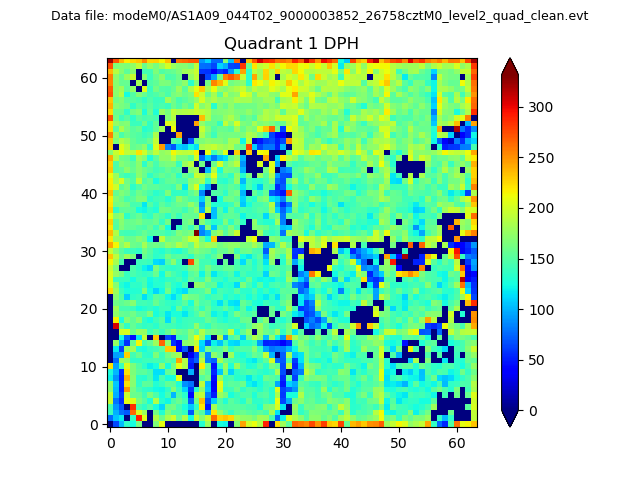 |
Quadrant B |
|---|---|---|---|
| Quadrant D | 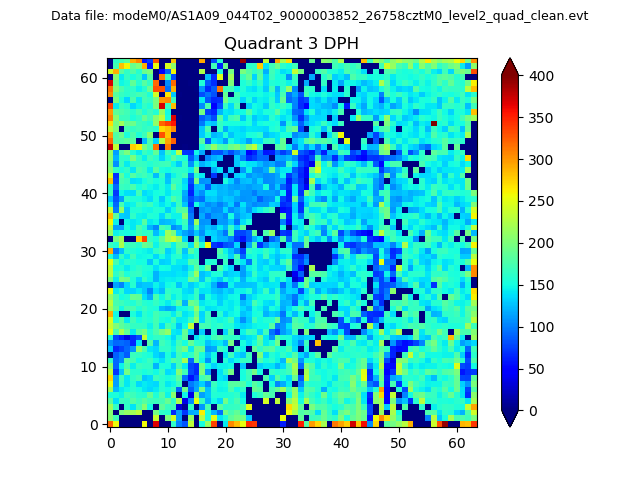 |
 |
Quadrant C |
| Plot type | Count rate plots | Images |
|---|---|---|
| Comparison with Poisson distribution Blue bars denote a histogram of data divided into 1 sec bins. Red curve is a Poisson curve with rate = median count rate of data. |
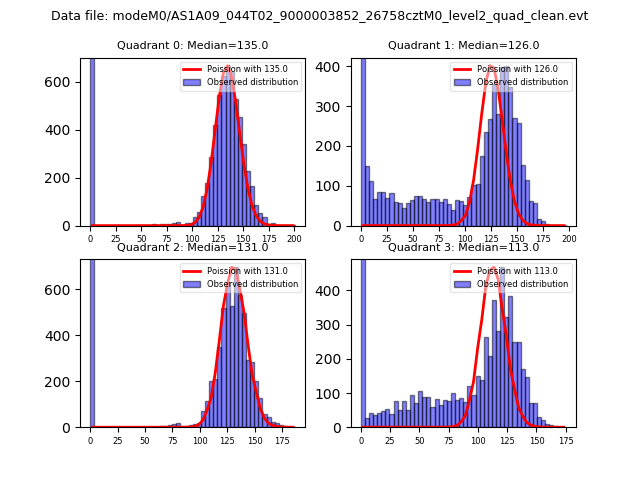 |
 |
| Quadrant-wise count rates Data is divided into 100 sec bins |
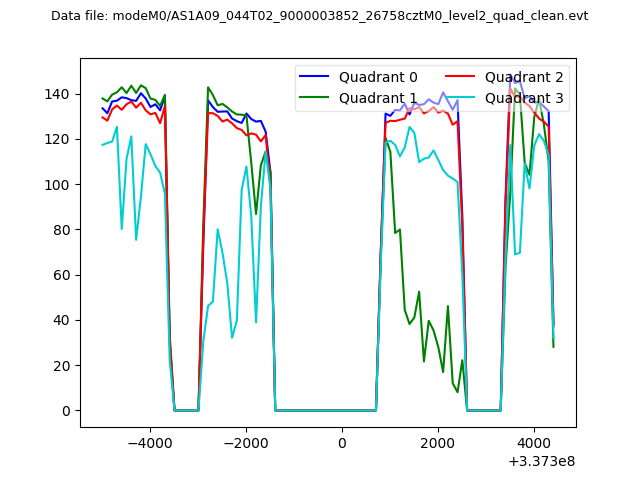 |
|
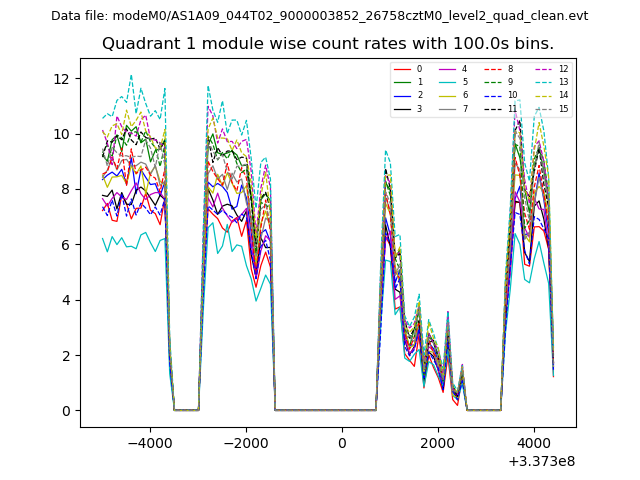
| Module-wise count rates for Quadrant A Data is divided into 100 sec bins |
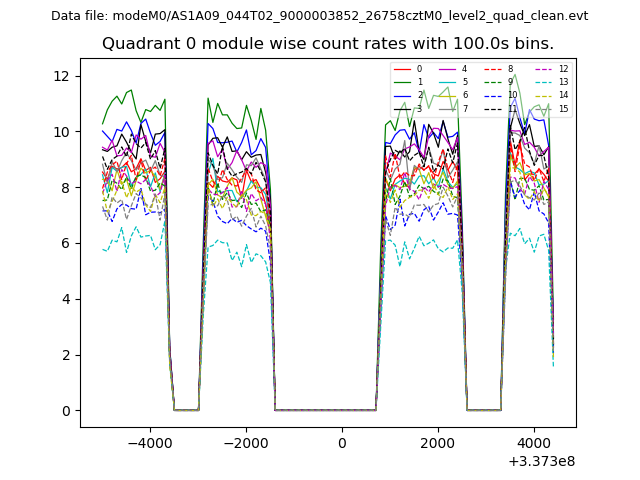 |
 |
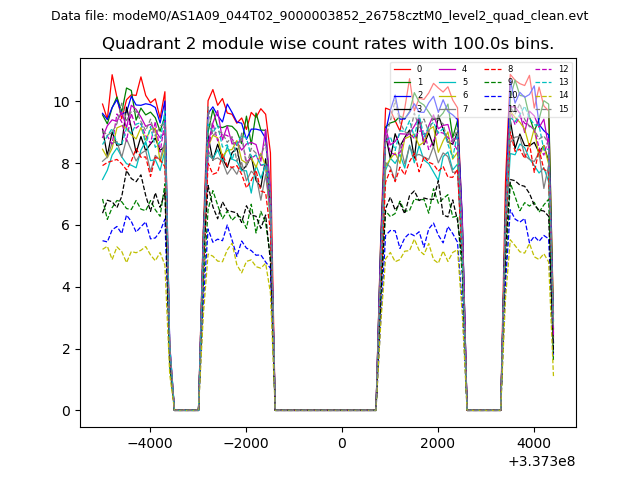
| Module-wise count rates for Quadrant B Data is divided into 100 sec bins |
 |
 |
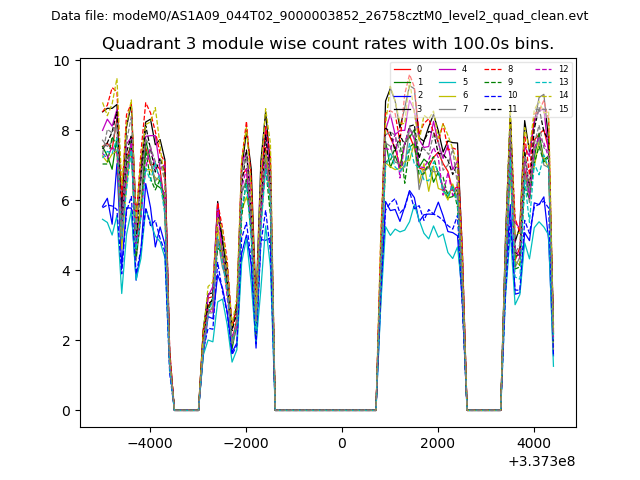
| Module-wise count rates for Quadrant C Data is divided into 100 sec bins |
 |
 |
| Module-wise count rates for Quadrant D Data is divided into 100 sec bins |
 |
 |
| Parameter | Plot |
|---|---|
| CZT HV Monitor |  |
| D_VDD | 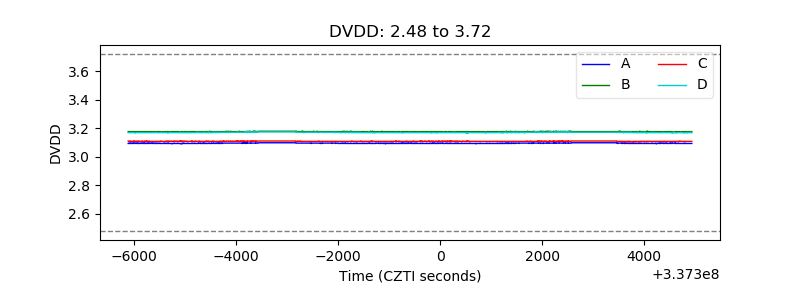 |
| Temperature 1 |  |
| Veto HV Monitor | 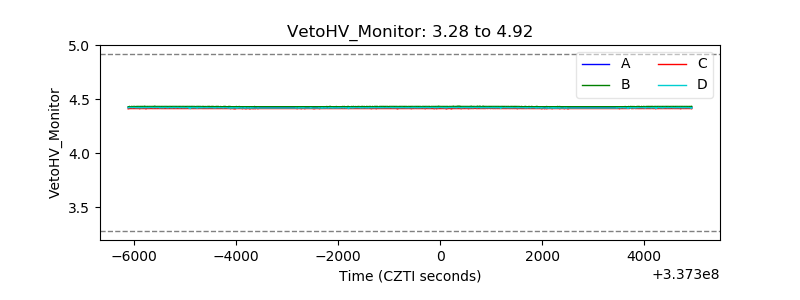 |
| Veto LLD | 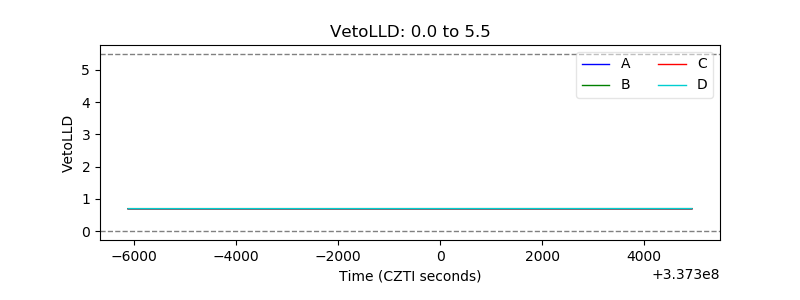 |
| Alpha Counter | 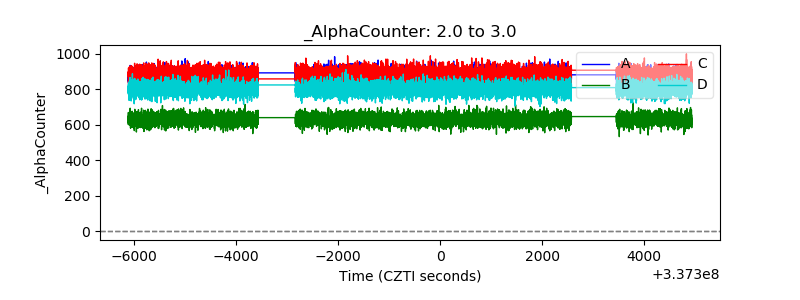 |
| _CPM_Rate | 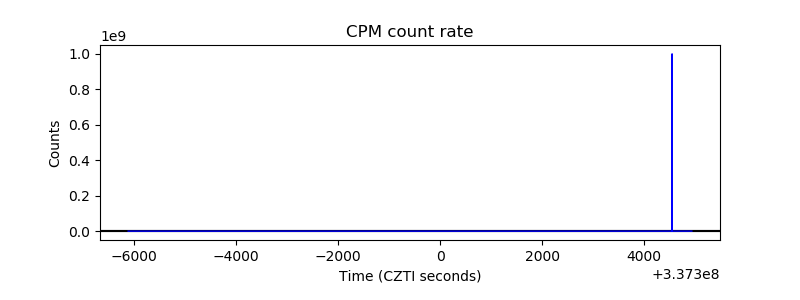 |
| CZT Counter | 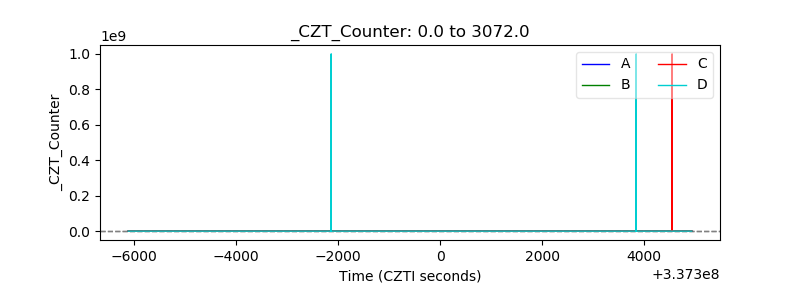 |
| +2.5 Volts monitor |  |
| +5 Volts monitor |  |
| _ROLL_ROT | 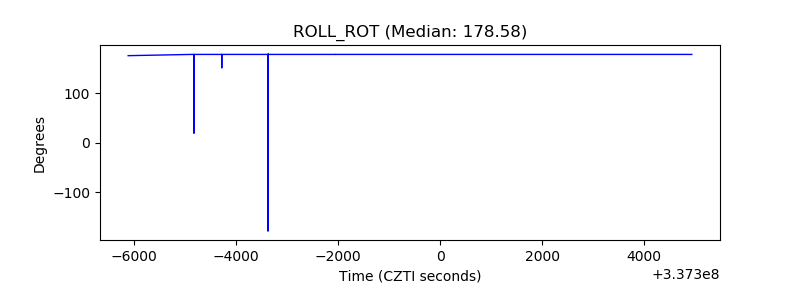 |
| _Roll_DEC | 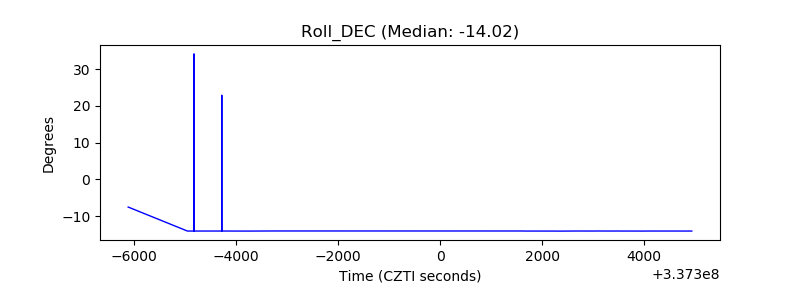 |
| _Roll_RA | 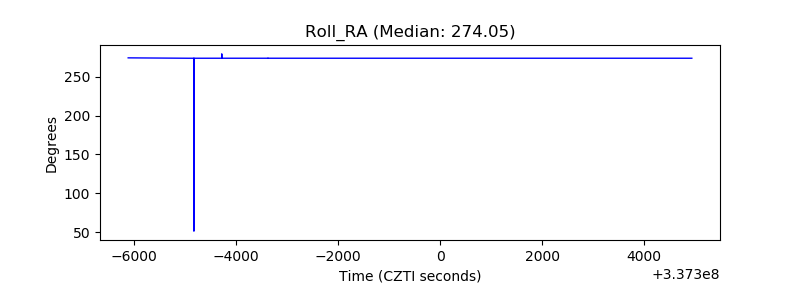 |
| Veto Counter | 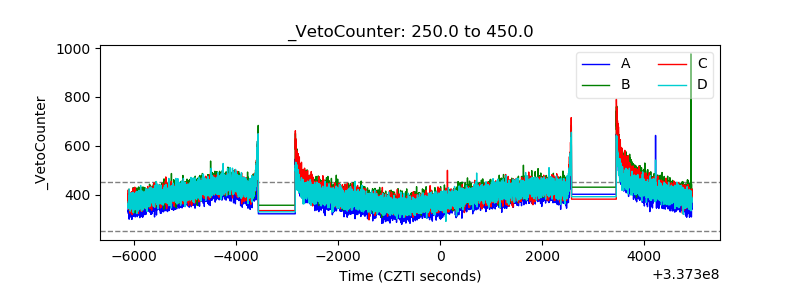 |