| Param | Original file | Final file |
|---|---|---|
| Filename | modeM0/AS1A09_044T02_9000003852_26759cztM0_level2.evt | modeM0/AS1A09_044T02_9000003852_26759cztM0_level2_quad_clean.evt |
| Size (bytes) | 684,014,400 | 76,092,480 |
| Size | 652.3 MB | 72.6 MB |
| Events in quadrant A | 3,500,876 | 498,656 |
| Events in quadrant B | 6,486,955 | 431,019 |
| Events in quadrant C | 3,418,625 | 475,885 |
| Events in quadrant D | 6,848,792 | 423,495 |
| Mode M9 | |||
|---|---|---|---|
| Quadrant | BADHDUFLAG | Total packets | Discarded packets |
| A | 0 | 11 | 0 |
| B | 0 | 12 | 0 |
| C | 0 | 12 | 0 |
| D | 0 | 12 | 0 |
| Mode M0 | |||
|---|---|---|---|
| Quadrant | BADHDUFLAG | Total packets | Discarded packets |
| A | 0 | 14600 | 0 |
| B | 0 | 23644 | 0 |
| C | 0 | 14310 | 0 |
| D | 0 | 24968 | 0 |
| Quadrant | Total seconds | Saturated seconds | Saturation percentage |
|---|---|---|---|
| A | 6801 | 19 | 0.279371% |
| B | 6801 | 1135 | 16.688722% |
| C | 6801 | 67 | 0.985149% |
| D | 6801 | 924 | 13.586237% |
Noise dominated data is calculated using 1-second bins in cleaned event files. If a bin has >2000 counts, and if more than 50% of those come from <1% of pixels, then it is considered to be noise-dominated and hence unusable.
| Quadrant | # 1 sec bins | Bins with >0 counts | Bins with >2000 counts | High rate bins dominated by noise | Noise dominated (total time) | Noise dominated (detector-on time) | Marked lightcurve |
|---|---|---|---|---|---|---|---|
| A | 7861 | 6802 | 0 | 0 | 0.00% | 0.00% |  |
| B | 7861 | 6802 | 906 | 906 | 11.53% | 13.32% |  |
| C | 7861 | 6802 | 11 | 11 | 0.14% | 0.16% |  |
| D | 7861 | 6802 | 749 | 749 | 9.53% | 11.01% |  |
Top three noisy pixels from each quadrant. If the there are fewer than three noisy pixels in the level2.evt file, extra rows are filled as -1
| Pixel properties | Quadrant properties | ||||||
|---|---|---|---|---|---|---|---|
| Quadrant | DetID | PixID | Counts | Sigma | Mean | Median | Sigma |
| A | 0 | 13 | 218805 | 1278.59 | 847 | 832 | 170.5 |
| A | 13 | 254 | 10855 | 58.79 | 847 | 832 | 170.5 |
| A | 12 | 96 | 9800 | 52.6 | 847 | 832 | 170.5 |
| B | 0 | 189 | 3326190 | 22430.97 | 781 | 763 | 148.3 |
| B | 10 | 246 | 64633 | 430.82 | 781 | 763 | 148.3 |
| B | 3 | 112 | 30302 | 199.25 | 781 | 763 | 148.3 |
| C | 14 | 238 | 129816 | 679.75 | 806 | 810 | 189.8 |
| C | 2 | 16 | 108399 | 566.9 | 806 | 810 | 189.8 |
| C | 15 | 208 | 30972 | 158.93 | 806 | 810 | 189.8 |
| D | 7 | 80 | 3012199 | 14928.65 | 771 | 752 | 201.7 |
| D | 1 | 52 | 739796 | 3663.66 | 771 | 752 | 201.7 |
| D | 2 | 250 | 86797 | 426.55 | 771 | 752 | 201.7 |
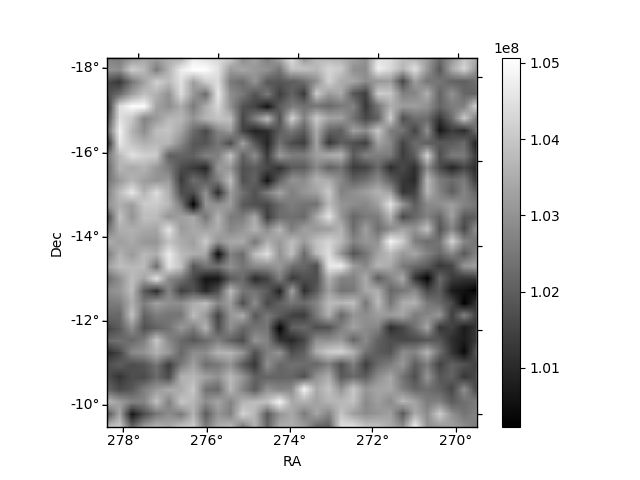
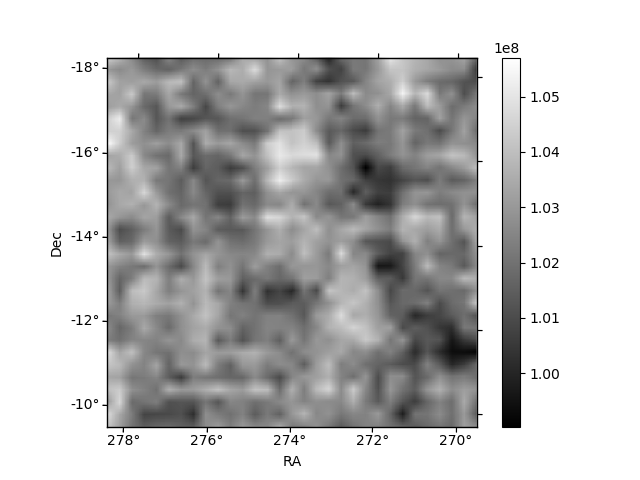
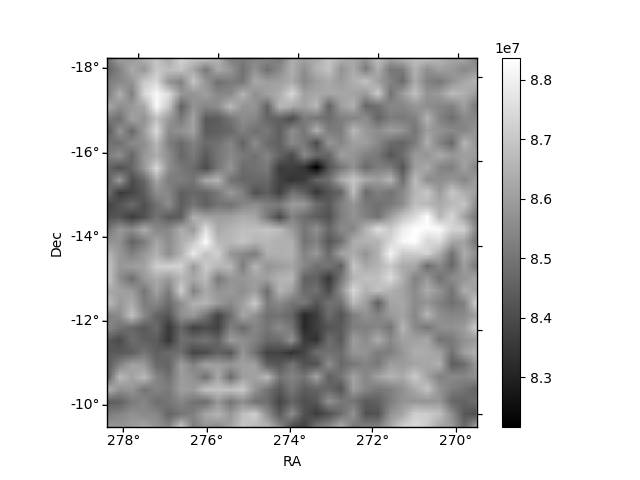
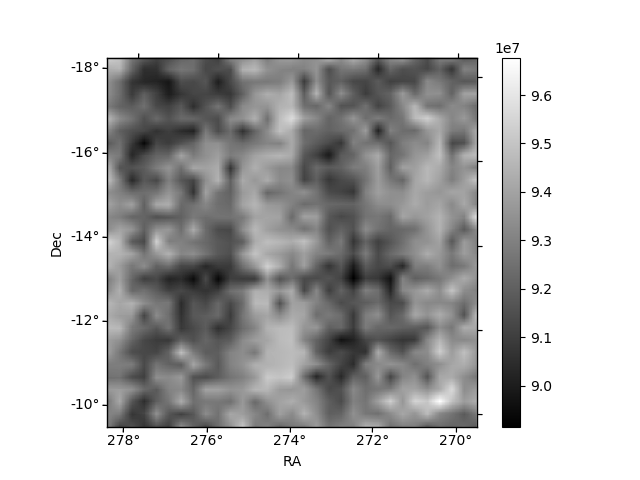
Histogram calculated using DETX and DETY for each event in the final _common_clean file
| Quadrant A | 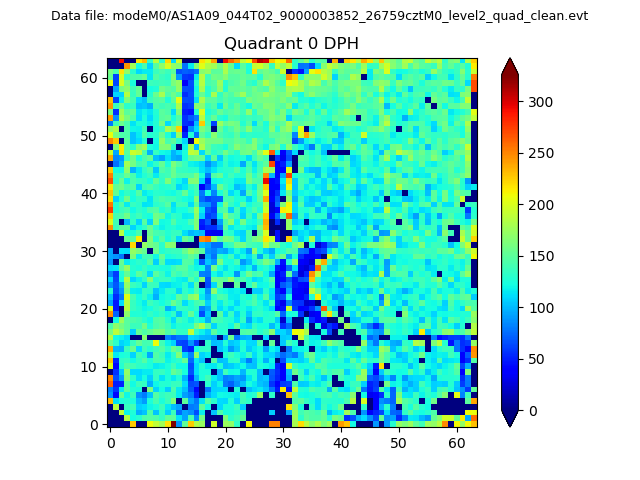 |
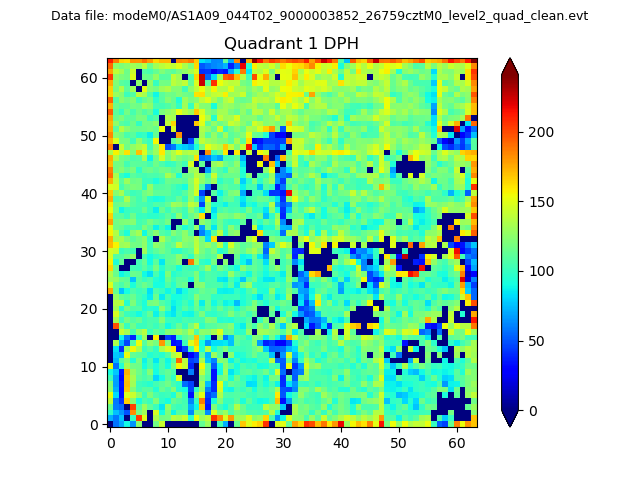 |
Quadrant B |
|---|---|---|---|
| Quadrant D | 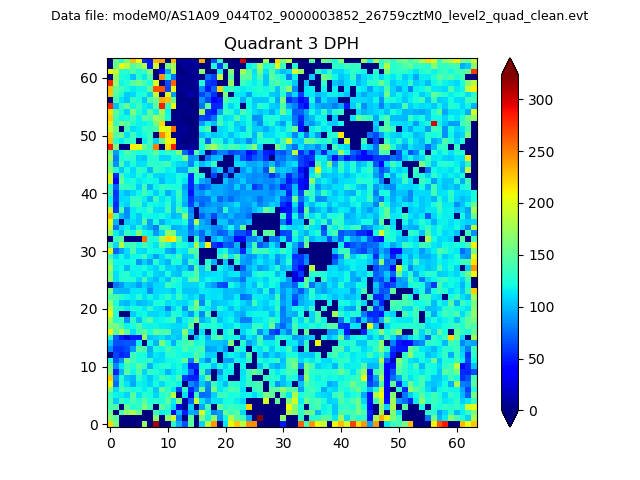 |
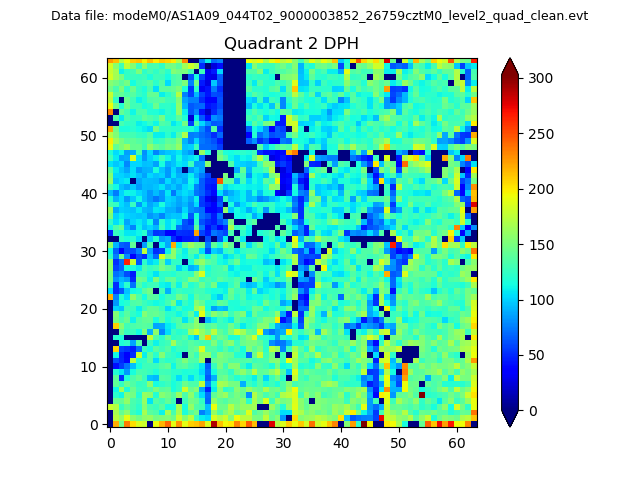 |
Quadrant C |
| Plot type | Count rate plots | Images |
|---|---|---|
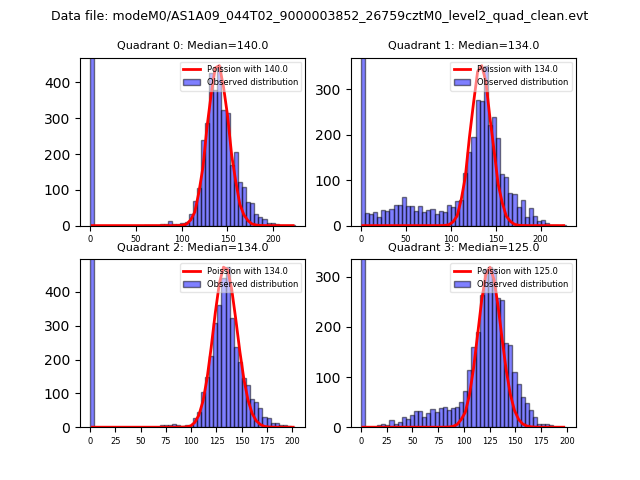
| Comparison with Poisson distribution Blue bars denote a histogram of data divided into 1 sec bins. Red curve is a Poisson curve with rate = median count rate of data. |
 |
 |
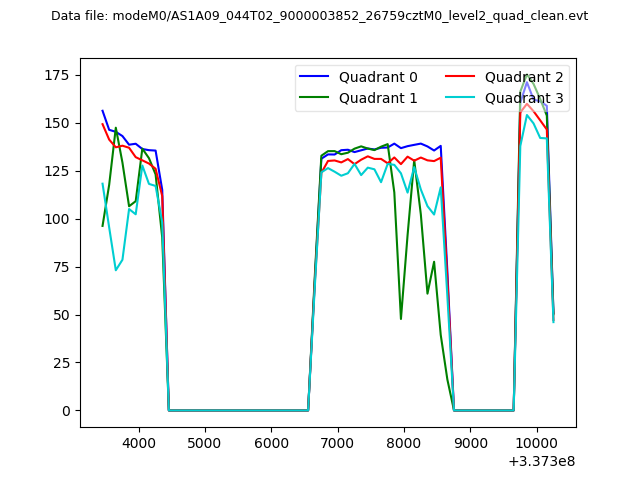
| Quadrant-wise count rates Data is divided into 100 sec bins |
 |
|
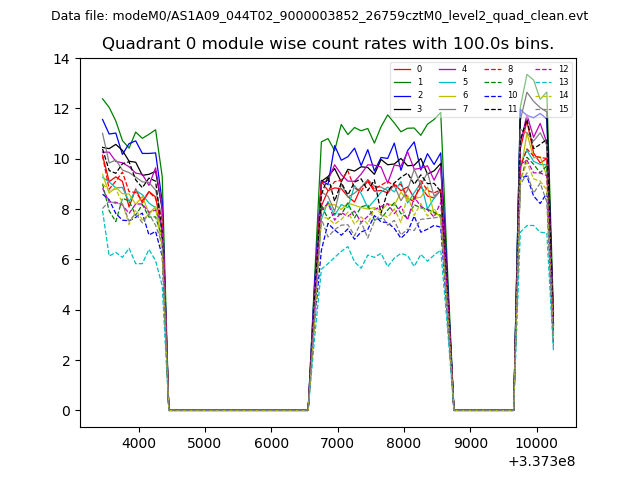
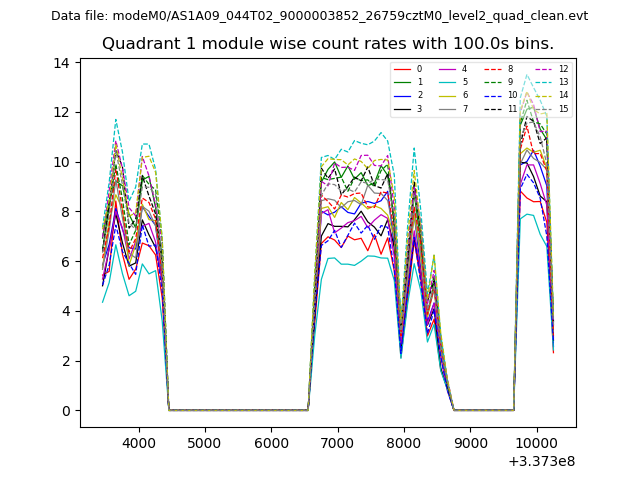
| Module-wise count rates for Quadrant A Data is divided into 100 sec bins |
 |
 |
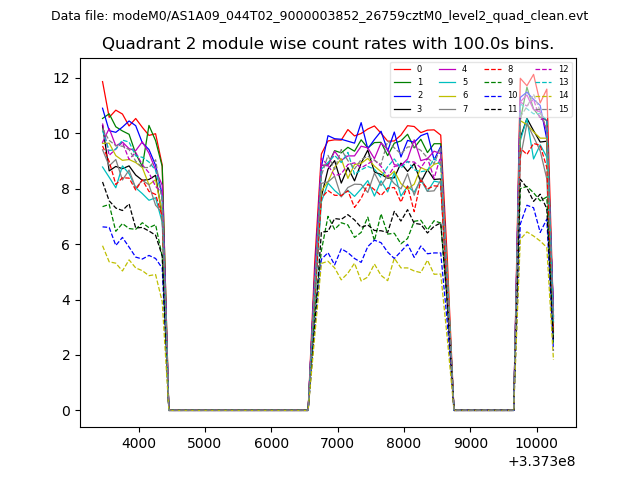
| Module-wise count rates for Quadrant B Data is divided into 100 sec bins |
 |
 |
| Module-wise count rates for Quadrant C Data is divided into 100 sec bins |
 |
 |
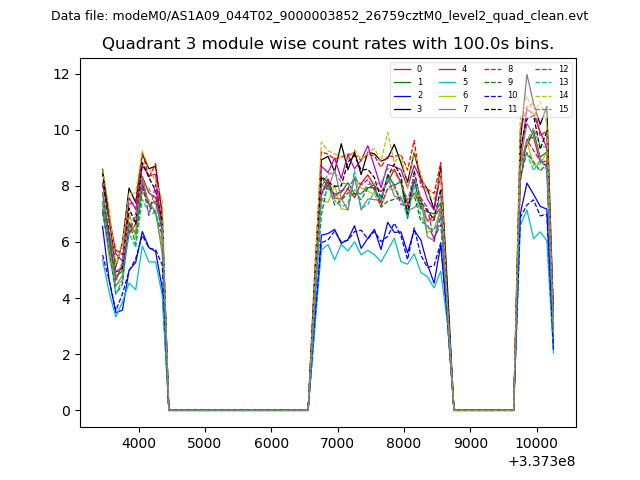
| Module-wise count rates for Quadrant D Data is divided into 100 sec bins |
 |
 |
| Parameter | Plot |
|---|---|
| CZT HV Monitor | 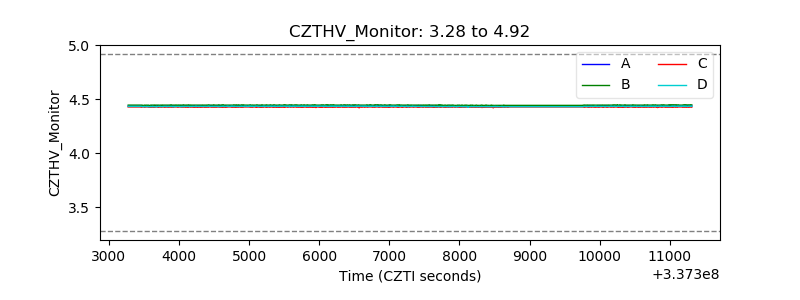 |
| D_VDD | 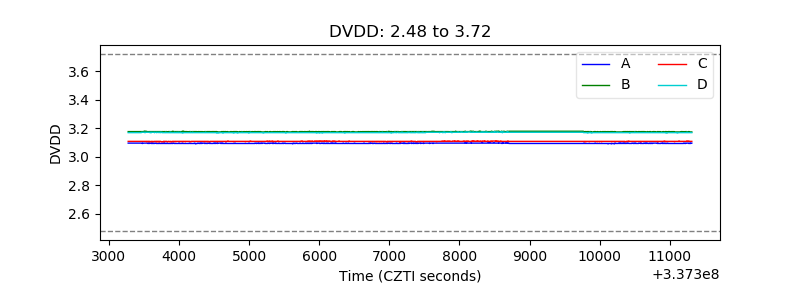 |
| Temperature 1 | 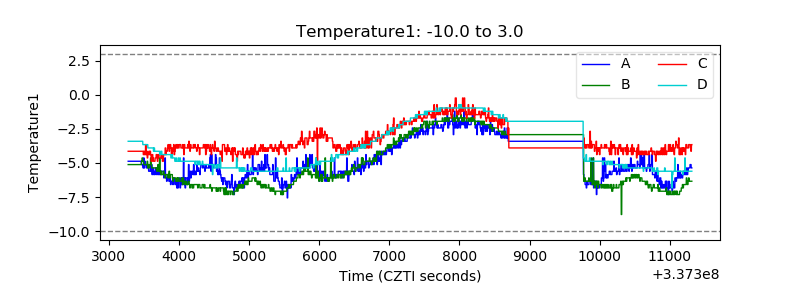 |
| Veto HV Monitor | 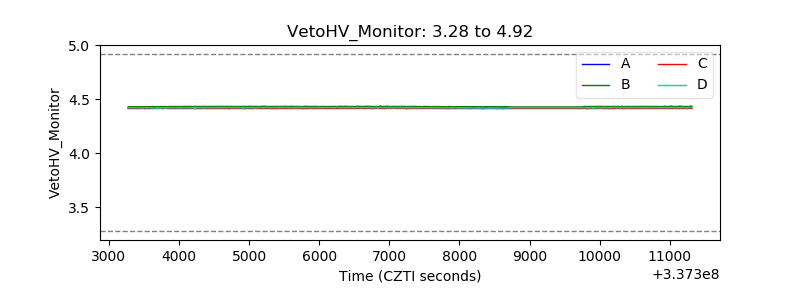 |
| Veto LLD | 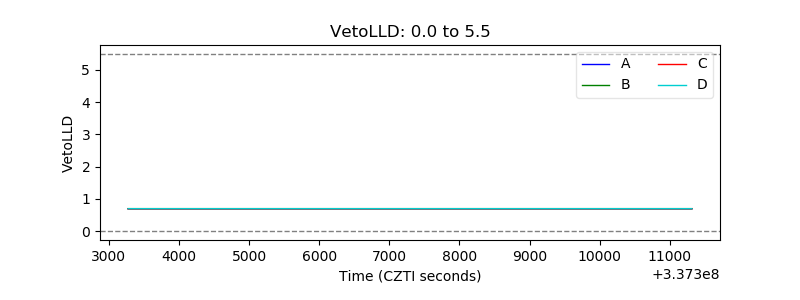 |
| Alpha Counter | 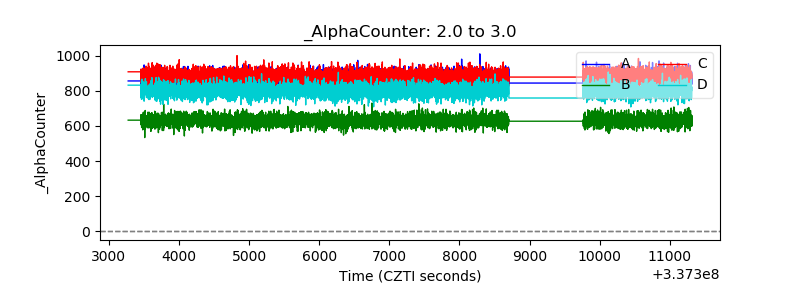 |
| _CPM_Rate | 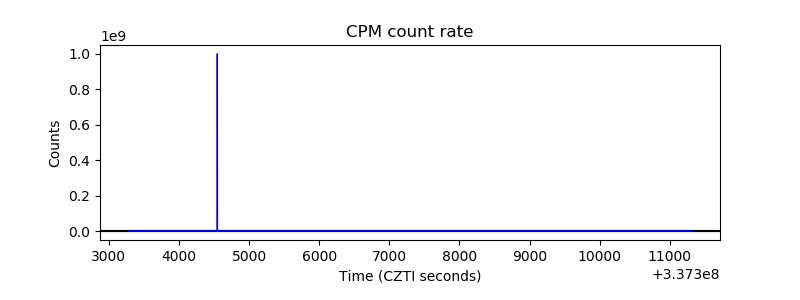 |
| CZT Counter | 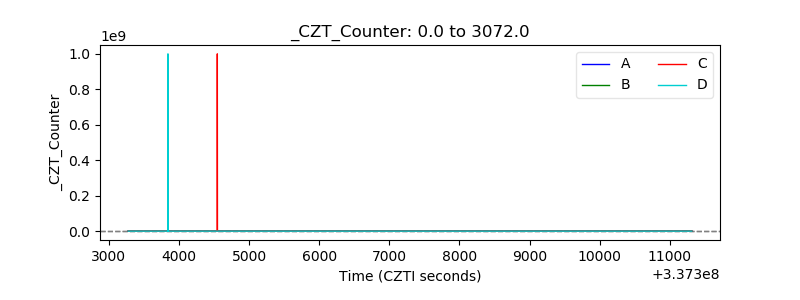 |
| +2.5 Volts monitor | 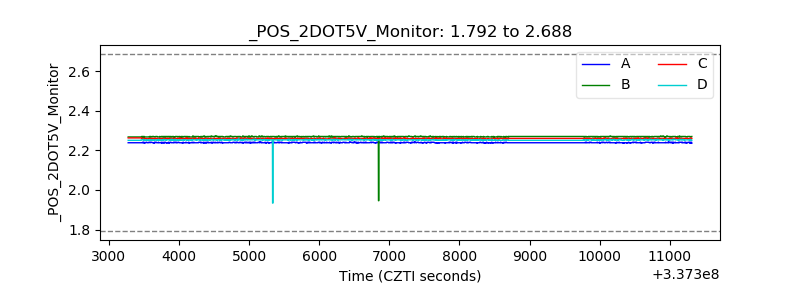 |
| +5 Volts monitor |  |
| _ROLL_ROT | 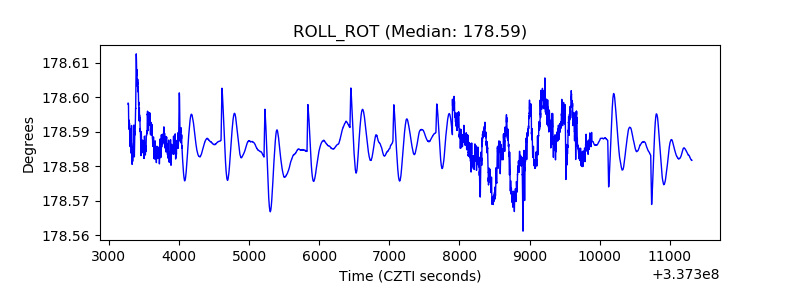 |
| _Roll_DEC | 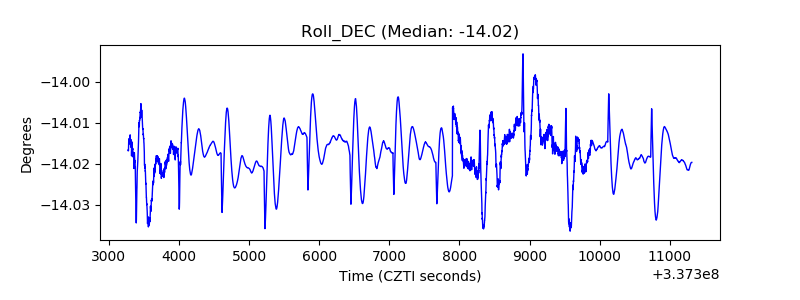 |
| _Roll_RA | 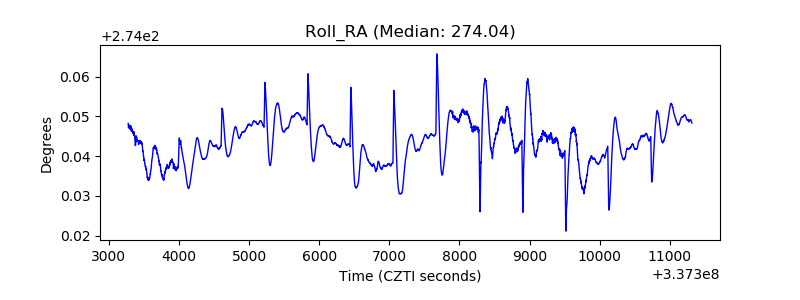 |
| Veto Counter | 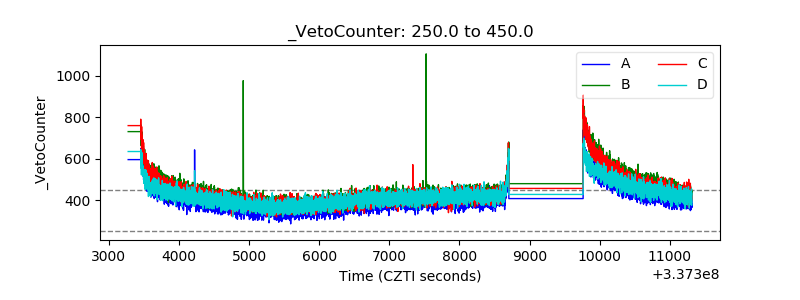 |