| Param | Original file | Final file |
|---|---|---|
| Filename | modeM0/AS1A09_044T02_9000003852_26761cztM0_level2.evt | modeM0/AS1A09_044T02_9000003852_26761cztM0_level2_quad_clean.evt |
| Size (bytes) | 676,252,800 | 52,562,880 |
| Size | 644.9 MB | 50.1 MB |
| Events in quadrant A | 3,161,828 | 344,371 |
| Events in quadrant B | 6,331,649 | 210,470 |
| Events in quadrant C | 3,382,665 | 329,735 |
| Events in quadrant D | 7,190,129 | 277,883 |
| Mode M9 | |||
|---|---|---|---|
| Quadrant | BADHDUFLAG | Total packets | Discarded packets |
| A | 0 | 12 | 0 |
| B | 0 | 12 | 0 |
| C | 0 | 12 | 0 |
| D | 0 | 12 | 0 |
| Mode M0 | |||
|---|---|---|---|
| Quadrant | BADHDUFLAG | Total packets | Discarded packets |
| A | 0 | 13059 | 0 |
| B | 0 | 22681 | 0 |
| C | 0 | 13788 | 0 |
| D | 0 | 25570 | 0 |
| Quadrant | Total seconds | Saturated seconds | Saturation percentage |
|---|---|---|---|
| A | 6126 | 24 | 0.391773% |
| B | 6126 | 1387 | 22.641201% |
| C | 6127 | 104 | 1.697405% |
| D | 6127 | 1190 | 19.422229% |
Noise dominated data is calculated using 1-second bins in cleaned event files. If a bin has >2000 counts, and if more than 50% of those come from <1% of pixels, then it is considered to be noise-dominated and hence unusable.
| Quadrant | # 1 sec bins | Bins with >0 counts | Bins with >2000 counts | High rate bins dominated by noise | Noise dominated (total time) | Noise dominated (detector-on time) | Marked lightcurve |
|---|---|---|---|---|---|---|---|
| A | 7301 | 6127 | 0 | 0 | 0.00% | 0.00% | 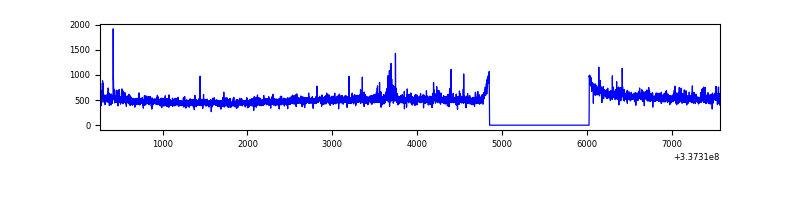 |
| B | 7301 | 6126 | 1258 | 1258 | 17.23% | 20.54% | 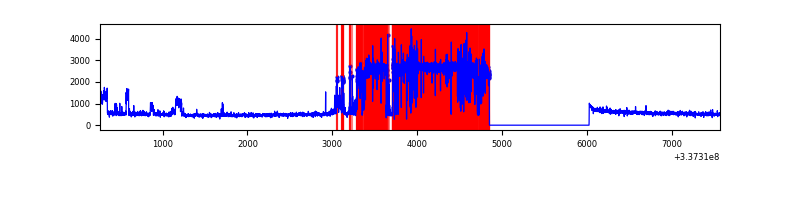 |
| C | 7302 | 6128 | 21 | 21 | 0.29% | 0.34% | 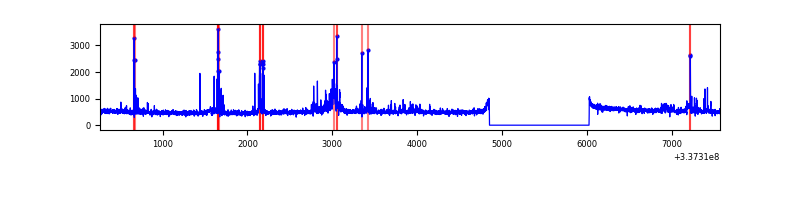 |
| D | 7302 | 6128 | 1005 | 1005 | 13.76% | 16.40% | 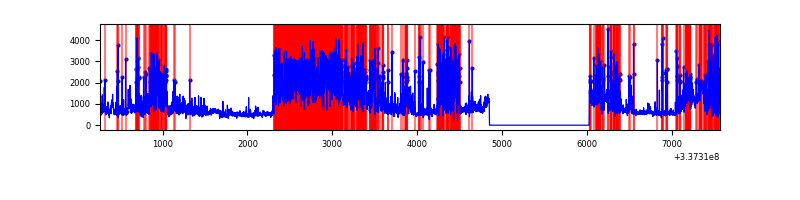 |
Top three noisy pixels from each quadrant. If the there are fewer than three noisy pixels in the level2.evt file, extra rows are filled as -1
| Pixel properties | Quadrant properties | ||||||
|---|---|---|---|---|---|---|---|
| Quadrant | DetID | PixID | Counts | Sigma | Mean | Median | Sigma |
| A | 0 | 13 | 87309 | 547.17 | 795 | 780 | 158.1 |
| A | 13 | 254 | 9988 | 58.23 | 795 | 780 | 158.1 |
| A | 12 | 96 | 7374 | 41.7 | 795 | 780 | 158.1 |
| B | 0 | 189 | 3630300 | 28605.67 | 682 | 669 | 126.9 |
| B | 12 | 111 | 15385 | 115.98 | 682 | 669 | 126.9 |
| B | 11 | 111 | 13900 | 104.28 | 682 | 669 | 126.9 |
| C | 2 | 16 | 223409 | 1263.84 | 755 | 761 | 176.2 |
| C | 14 | 238 | 123122 | 694.57 | 755 | 761 | 176.2 |
| C | 15 | 208 | 51064 | 285.54 | 755 | 761 | 176.2 |
| D | 7 | 80 | 4074061 | 23617.45 | 709 | 692 | 172.5 |
| D | 1 | 52 | 308156 | 1782.68 | 709 | 692 | 172.5 |
| D | 12 | 227 | 72218 | 414.71 | 709 | 692 | 172.5 |
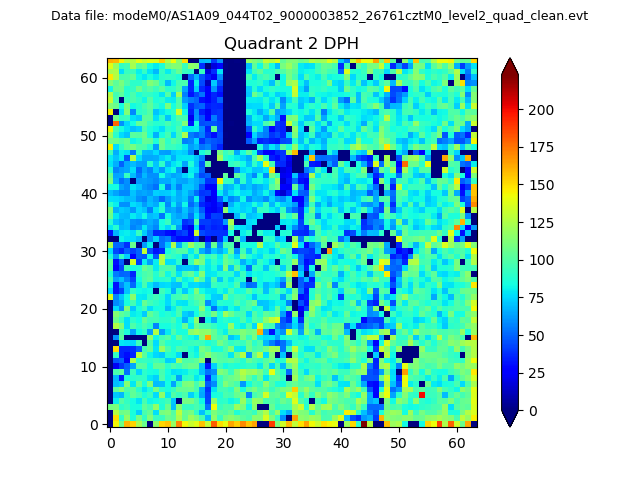
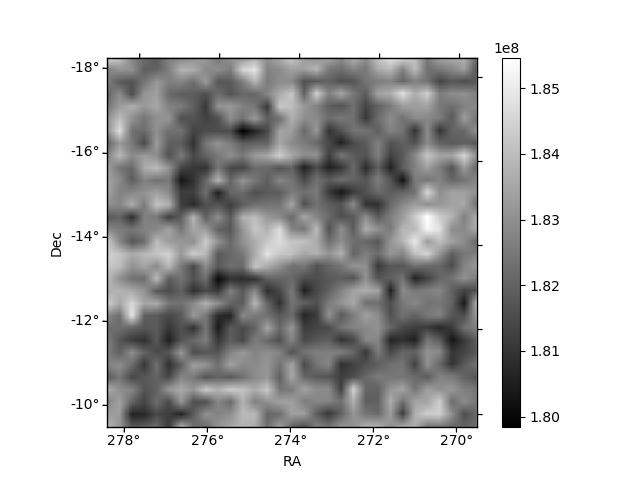
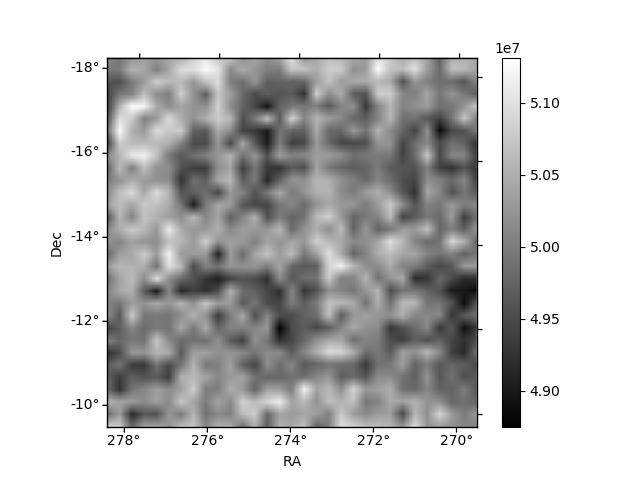
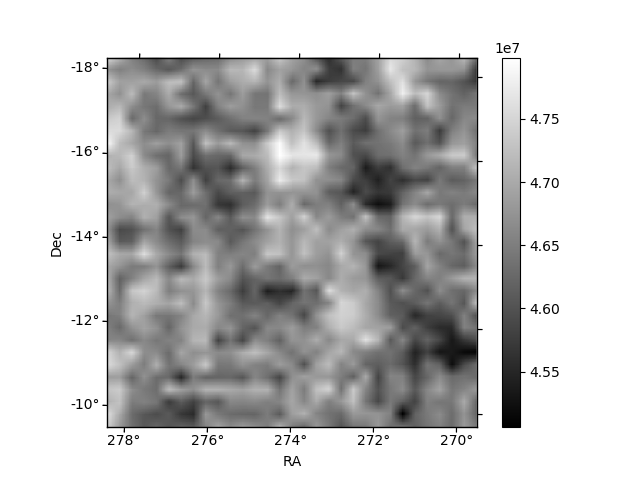
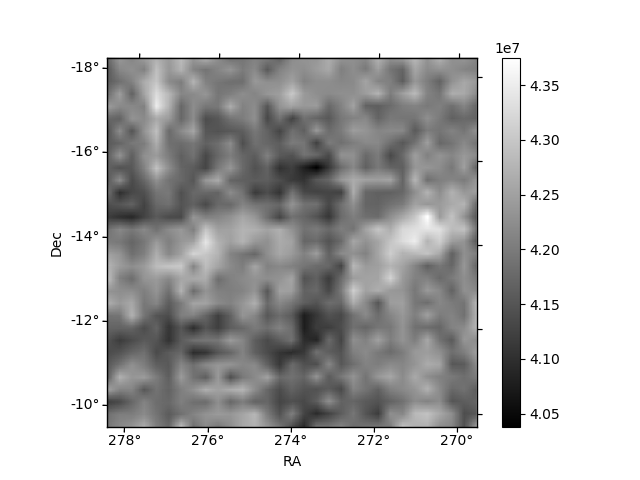
Histogram calculated using DETX and DETY for each event in the final _common_clean file
| Quadrant A | 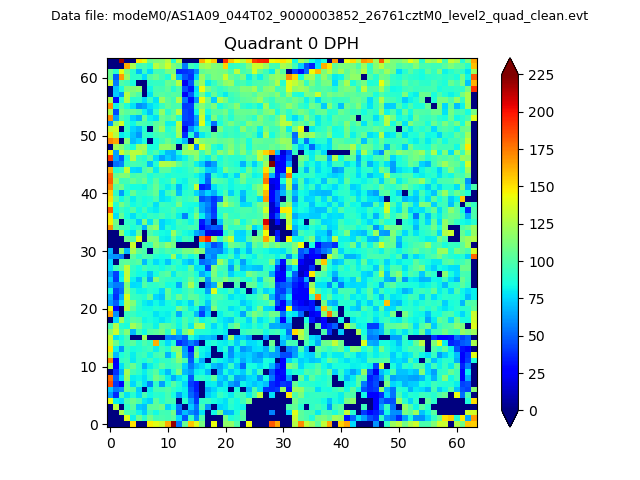 |
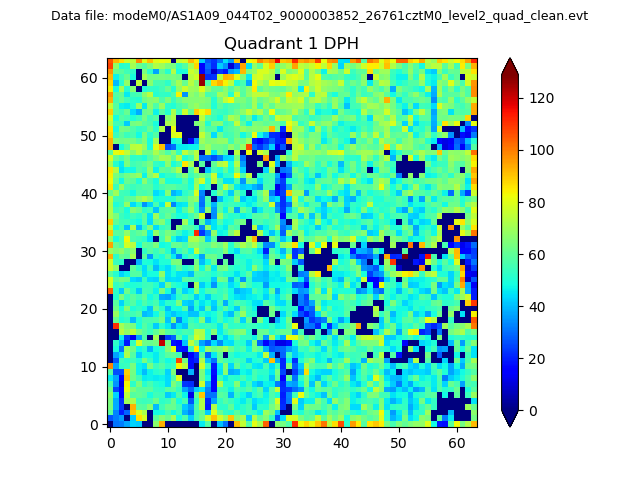 |
Quadrant B |
|---|---|---|---|
| Quadrant D | 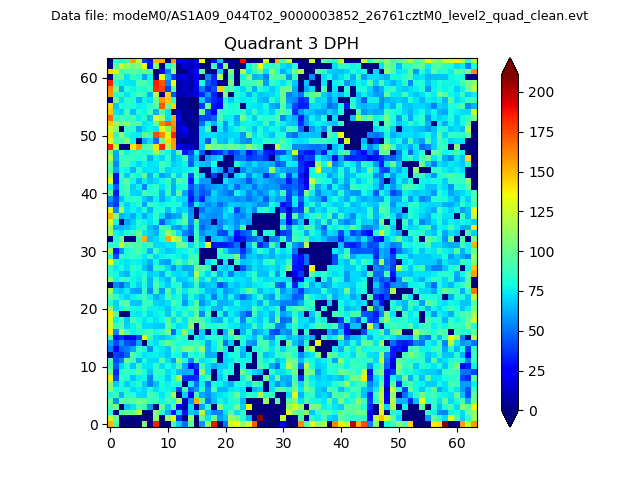 |
 |
Quadrant C |
| Plot type | Count rate plots | Images |
|---|---|---|
| Comparison with Poisson distribution Blue bars denote a histogram of data divided into 1 sec bins. Red curve is a Poisson curve with rate = median count rate of data. |
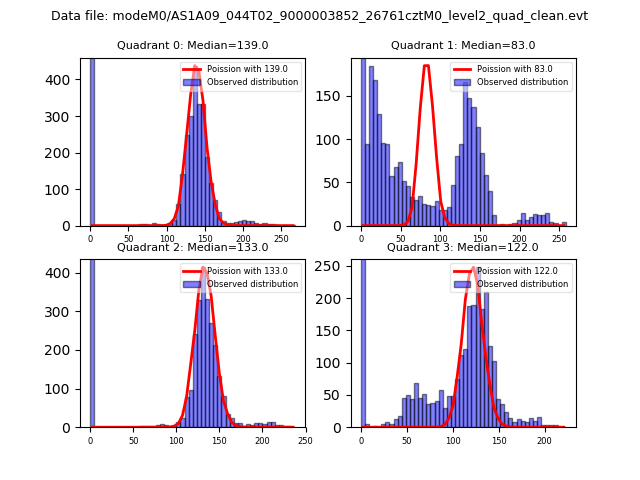 |
 |
| Quadrant-wise count rates Data is divided into 100 sec bins |
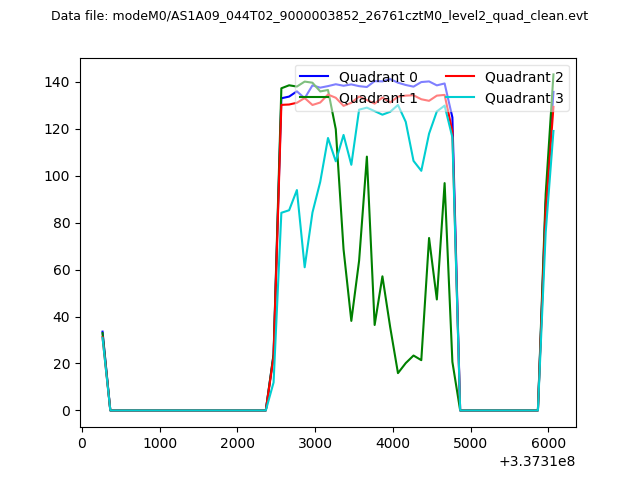 |
|
| Module-wise count rates for Quadrant A Data is divided into 100 sec bins |
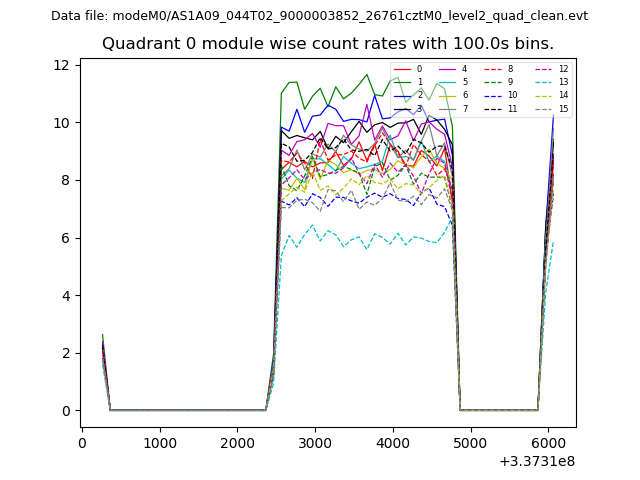 |
 |
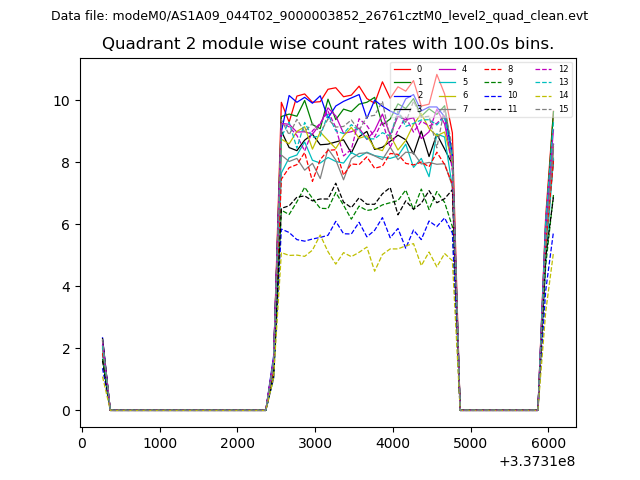
| Module-wise count rates for Quadrant B Data is divided into 100 sec bins |
 |
 |
| Module-wise count rates for Quadrant C Data is divided into 100 sec bins |
 |
 |
| Module-wise count rates for Quadrant D Data is divided into 100 sec bins |
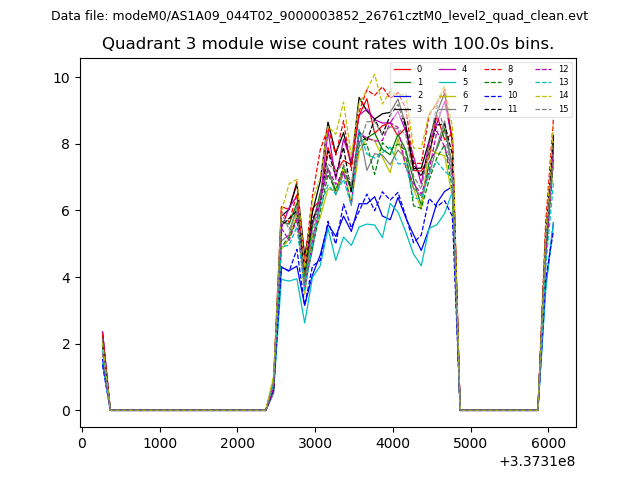 |
 |
| Parameter | Plot |
|---|---|
| CZT HV Monitor |  |
| D_VDD | 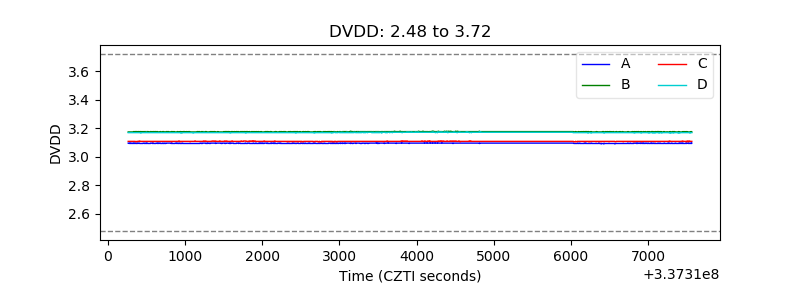 |
| Temperature 1 | 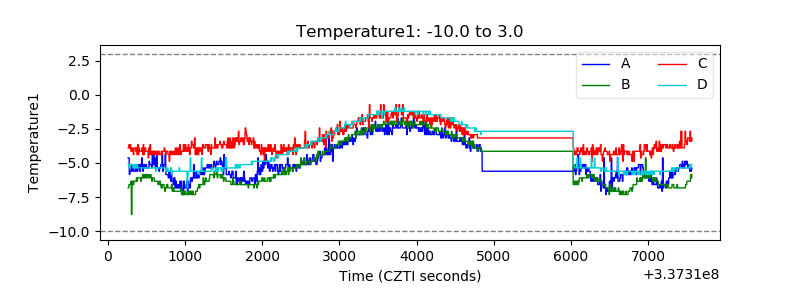 |
| Veto HV Monitor | 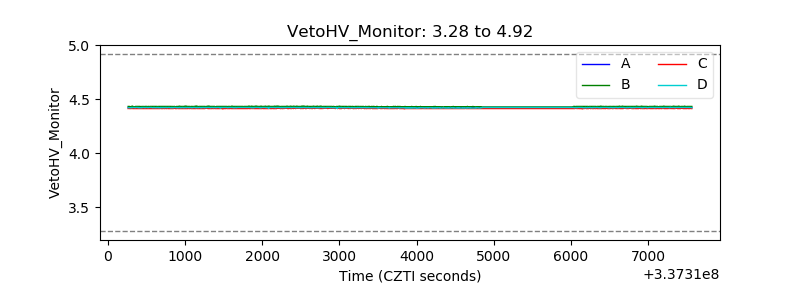 |
| Veto LLD | 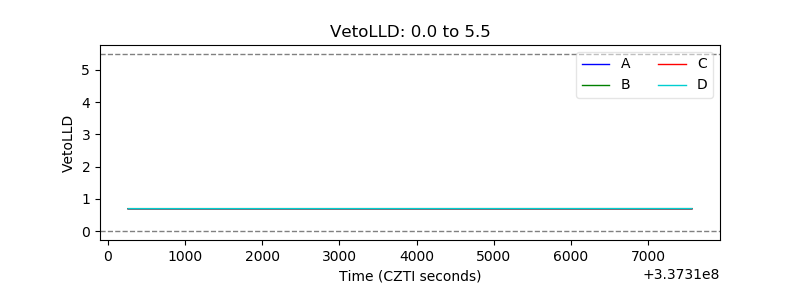 |
| Alpha Counter | 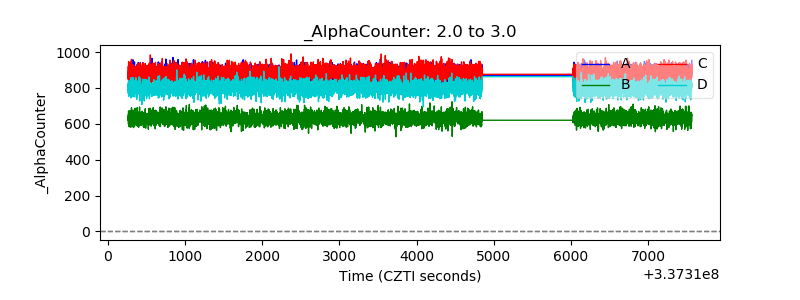 |
| _CPM_Rate | 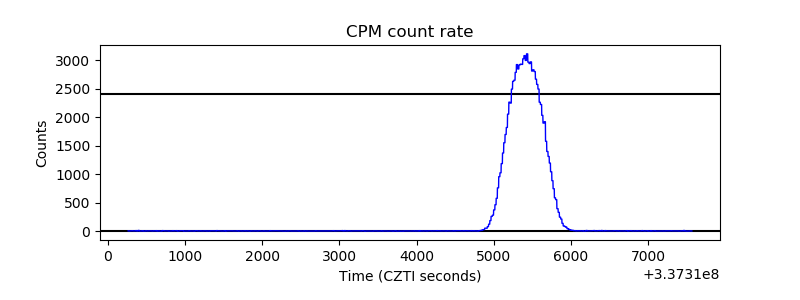 |
| CZT Counter | 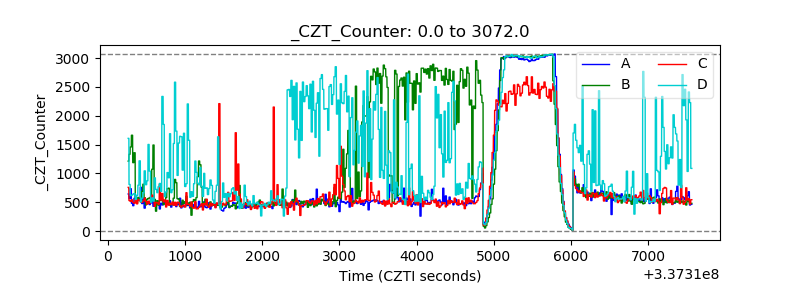 |
| +2.5 Volts monitor |  |
| +5 Volts monitor |  |
| _ROLL_ROT | 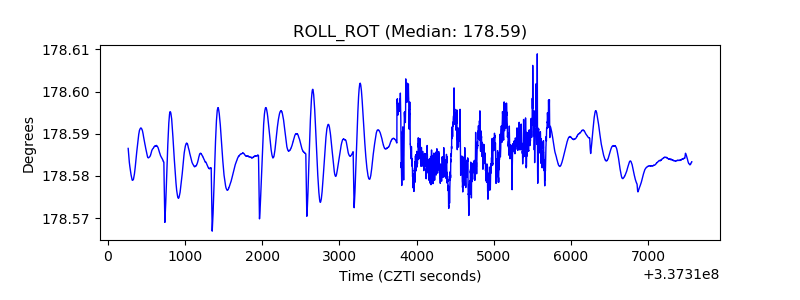 |
| _Roll_DEC | 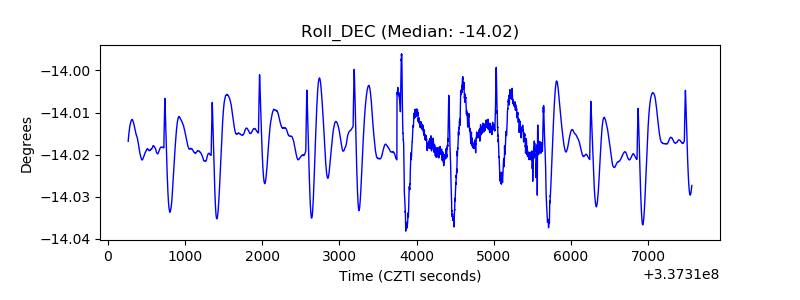 |
| _Roll_RA | 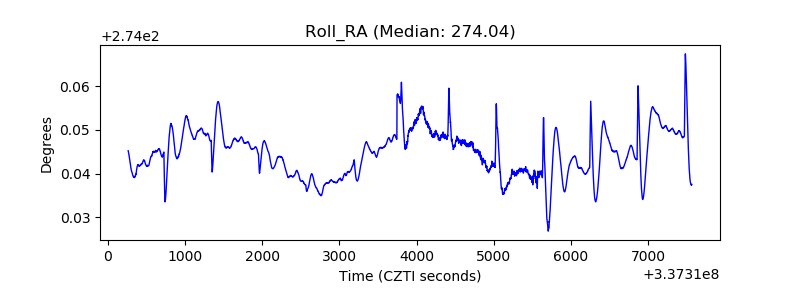 |
| Veto Counter | 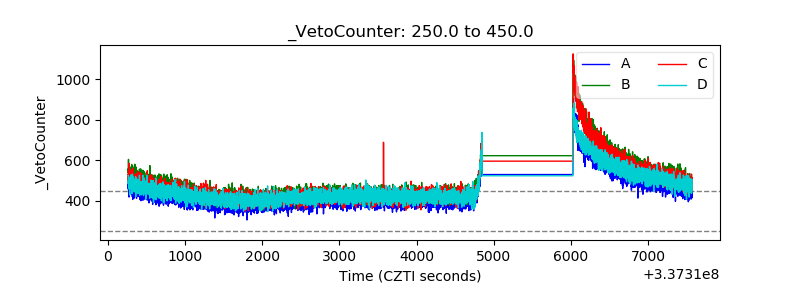 |