| Param | Original file | Final file |
|---|---|---|
| Filename | modeM0/AS1A09_044T02_9000003852_26762cztM0_level2.evt | modeM0/AS1A09_044T02_9000003852_26762cztM0_level2_quad_clean.evt |
| Size (bytes) | 707,644,800 | 61,914,240 |
| Size | 674.9 MB | 59.0 MB |
| Events in quadrant A | 3,900,641 | 396,122 |
| Events in quadrant B | 5,855,313 | 317,448 |
| Events in quadrant C | 3,546,249 | 380,331 |
| Events in quadrant D | 7,700,057 | 336,845 |
| Mode M9 | |||
|---|---|---|---|
| Quadrant | BADHDUFLAG | Total packets | Discarded packets |
| A | 0 | 12 | 0 |
| B | 0 | 12 | 0 |
| C | 0 | 12 | 0 |
| D | 0 | 12 | 0 |
| Mode M0 | |||
|---|---|---|---|
| Quadrant | BADHDUFLAG | Total packets | Discarded packets |
| A | 0 | 15785 | 0 |
| B | 0 | 21472 | 0 |
| C | 0 | 14432 | 0 |
| D | 0 | 27215 | 0 |
| Quadrant | Total seconds | Saturated seconds | Saturation percentage |
|---|---|---|---|
| A | 6347 | 29 | 0.456909% |
| B | 6345 | 1044 | 16.453901% |
| C | 6348 | 100 | 1.575299% |
| D | 6344 | 1213 | 19.120429% |
Noise dominated data is calculated using 1-second bins in cleaned event files. If a bin has >2000 counts, and if more than 50% of those come from <1% of pixels, then it is considered to be noise-dominated and hence unusable.
| Quadrant | # 1 sec bins | Bins with >0 counts | Bins with >2000 counts | High rate bins dominated by noise | Noise dominated (total time) | Noise dominated (detector-on time) | Marked lightcurve |
|---|---|---|---|---|---|---|---|
| A | 7614 | 6349 | 0 | 0 | 0.00% | 0.00% | 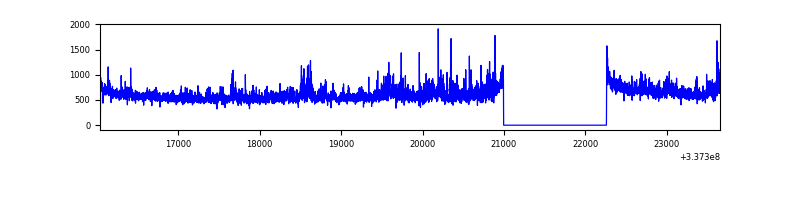 |
| B | 7616 | 6350 | 839 | 839 | 11.02% | 13.21% | 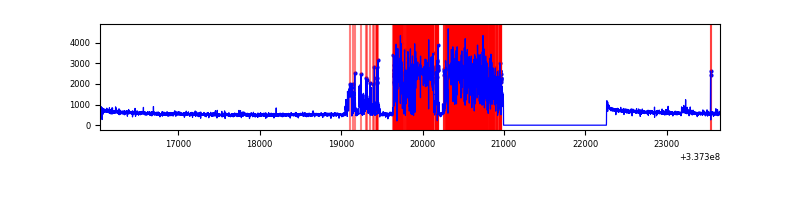 |
| C | 7616 | 6352 | 3 | 3 | 0.04% | 0.05% | 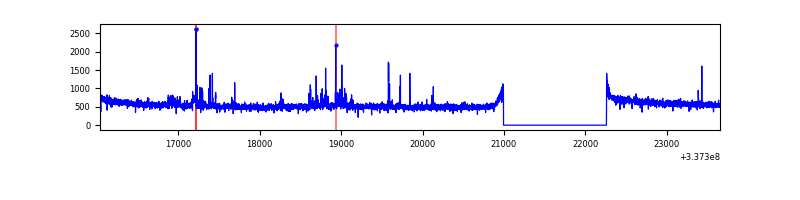 |
| D | 7612 | 6348 | 1078 | 1078 | 14.16% | 16.98% | 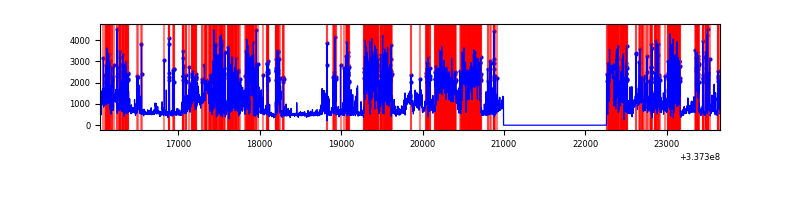 |
Top three noisy pixels from each quadrant. If the there are fewer than three noisy pixels in the level2.evt file, extra rows are filled as -1
| Pixel properties | Quadrant properties | ||||||
|---|---|---|---|---|---|---|---|
| Quadrant | DetID | PixID | Counts | Sigma | Mean | Median | Sigma |
| A | 0 | 13 | 453623 | 2562.62 | 888 | 874 | 176.7 |
| A | 12 | 96 | 23785 | 129.68 | 888 | 874 | 176.7 |
| A | 13 | 254 | 10396 | 53.9 | 888 | 874 | 176.7 |
| B | 0 | 189 | 2515550 | 16571.93 | 824 | 810 | 151.7 |
| B | 10 | 246 | 91565 | 598.07 | 824 | 810 | 151.7 |
| B | 12 | 111 | 17810 | 112.03 | 824 | 810 | 151.7 |
| C | 14 | 238 | 138869 | 711.27 | 843 | 851 | 194.0 |
| C | 2 | 16 | 49863 | 252.58 | 843 | 851 | 194.0 |
| C | 10 | 22 | 48760 | 246.9 | 843 | 851 | 194.0 |
| D | 7 | 80 | 4493416 | 23394.2 | 788 | 771 | 192.0 |
| D | 1 | 52 | 91287 | 471.34 | 788 | 771 | 192.0 |
| D | 12 | 227 | 60641 | 311.76 | 788 | 771 | 192.0 |
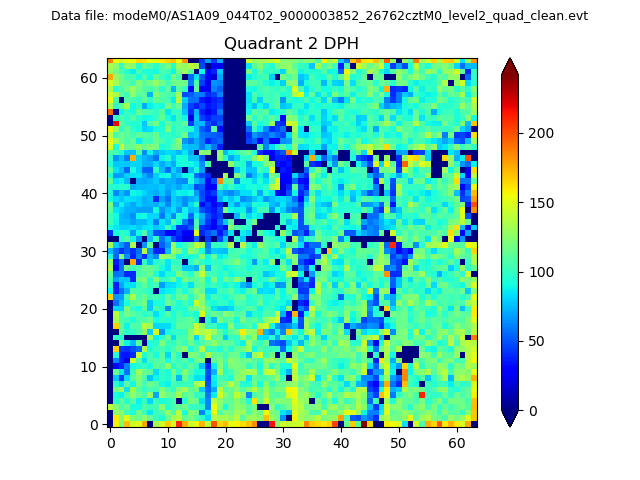
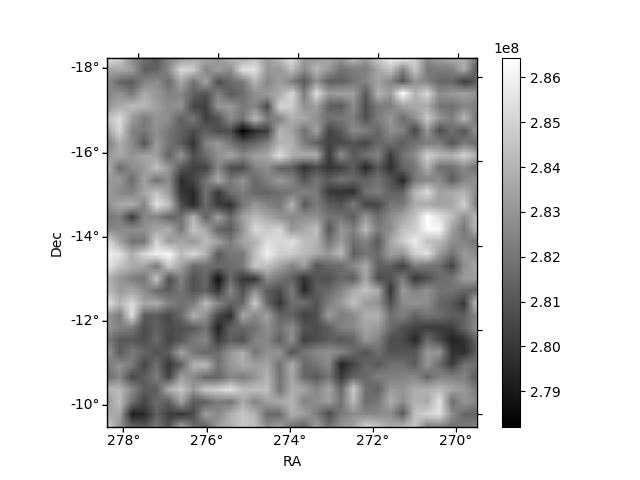
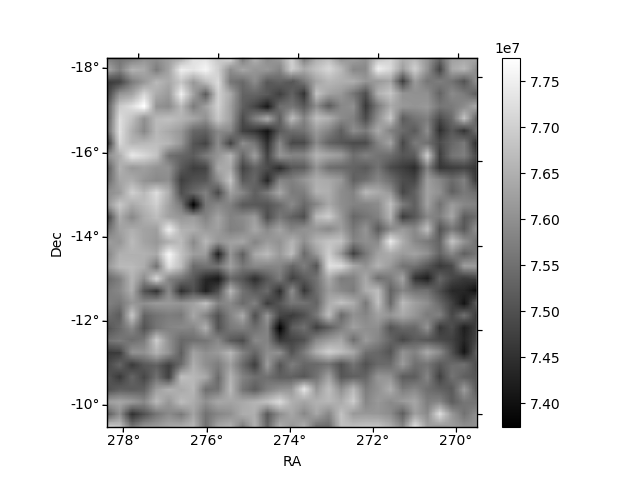
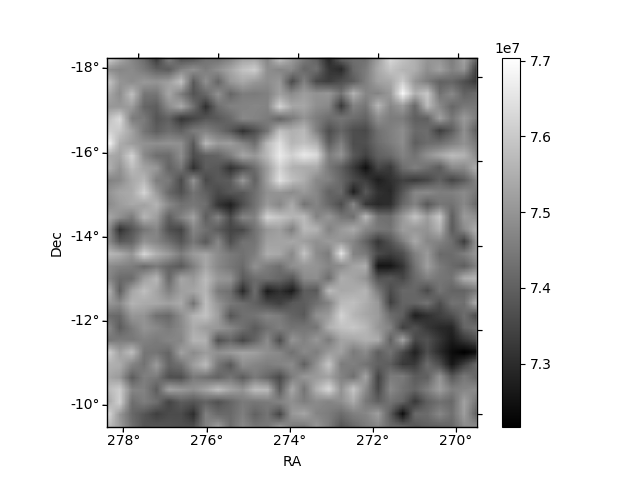
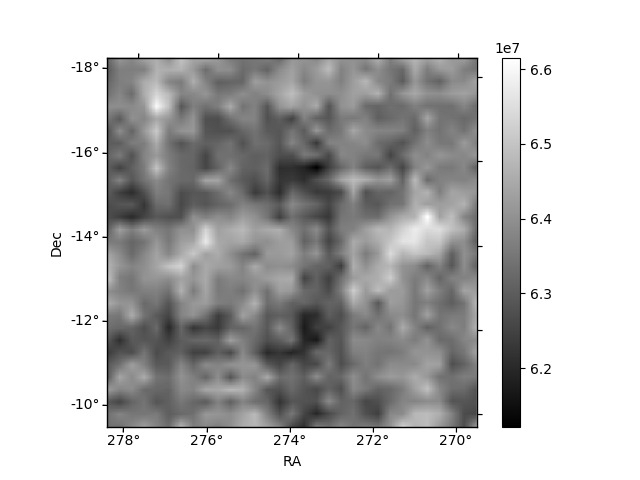
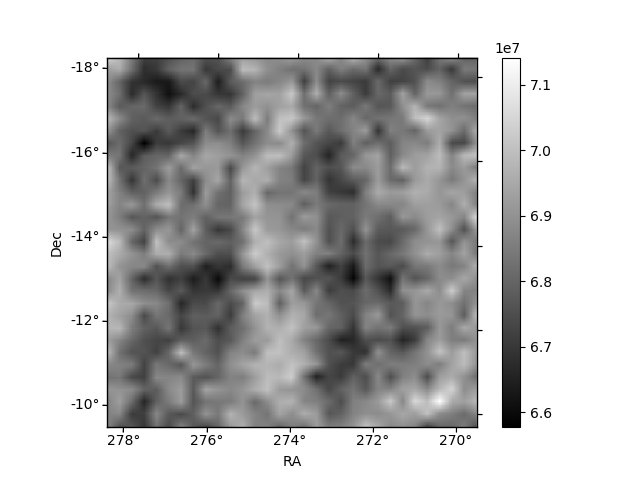
Histogram calculated using DETX and DETY for each event in the final _common_clean file
| Quadrant A | 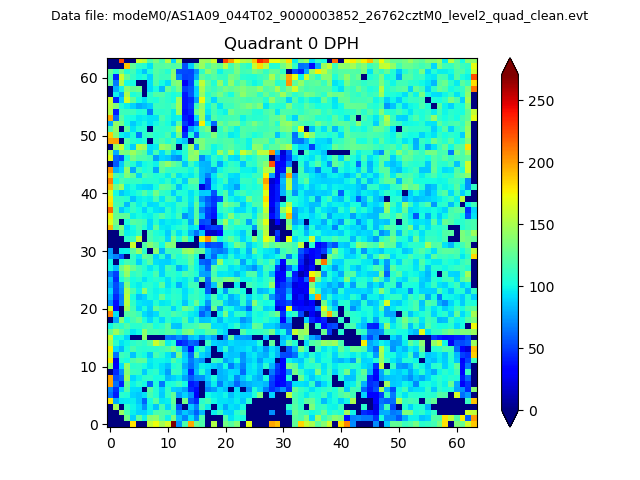 |
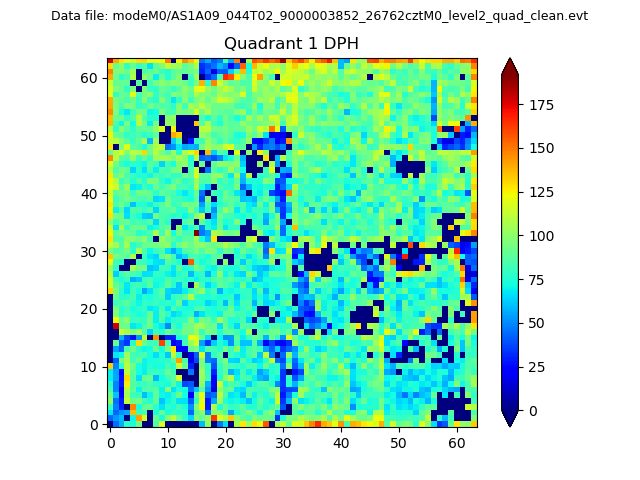 |
Quadrant B |
|---|---|---|---|
| Quadrant D | 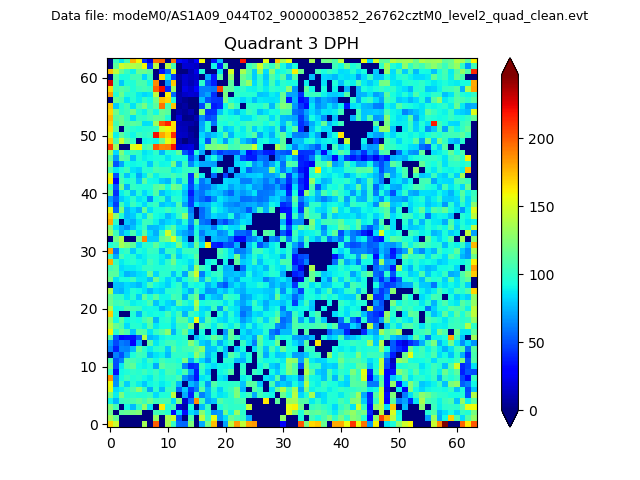 |
 |
Quadrant C |
| Plot type | Count rate plots | Images |
|---|---|---|
| Comparison with Poisson distribution Blue bars denote a histogram of data divided into 1 sec bins. Red curve is a Poisson curve with rate = median count rate of data. |
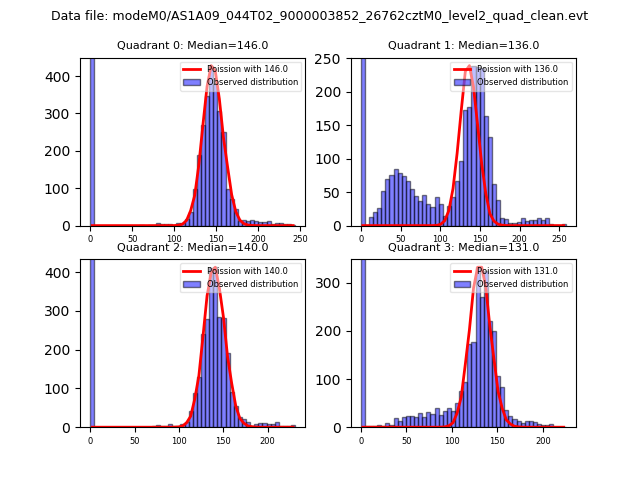 |
 |
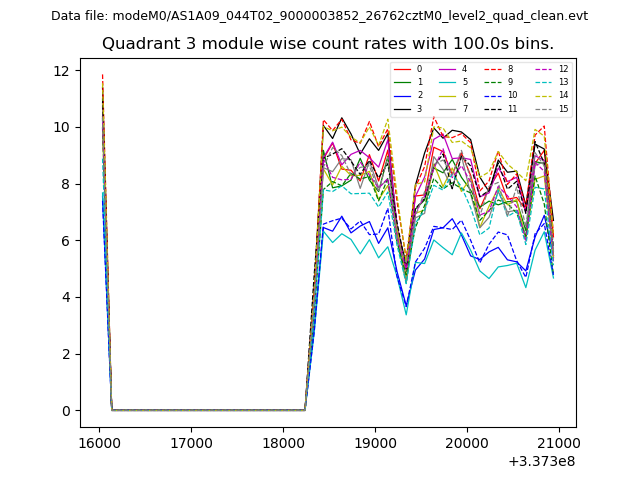
| Quadrant-wise count rates Data is divided into 100 sec bins |
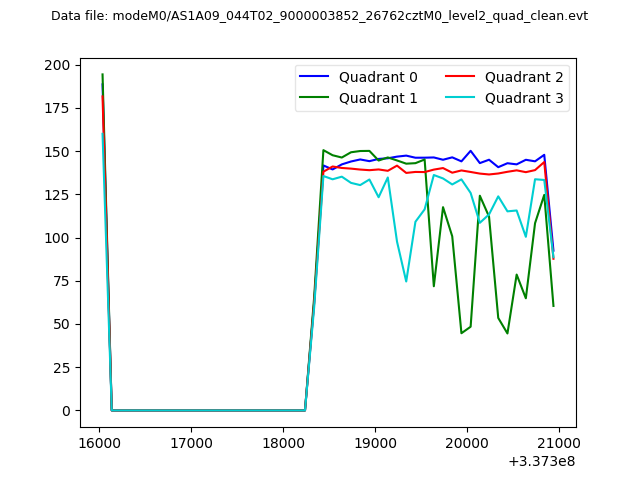 |
|
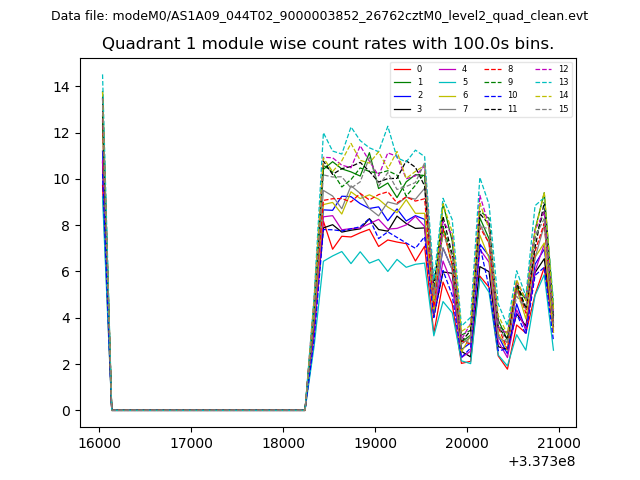
| Module-wise count rates for Quadrant A Data is divided into 100 sec bins |
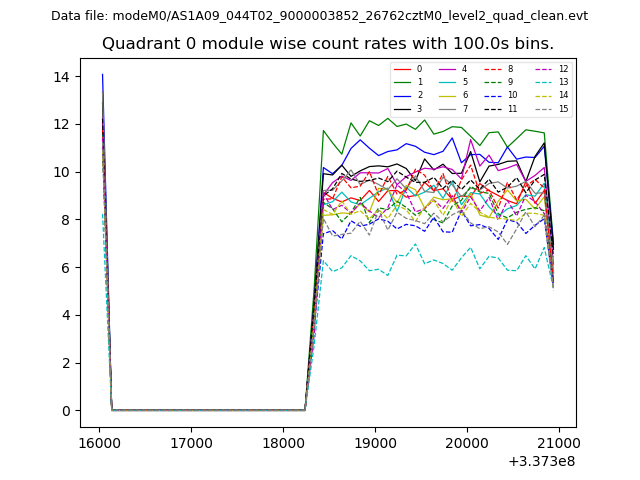 |
 |
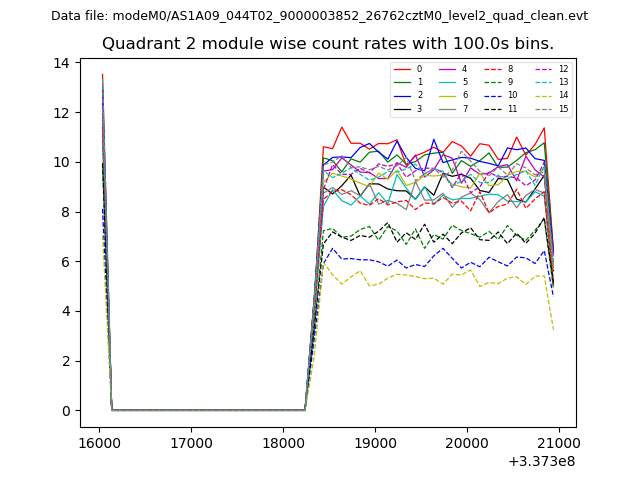
| Module-wise count rates for Quadrant B Data is divided into 100 sec bins |
 |
 |
| Module-wise count rates for Quadrant C Data is divided into 100 sec bins |
 |
 |
| Module-wise count rates for Quadrant D Data is divided into 100 sec bins |
 |
 |
| Parameter | Plot |
|---|---|
| CZT HV Monitor | 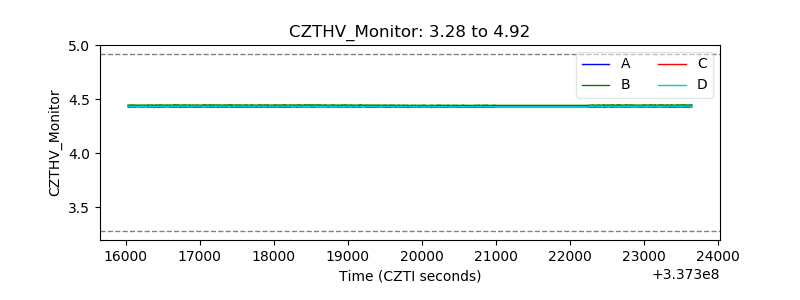 |
| D_VDD | 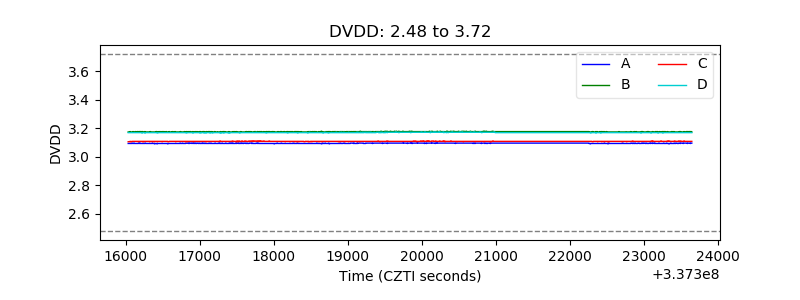 |
| Temperature 1 | 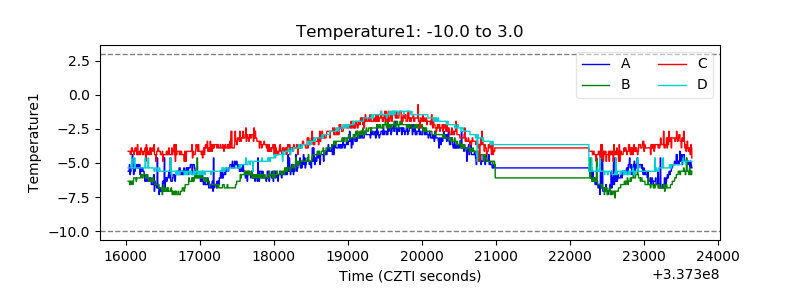 |
| Veto HV Monitor | 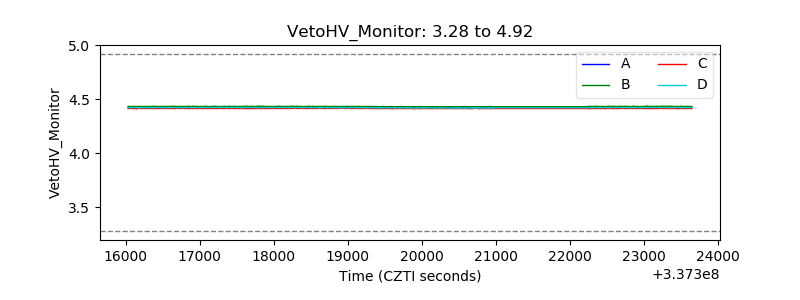 |
| Veto LLD | 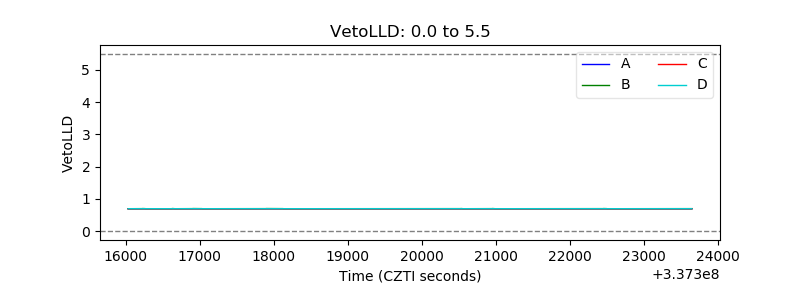 |
| Alpha Counter | 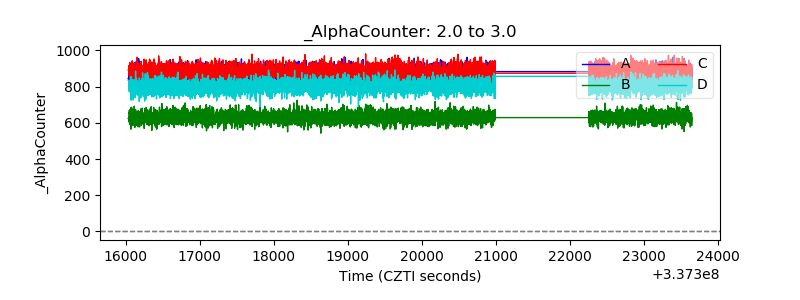 |
| _CPM_Rate | 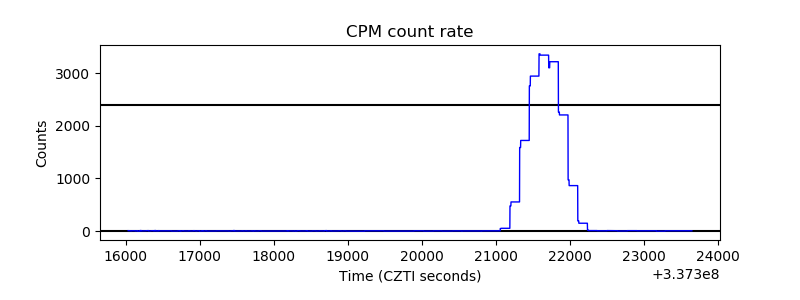 |
| CZT Counter | 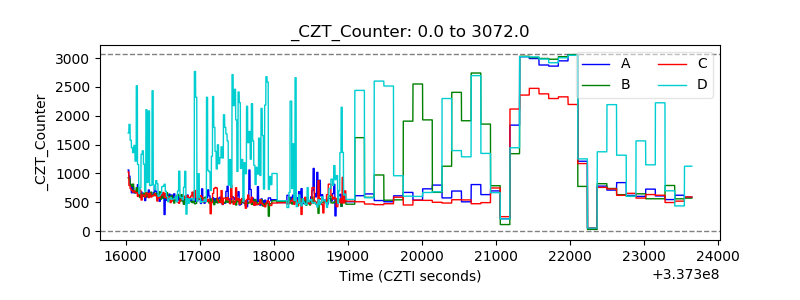 |
| +2.5 Volts monitor | 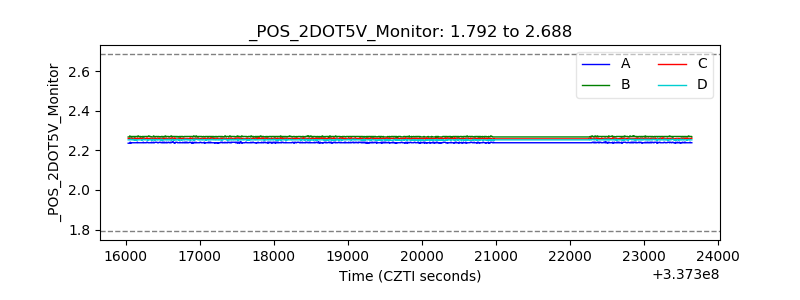 |
| +5 Volts monitor | 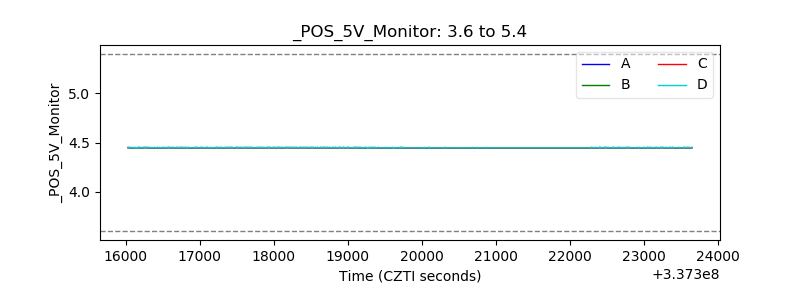 |
| _ROLL_ROT | 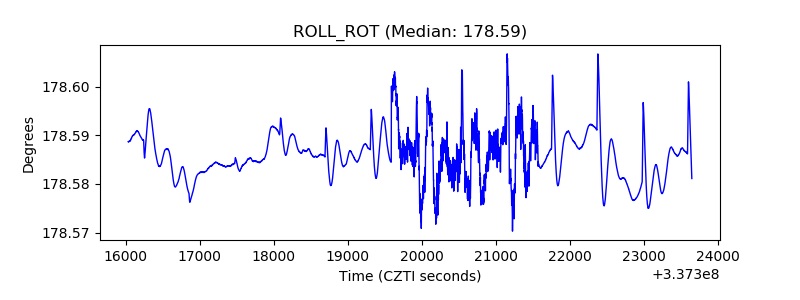 |
| _Roll_DEC | 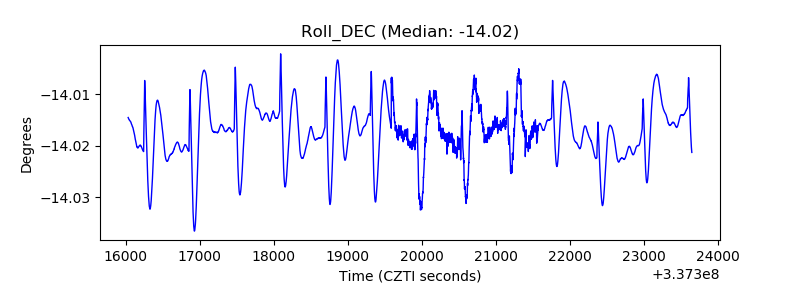 |
| _Roll_RA | 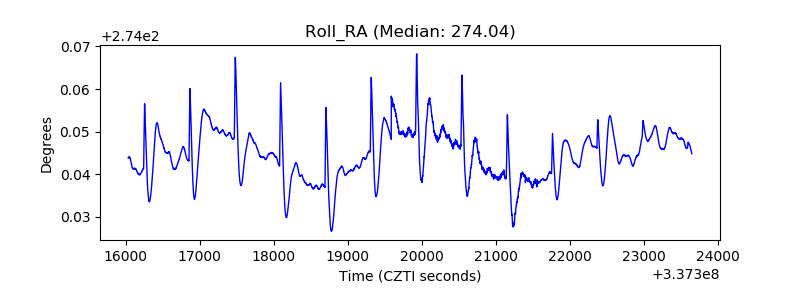 |
| Veto Counter | 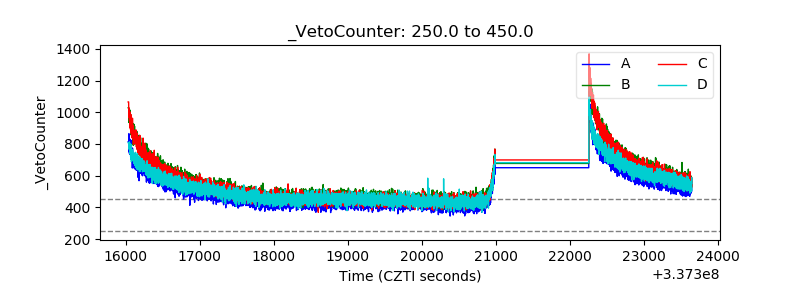 |