| Param | Original file | Final file |
|---|---|---|
| Filename | modeM0/AS1A09_044T02_9000003852_26763cztM0_level2.evt | modeM0/AS1A09_044T02_9000003852_26763cztM0_level2_quad_clean.evt |
| Size (bytes) | 741,810,240 | 62,841,600 |
| Size | 707.4 MB | 59.9 MB |
| Events in quadrant A | 4,057,897 | 437,162 |
| Events in quadrant B | 7,697,769 | 240,203 |
| Events in quadrant C | 3,460,096 | 422,020 |
| Events in quadrant D | 6,845,244 | 383,046 |
| Mode M9 | |||
|---|---|---|---|
| Quadrant | BADHDUFLAG | Total packets | Discarded packets |
| A | 0 | 14 | 0 |
| B | 0 | 14 | 0 |
| C | 0 | 14 | 0 |
| D | 0 | 14 | 0 |
| Mode M0 | |||
|---|---|---|---|
| Quadrant | BADHDUFLAG | Total packets | Discarded packets |
| A | 0 | 16688 | 0 |
| B | 0 | 27109 | 0 |
| C | 0 | 14003 | 0 |
| D | 0 | 24570 | 0 |
| Quadrant | Total seconds | Saturated seconds | Saturation percentage |
|---|---|---|---|
| A | 5998 | 46 | 0.766922% |
| B | 5999 | 2010 | 33.505584% |
| C | 5999 | 123 | 2.050342% |
| D | 5999 | 993 | 16.552759% |
Noise dominated data is calculated using 1-second bins in cleaned event files. If a bin has >2000 counts, and if more than 50% of those come from <1% of pixels, then it is considered to be noise-dominated and hence unusable.
| Quadrant | # 1 sec bins | Bins with >0 counts | Bins with >2000 counts | High rate bins dominated by noise | Noise dominated (total time) | Noise dominated (detector-on time) | Marked lightcurve |
|---|---|---|---|---|---|---|---|
| A | 7348 | 5999 | 0 | 0 | 0.00% | 0.00% | 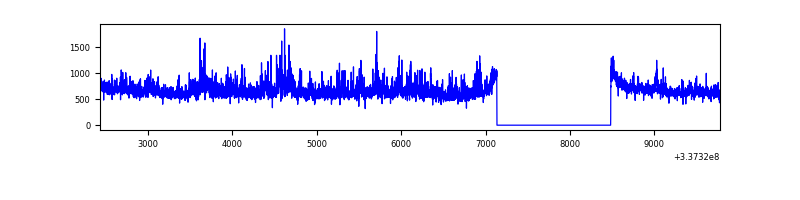 |
| B | 7349 | 5999 | 1789 | 1789 | 24.34% | 29.82% | 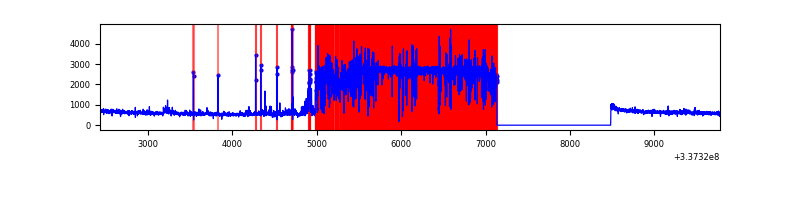 |
| C | 7349 | 6000 | 5 | 5 | 0.07% | 0.08% |  |
| D | 7349 | 6000 | 789 | 789 | 10.74% | 13.15% | 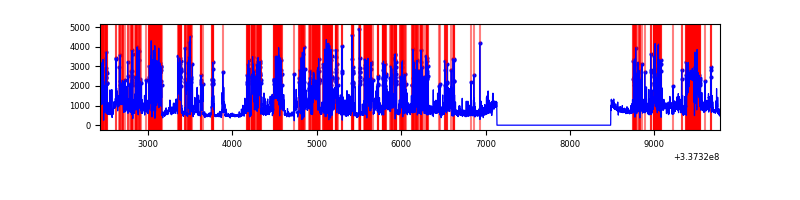 |
Top three noisy pixels from each quadrant. If the there are fewer than three noisy pixels in the level2.evt file, extra rows are filled as -1
| Pixel properties | Quadrant properties | ||||||
|---|---|---|---|---|---|---|---|
| Quadrant | DetID | PixID | Counts | Sigma | Mean | Median | Sigma |
| A | 0 | 13 | 677190 | 3926.71 | 873 | 863 | 172.2 |
| A | 6 | 16 | 10019 | 53.16 | 873 | 863 | 172.2 |
| A | 13 | 254 | 9469 | 49.97 | 873 | 863 | 172.2 |
| B | 0 | 189 | 4887344 | 37535.25 | 710 | 698 | 130.2 |
| B | 12 | 111 | 15005 | 109.89 | 710 | 698 | 130.2 |
| B | 15 | 32 | 14377 | 105.07 | 710 | 698 | 130.2 |
| C | 14 | 238 | 137694 | 725.21 | 826 | 835 | 188.7 |
| C | 2 | 16 | 78708 | 412.64 | 826 | 835 | 188.7 |
| C | 15 | 208 | 21361 | 108.77 | 826 | 835 | 188.7 |
| D | 7 | 80 | 3622557 | 18855.97 | 785 | 769 | 192.1 |
| D | 1 | 52 | 138717 | 718.19 | 785 | 769 | 192.1 |
| D | 2 | 250 | 99990 | 516.57 | 785 | 769 | 192.1 |
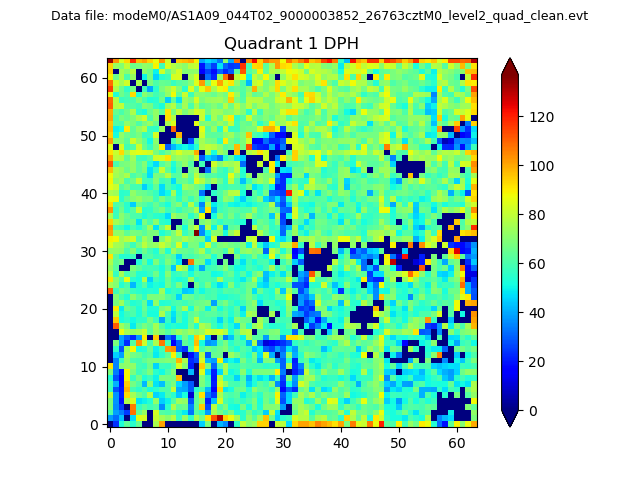
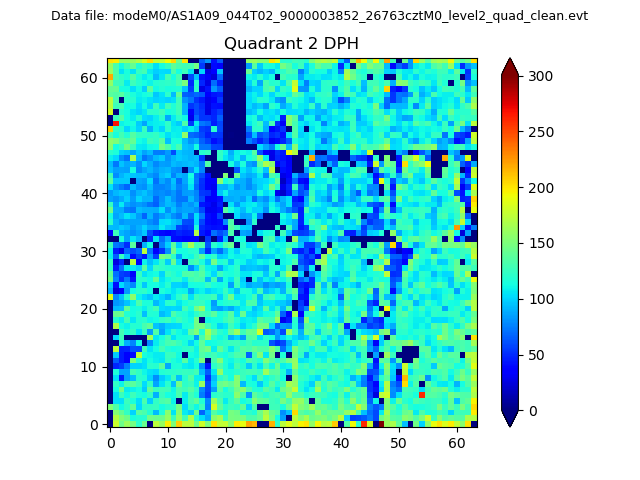
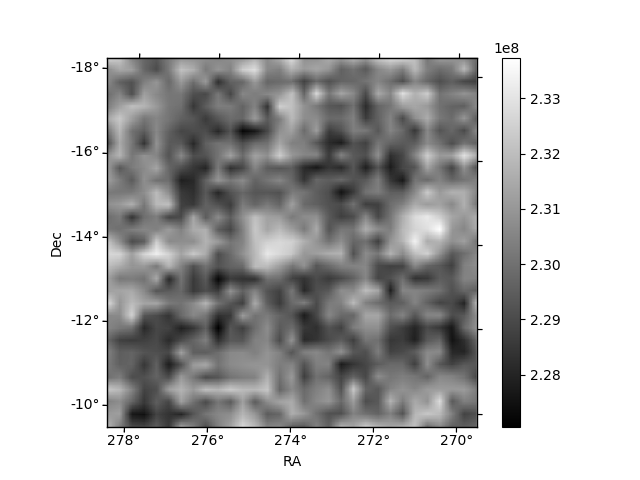
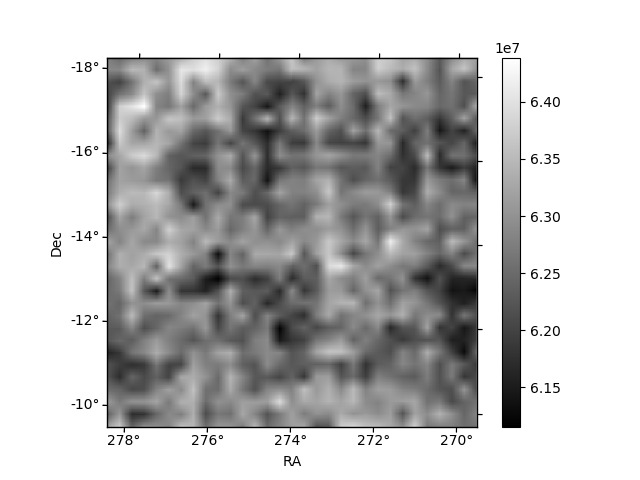
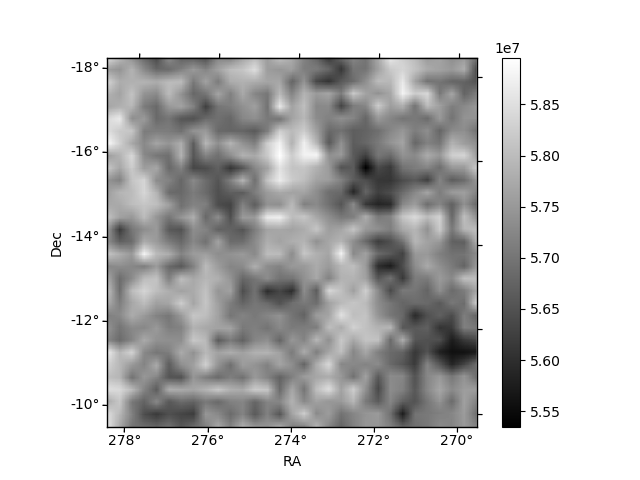
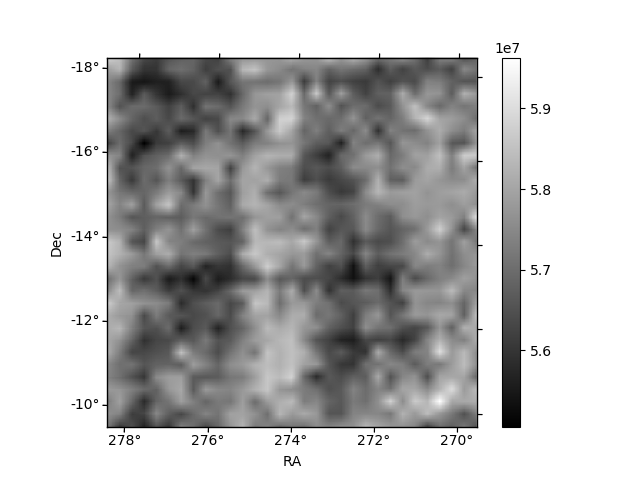
Histogram calculated using DETX and DETY for each event in the final _common_clean file
| Quadrant A | 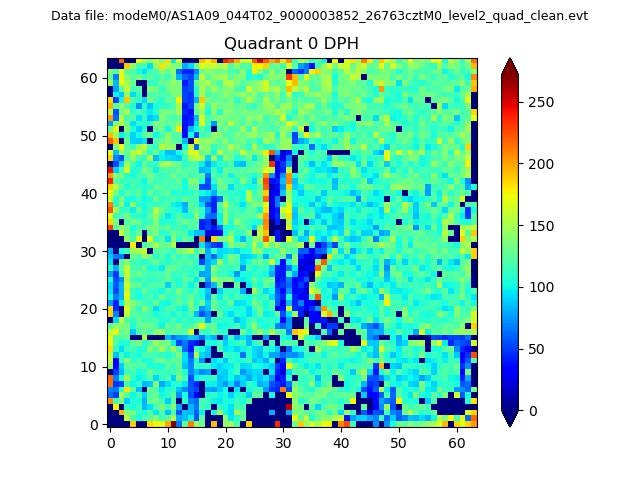 |
 |
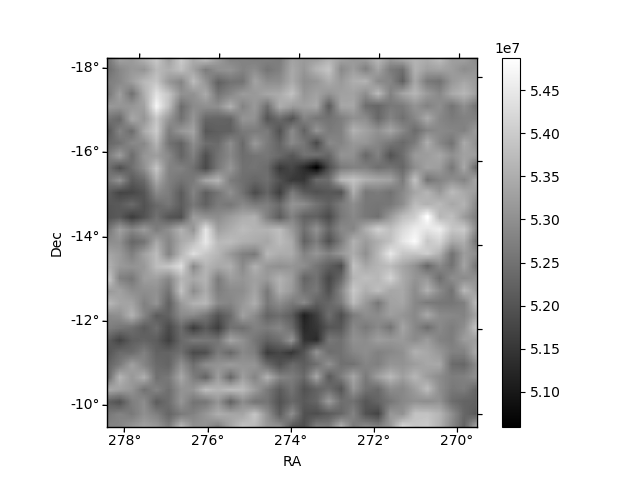
Quadrant B |
|---|---|---|---|
| Quadrant D | 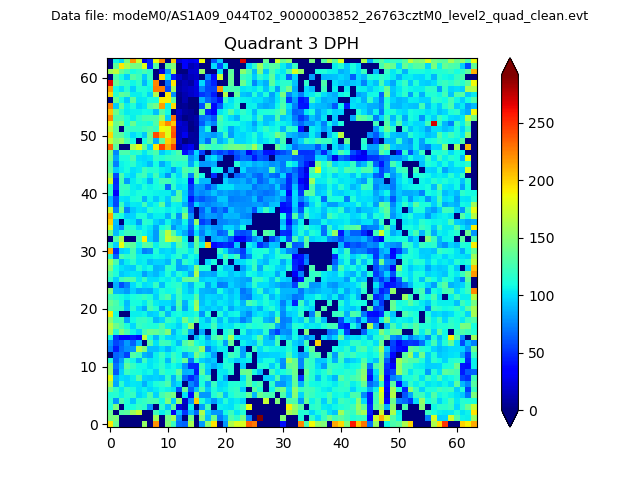 |
 |
Quadrant C |
| Plot type | Count rate plots | Images |
|---|---|---|
| Comparison with Poisson distribution Blue bars denote a histogram of data divided into 1 sec bins. Red curve is a Poisson curve with rate = median count rate of data. |
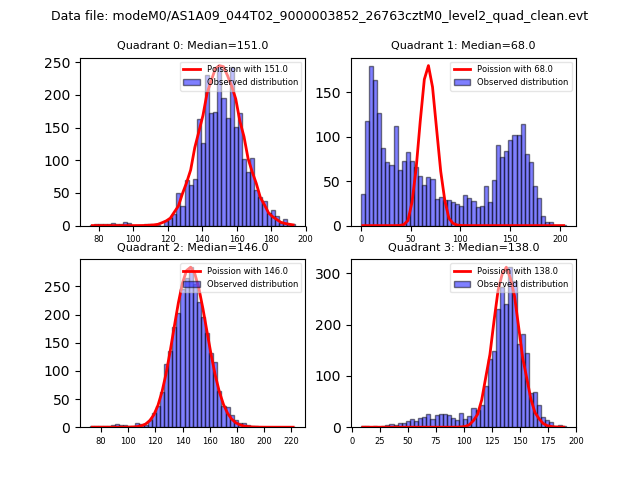 |
 |
| Quadrant-wise count rates Data is divided into 100 sec bins |
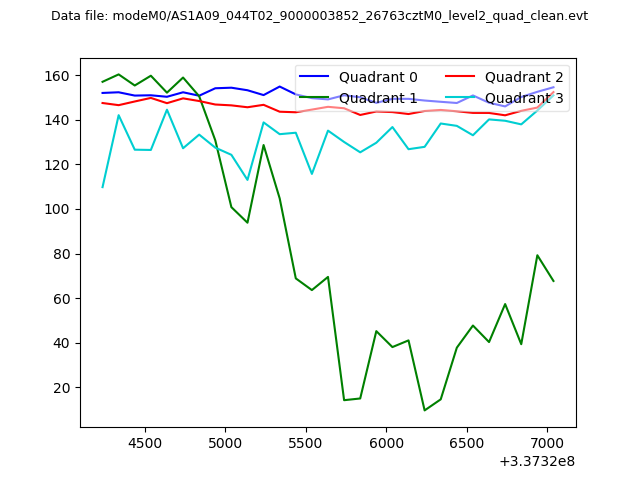 |
|
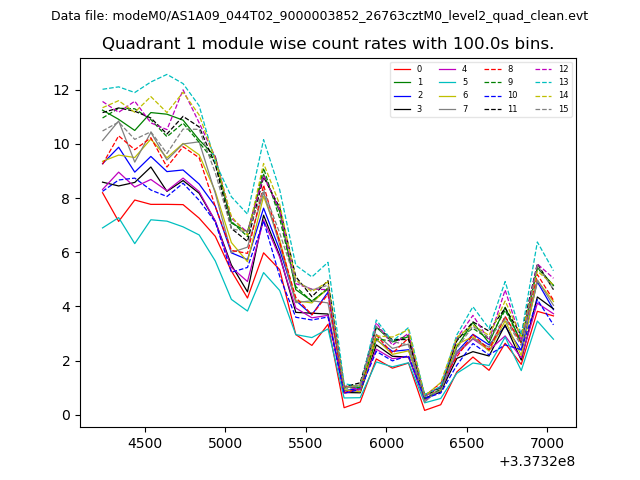
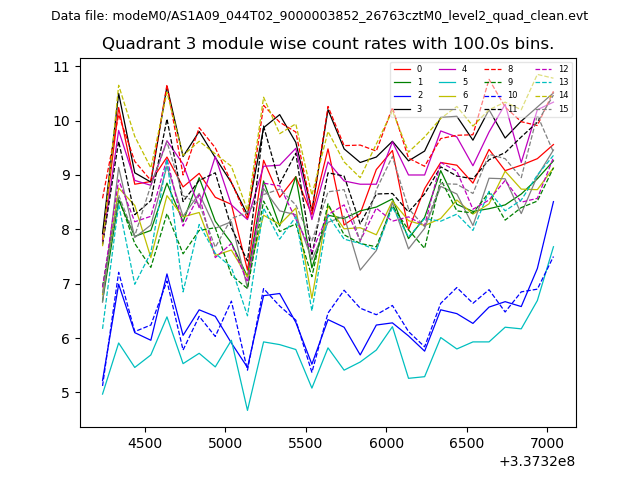
| Module-wise count rates for Quadrant A Data is divided into 100 sec bins |
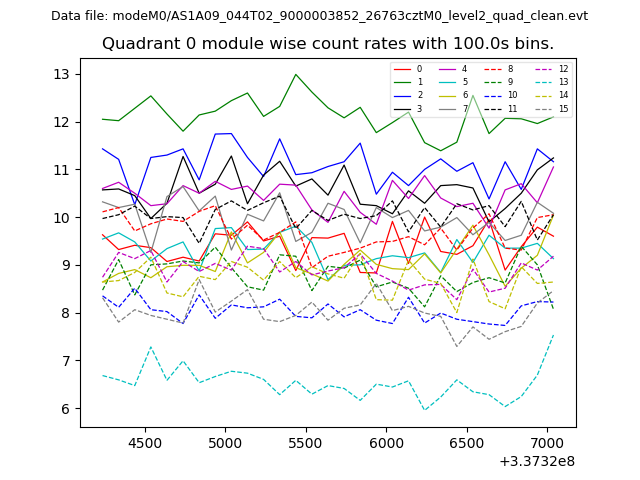 |
 |
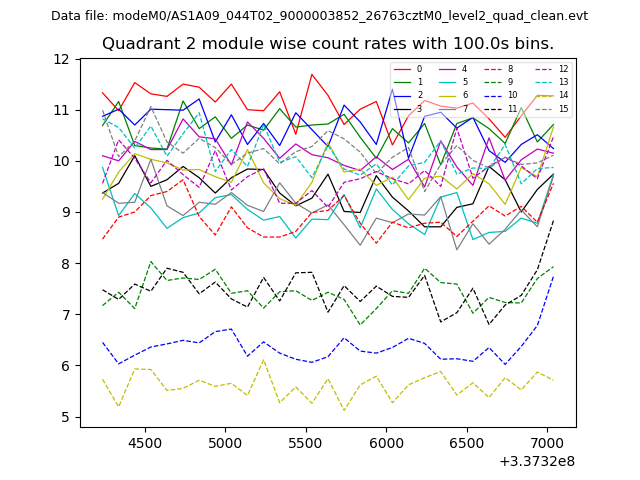
| Module-wise count rates for Quadrant B Data is divided into 100 sec bins |
 |
 |
| Module-wise count rates for Quadrant C Data is divided into 100 sec bins |
 |
 |
| Module-wise count rates for Quadrant D Data is divided into 100 sec bins |
 |
 |
| Parameter | Plot |
|---|---|
| CZT HV Monitor | 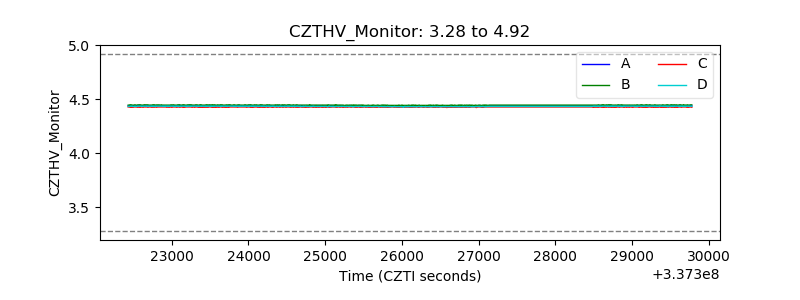 |
| D_VDD | 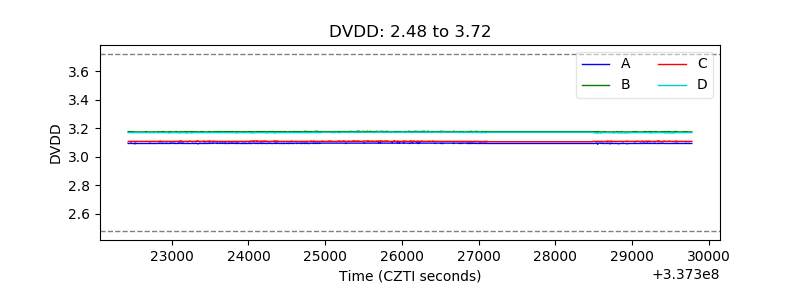 |
| Temperature 1 | 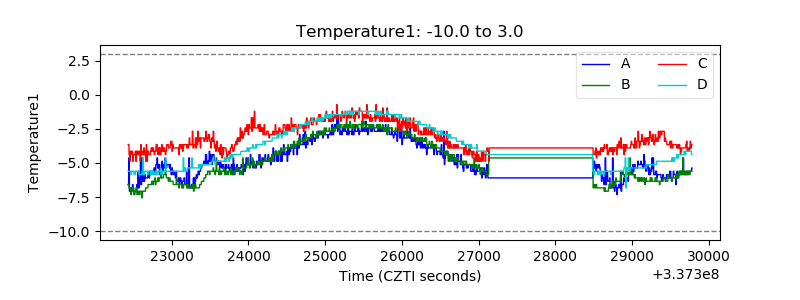 |
| Veto HV Monitor |  |
| Veto LLD | 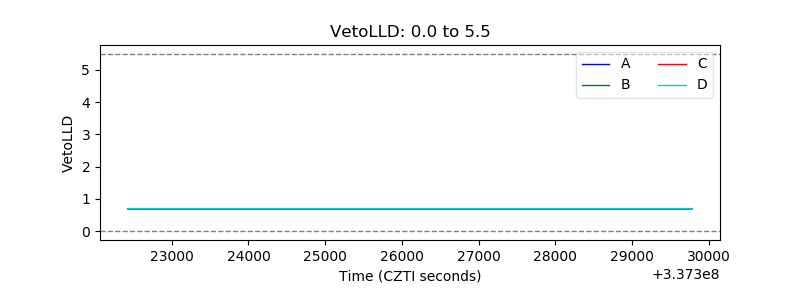 |
| Alpha Counter | 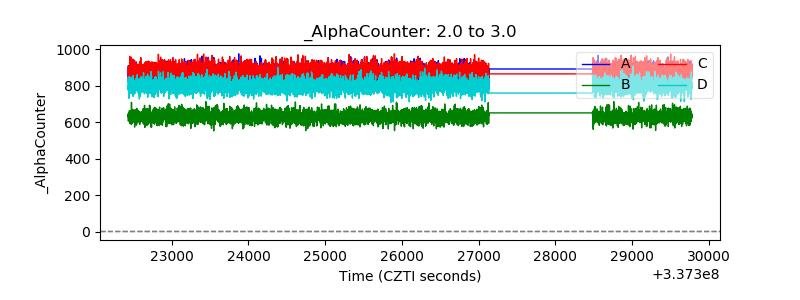 |
| _CPM_Rate | 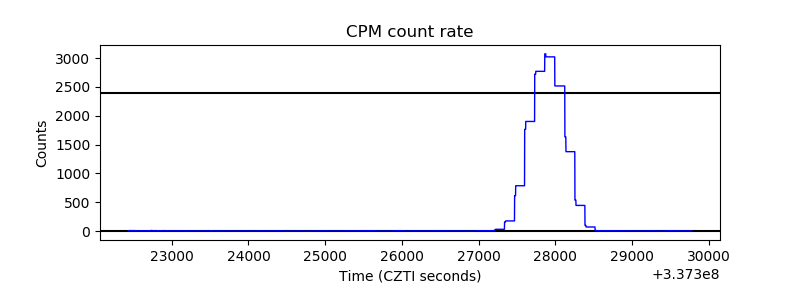 |
| CZT Counter | 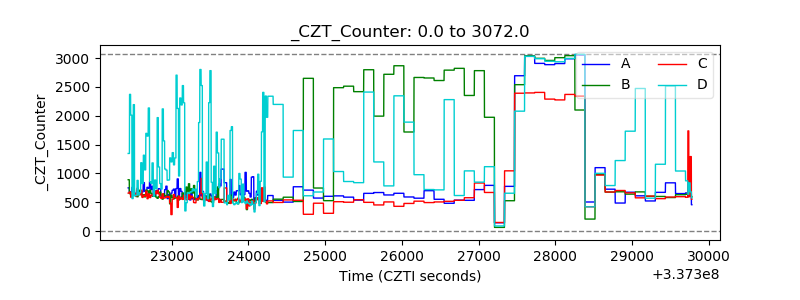 |
| +2.5 Volts monitor |  |
| +5 Volts monitor |  |
| _ROLL_ROT | 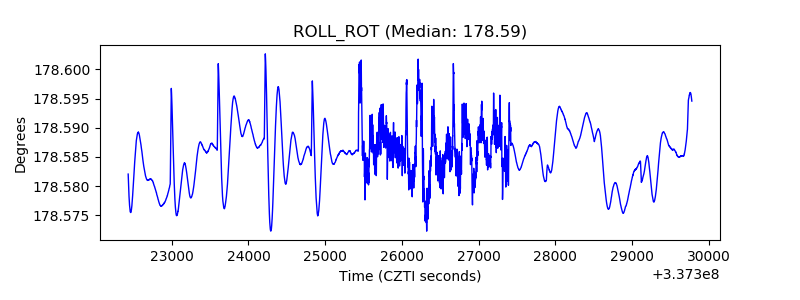 |
| _Roll_DEC |  |
| _Roll_RA | 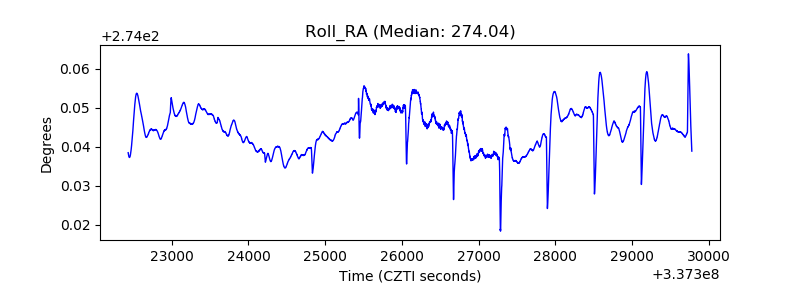 |
| Veto Counter | 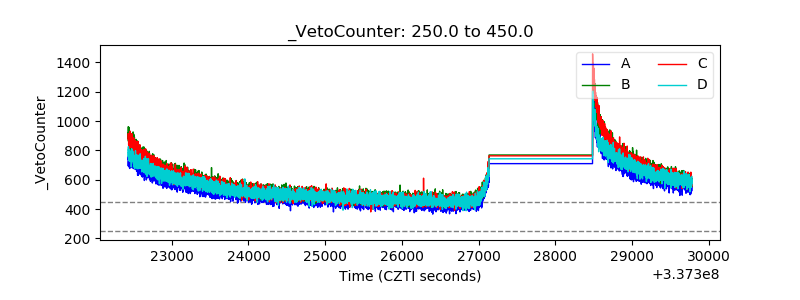 |