| Param | Original file | Final file |
|---|---|---|
| Filename | modeM0/AS1A09_044T02_9000003852_26764cztM0_level2.evt | modeM0/AS1A09_044T02_9000003852_26764cztM0_level2_quad_clean.evt |
| Size (bytes) | 818,251,200 | 77,742,720 |
| Size | 780.3 MB | 74.1 MB |
| Events in quadrant A | 3,994,413 | 549,996 |
| Events in quadrant B | 7,756,985 | 397,302 |
| Events in quadrant C | 3,787,792 | 525,861 |
| Events in quadrant D | 8,817,393 | 440,399 |
| Mode M9 | |||
|---|---|---|---|
| Quadrant | BADHDUFLAG | Total packets | Discarded packets |
| A | 0 | 20 | 0 |
| B | 0 | 21 | 0 |
| C | 0 | 21 | 0 |
| D | 0 | 21 | 0 |
| Mode M0 | |||
|---|---|---|---|
| Quadrant | BADHDUFLAG | Total packets | Discarded packets |
| A | 0 | 16330 | 0 |
| B | 0 | 27547 | 0 |
| C | 0 | 15361 | 0 |
| D | 0 | 30609 | 0 |
| Quadrant | Total seconds | Saturated seconds | Saturation percentage |
|---|---|---|---|
| A | 6290 | 151 | 2.400636% |
| B | 6290 | 1866 | 29.666137% |
| C | 6290 | 239 | 3.799682% |
| D | 6290 | 1930 | 30.683625% |
Noise dominated data is calculated using 1-second bins in cleaned event files. If a bin has >2000 counts, and if more than 50% of those come from <1% of pixels, then it is considered to be noise-dominated and hence unusable.
| Quadrant | # 1 sec bins | Bins with >0 counts | Bins with >2000 counts | High rate bins dominated by noise | Noise dominated (total time) | Noise dominated (detector-on time) | Marked lightcurve |
|---|---|---|---|---|---|---|---|
| A | 7600 | 6290 | 0 | 0 | 0.00% | 0.00% | 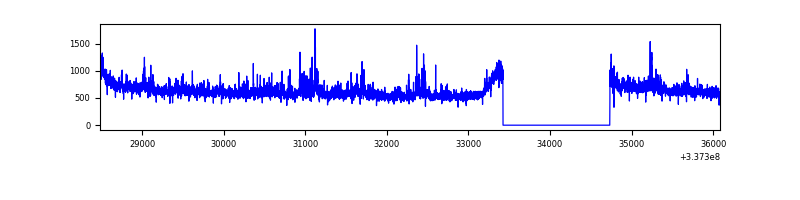 |
| B | 7600 | 6290 | 1476 | 1476 | 19.42% | 23.47% | 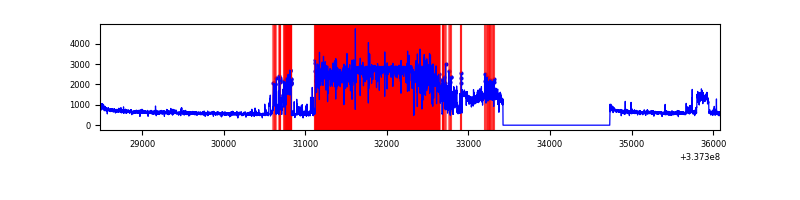 |
| C | 7600 | 6291 | 14 | 14 | 0.18% | 0.22% | 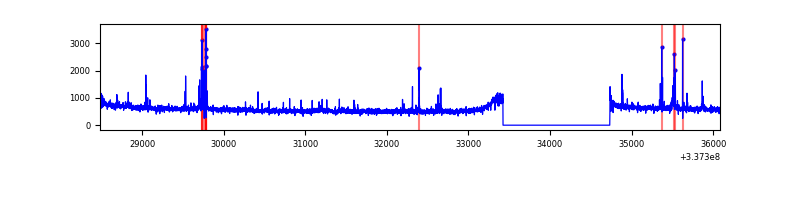 |
| D | 7600 | 6290 | 1452 | 1452 | 19.11% | 23.08% | 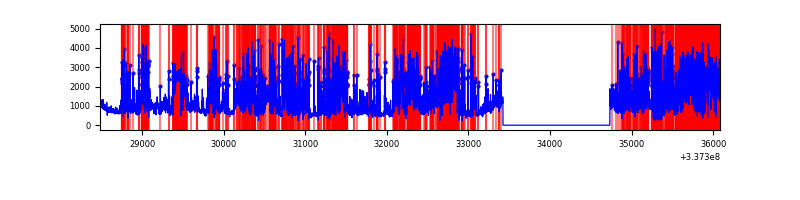 |
Top three noisy pixels from each quadrant. If the there are fewer than three noisy pixels in the level2.evt file, extra rows are filled as -1
| Pixel properties | Quadrant properties | ||||||
|---|---|---|---|---|---|---|---|
| Quadrant | DetID | PixID | Counts | Sigma | Mean | Median | Sigma |
| A | 0 | 13 | 332002 | 1779.43 | 942 | 927 | 186.1 |
| A | 9 | 130 | 21922 | 112.84 | 942 | 927 | 186.1 |
| A | 6 | 16 | 11829 | 58.59 | 942 | 927 | 186.1 |
| B | 0 | 189 | 4500235 | 29611.03 | 818 | 802 | 152.0 |
| B | 3 | 112 | 23168 | 147.19 | 818 | 802 | 152.0 |
| B | 0 | 190 | 20594 | 130.25 | 818 | 802 | 152.0 |
| C | 2 | 16 | 151856 | 742.01 | 888 | 897 | 203.4 |
| C | 14 | 238 | 144096 | 703.86 | 888 | 897 | 203.4 |
| C | 15 | 208 | 20153 | 94.65 | 888 | 897 | 203.4 |
| D | 7 | 80 | 5014218 | 25252.34 | 802 | 781 | 198.5 |
| D | 1 | 52 | 293013 | 1471.95 | 802 | 781 | 198.5 |
| D | 15 | 35 | 233047 | 1169.91 | 802 | 781 | 198.5 |
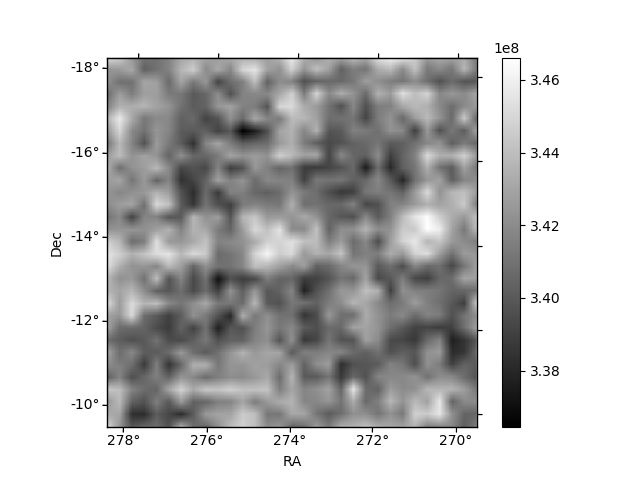
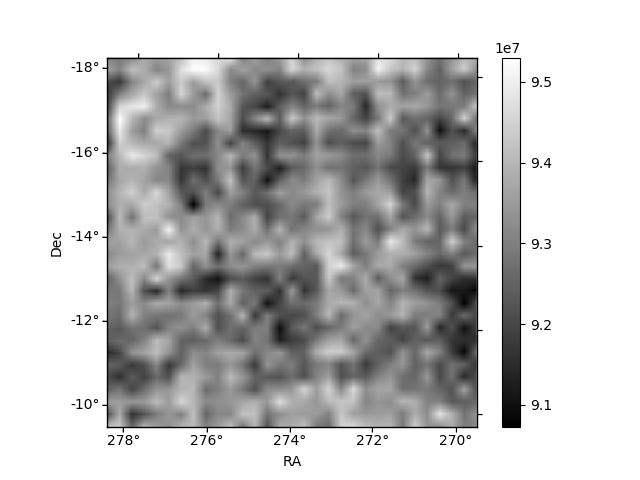
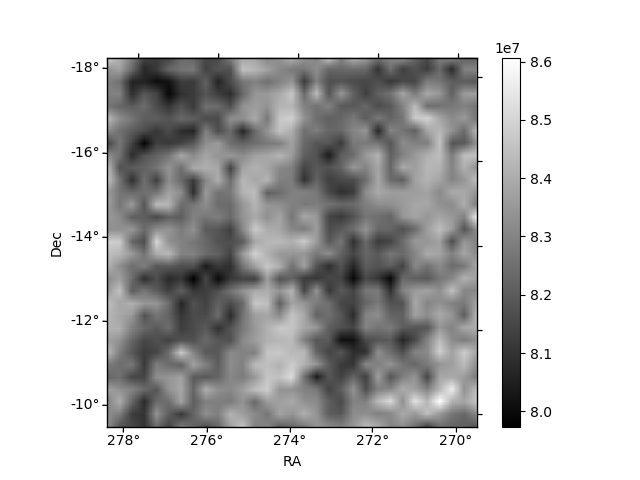
Histogram calculated using DETX and DETY for each event in the final _common_clean file
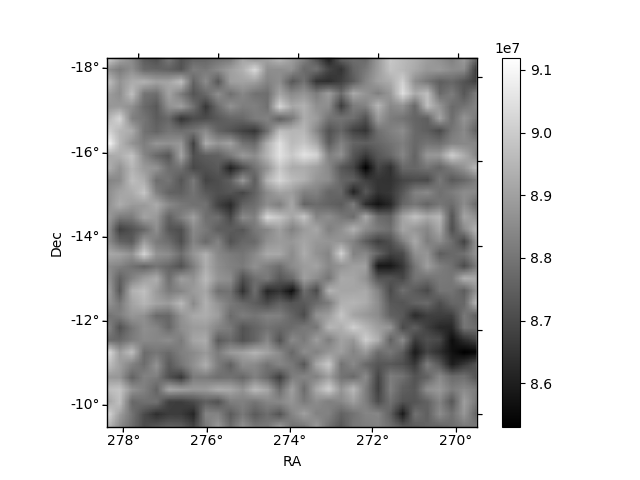
| Quadrant A | 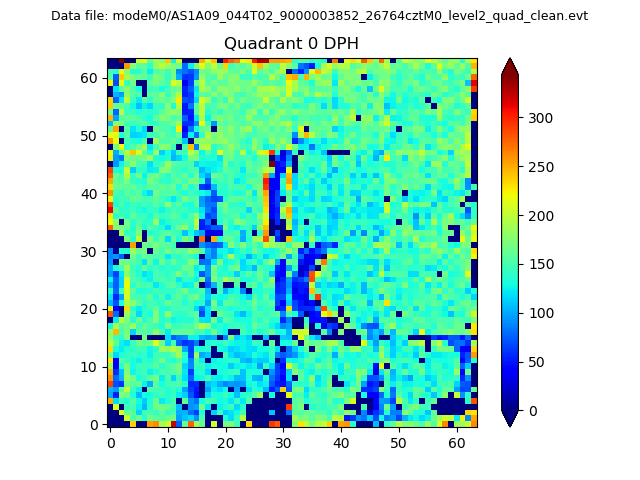 |
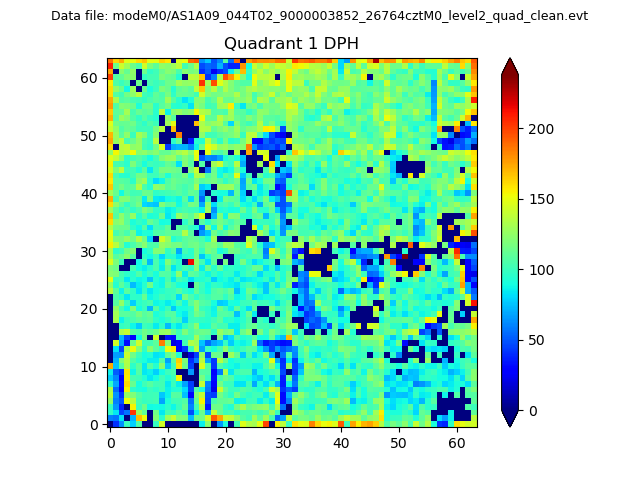 |
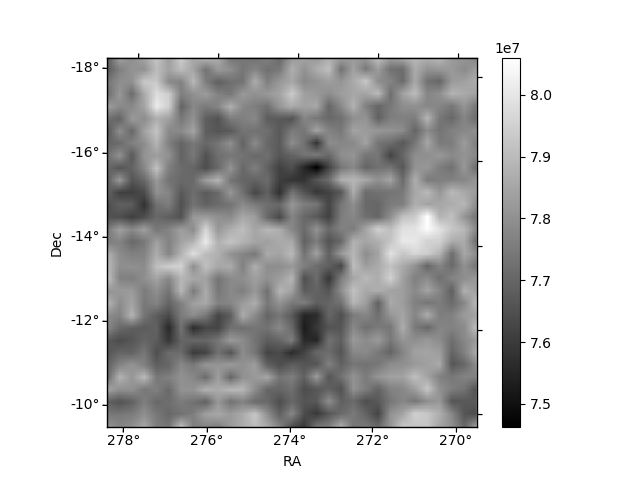
Quadrant B |
|---|---|---|---|
| Quadrant D |  |
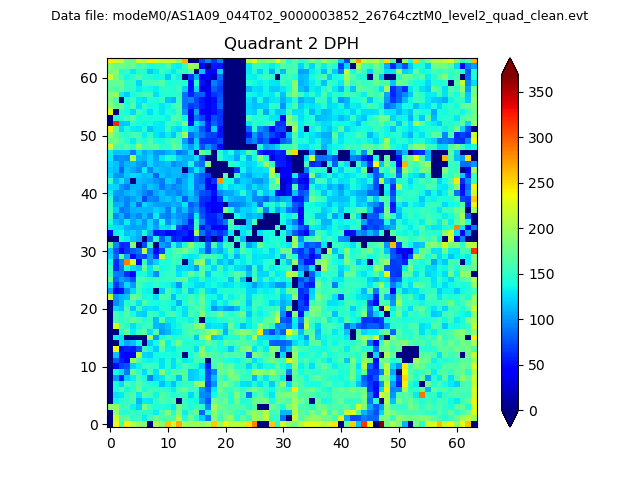 |
Quadrant C |
| Plot type | Count rate plots | Images |
|---|---|---|
| Comparison with Poisson distribution Blue bars denote a histogram of data divided into 1 sec bins. Red curve is a Poisson curve with rate = median count rate of data. |
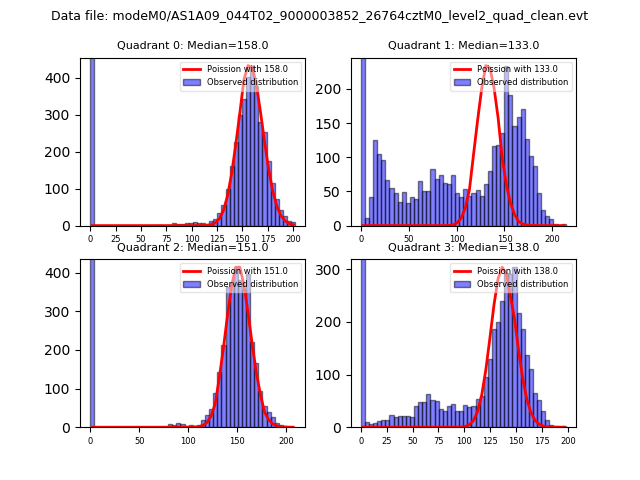 |
 |
| Quadrant-wise count rates Data is divided into 100 sec bins |
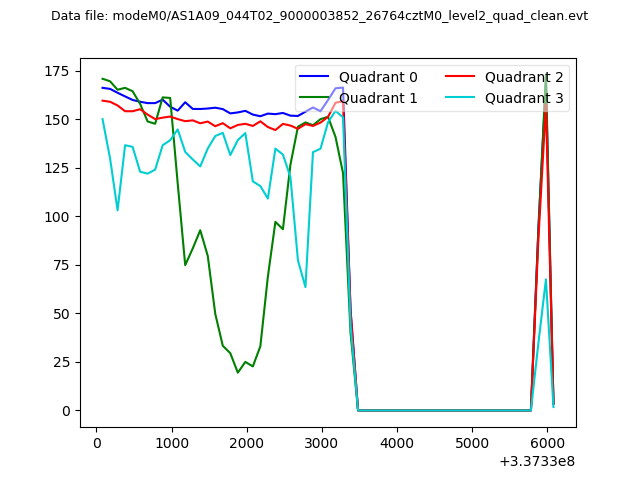 |
|
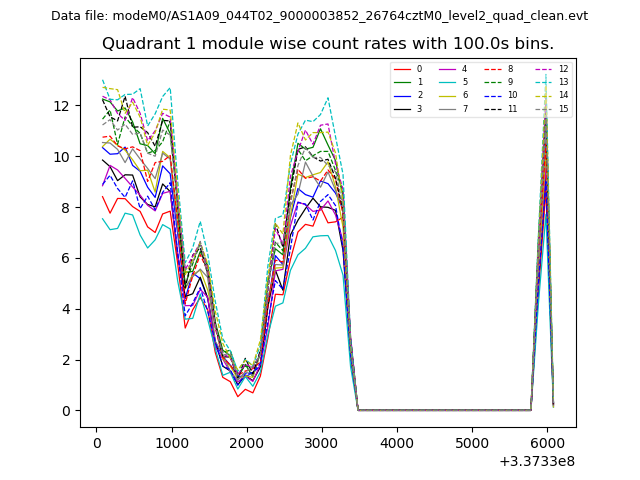
| Module-wise count rates for Quadrant A Data is divided into 100 sec bins |
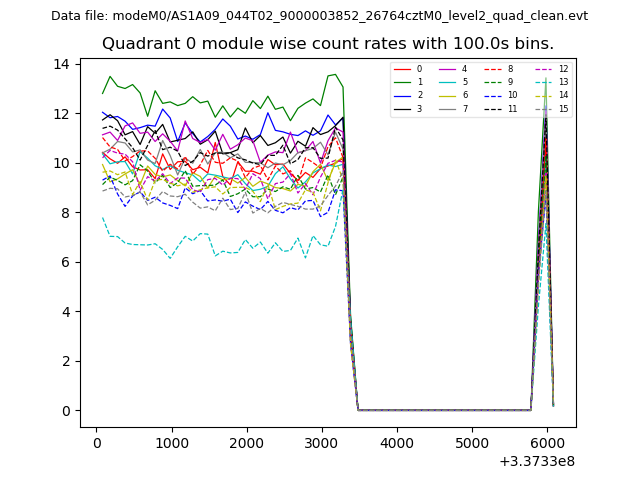 |
 |
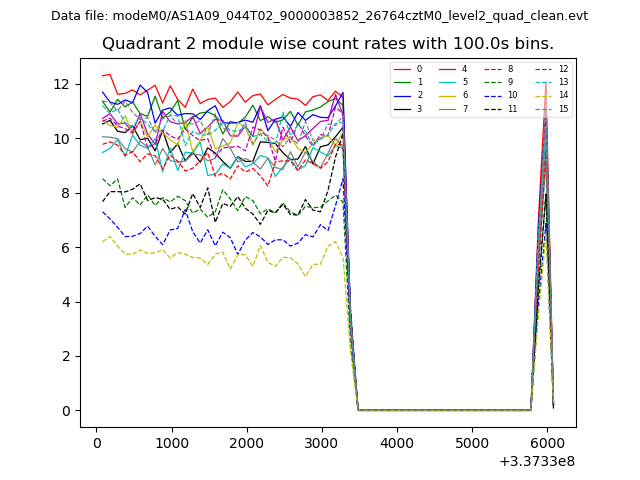
| Module-wise count rates for Quadrant B Data is divided into 100 sec bins |
 |
 |
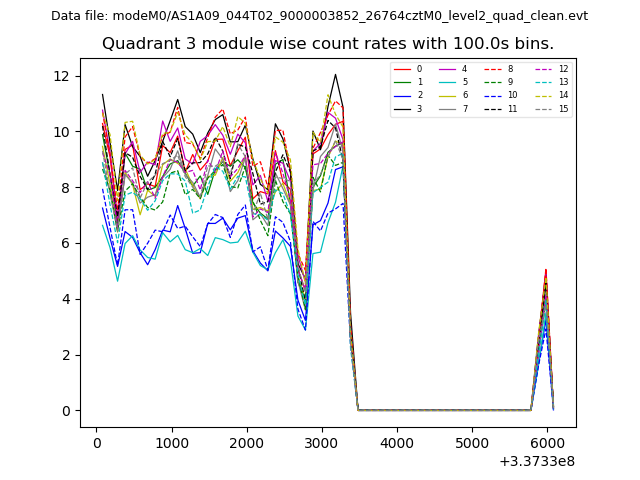
| Module-wise count rates for Quadrant C Data is divided into 100 sec bins |
 |
 |
| Module-wise count rates for Quadrant D Data is divided into 100 sec bins |
 |
 |
| Parameter | Plot |
|---|---|
| CZT HV Monitor | 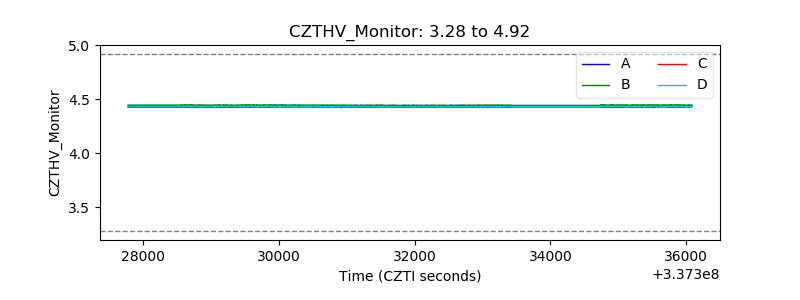 |
| D_VDD | 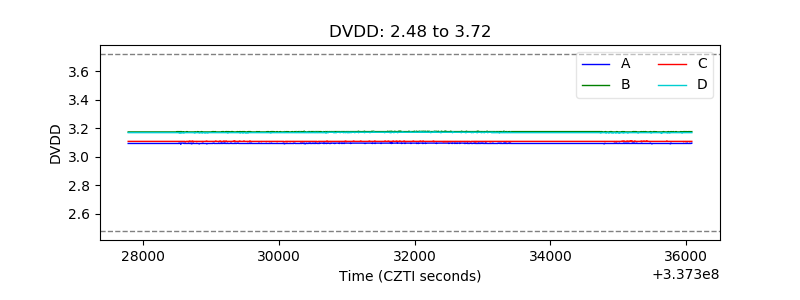 |
| Temperature 1 | 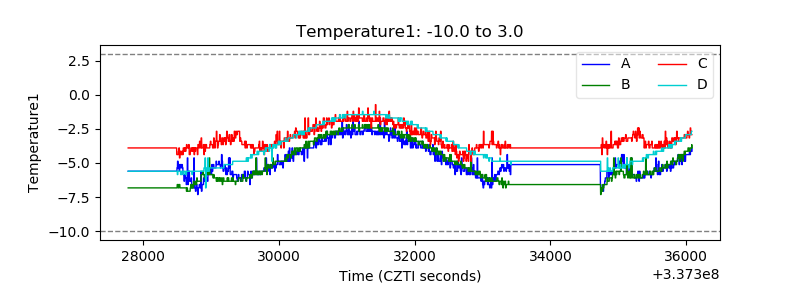 |
| Veto HV Monitor | 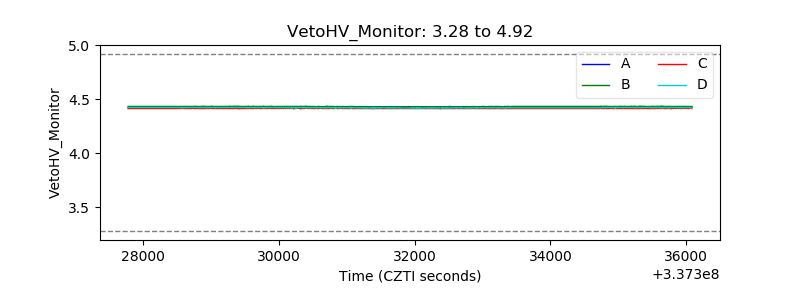 |
| Veto LLD |  |
| Alpha Counter |  |
| _CPM_Rate | 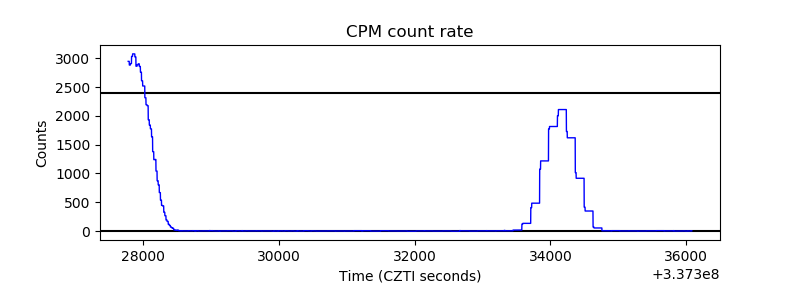 |
| CZT Counter | 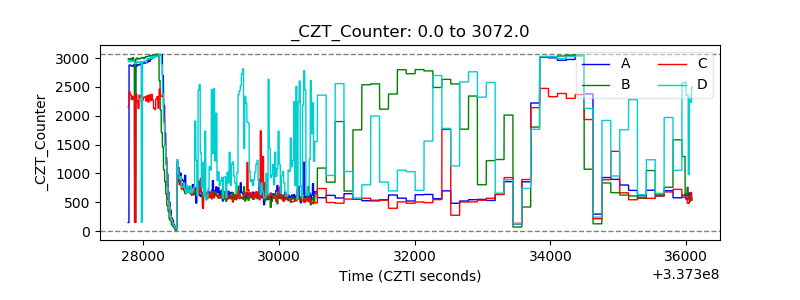 |
| +2.5 Volts monitor |  |
| +5 Volts monitor | 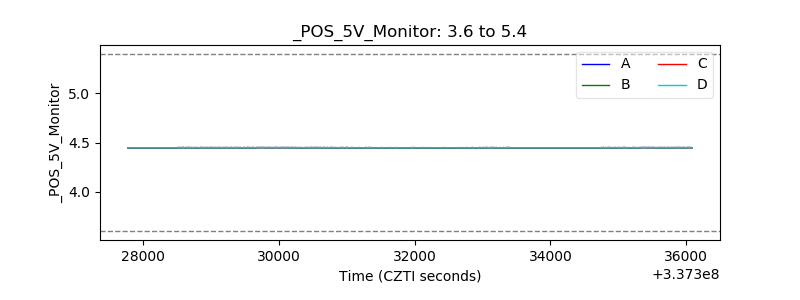 |
| _ROLL_ROT |  |
| _Roll_DEC | 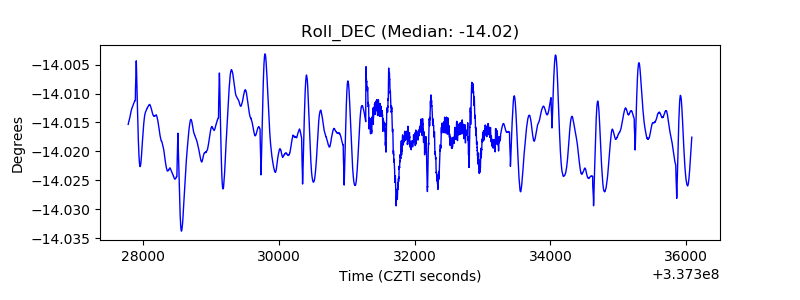 |
| _Roll_RA | 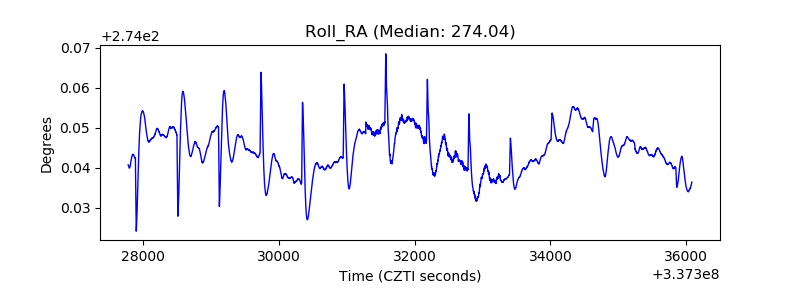 |
| Veto Counter | 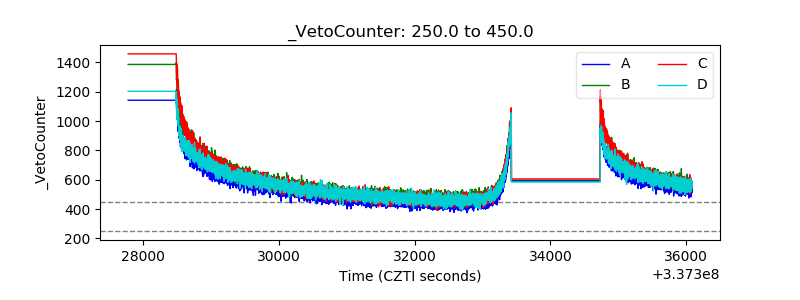 |