| Param | Original file | Final file |
|---|---|---|
| Filename | modeM0/AS1A09_044T02_9000003852_26765cztM0_level2.evt | modeM0/AS1A09_044T02_9000003852_26765cztM0_level2_quad_clean.evt |
| Size (bytes) | 894,404,160 | 86,904,000 |
| Size | 853.0 MB | 82.9 MB |
| Events in quadrant A | 3,841,685 | 647,864 |
| Events in quadrant B | 7,618,237 | 498,134 |
| Events in quadrant C | 3,757,691 | 614,447 |
| Events in quadrant D | 11,438,372 | 423,317 |
| Mode M9 | |||
|---|---|---|---|
| Quadrant | BADHDUFLAG | Total packets | Discarded packets |
| A | 0 | 18 | 0 |
| B | 0 | 19 | 0 |
| C | 0 | 19 | 0 |
| D | 0 | 19 | 0 |
| Mode M0 | |||
|---|---|---|---|
| Quadrant | BADHDUFLAG | Total packets | Discarded packets |
| A | 0 | 15622 | 0 |
| B | 0 | 26950 | 0 |
| C | 0 | 15295 | 0 |
| D | 0 | 38420 | 0 |
| Quadrant | Total seconds | Saturated seconds | Saturation percentage |
|---|---|---|---|
| A | 6394 | 152 | 2.377229% |
| B | 6394 | 1920 | 30.028151% |
| C | 6394 | 202 | 3.159212% |
| D | 6393 | 3394 | 53.089316% |
Noise dominated data is calculated using 1-second bins in cleaned event files. If a bin has >2000 counts, and if more than 50% of those come from <1% of pixels, then it is considered to be noise-dominated and hence unusable.
| Quadrant | # 1 sec bins | Bins with >0 counts | Bins with >2000 counts | High rate bins dominated by noise | Noise dominated (total time) | Noise dominated (detector-on time) | Marked lightcurve |
|---|---|---|---|---|---|---|---|
| A | 7634 | 6395 | 2 | 2 | 0.03% | 0.03% | 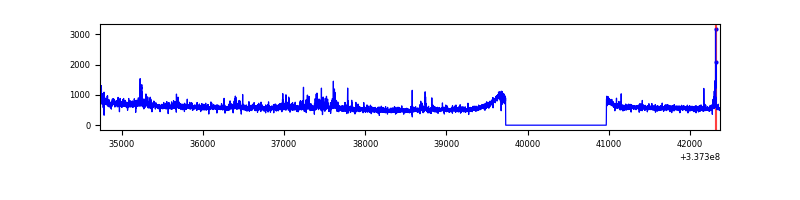 |
| B | 7634 | 6395 | 1647 | 1647 | 21.57% | 25.75% | 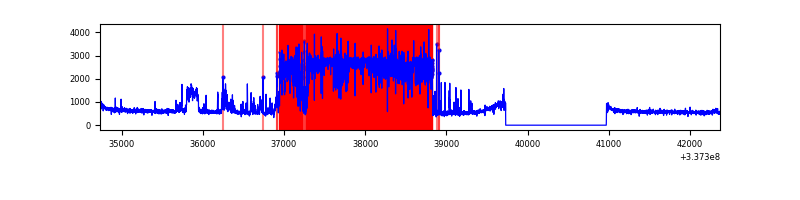 |
| C | 7634 | 6395 | 7 | 7 | 0.09% | 0.11% | 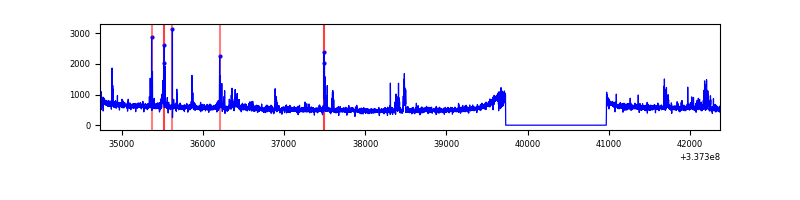 |
| D | 7633 | 6393 | 2492 | 2492 | 32.65% | 38.98% | 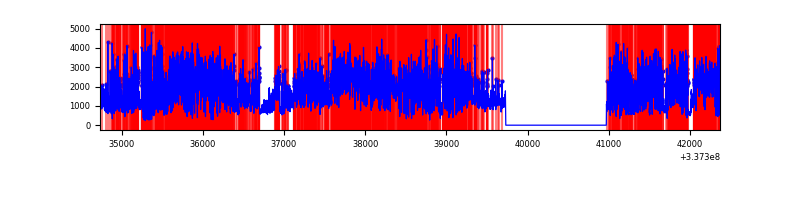 |
Top three noisy pixels from each quadrant. If the there are fewer than three noisy pixels in the level2.evt file, extra rows are filled as -1
| Pixel properties | Quadrant properties | ||||||
|---|---|---|---|---|---|---|---|
| Quadrant | DetID | PixID | Counts | Sigma | Mean | Median | Sigma |
| A | 0 | 13 | 256980 | 1404.05 | 927 | 911 | 182.4 |
| A | 9 | 130 | 9753 | 48.48 | 927 | 911 | 182.4 |
| A | 13 | 254 | 9496 | 47.07 | 927 | 911 | 182.4 |
| B | 0 | 189 | 4456739 | 29784.4 | 801 | 784 | 149.6 |
| B | 0 | 190 | 21104 | 135.82 | 801 | 784 | 149.6 |
| B | 12 | 111 | 17642 | 112.68 | 801 | 784 | 149.6 |
| C | 14 | 238 | 141301 | 698.06 | 869 | 874 | 201.2 |
| C | 2 | 16 | 132282 | 653.22 | 869 | 874 | 201.2 |
| C | 10 | 22 | 83213 | 409.3 | 869 | 874 | 201.2 |
| D | 7 | 80 | 6761621 | 38778.5 | 700 | 683 | 174.3 |
| D | 15 | 36 | 636823 | 3648.69 | 700 | 683 | 174.3 |
| D | 1 | 52 | 475476 | 2723.26 | 700 | 683 | 174.3 |
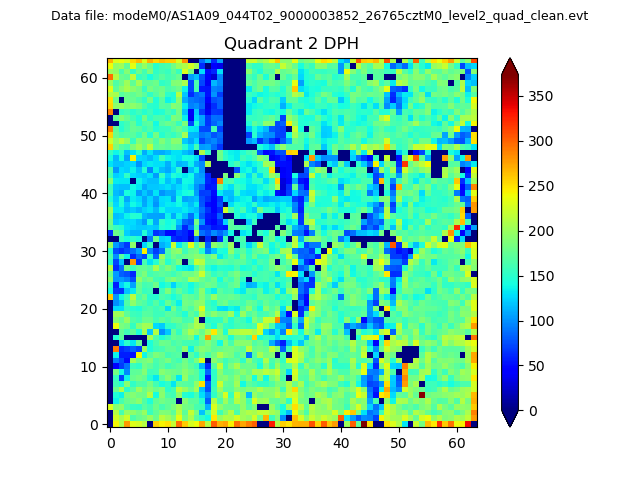
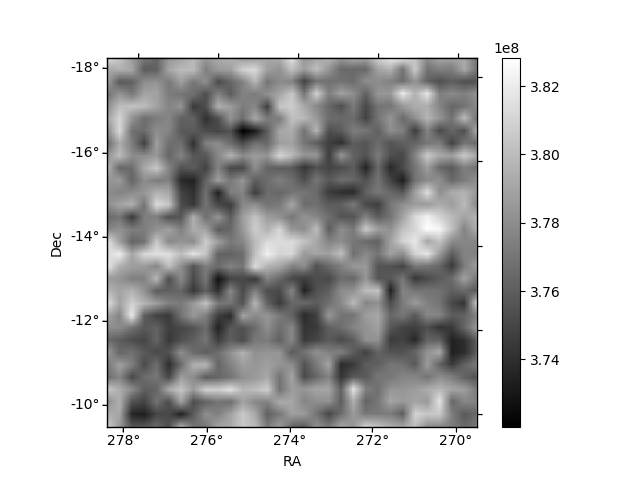
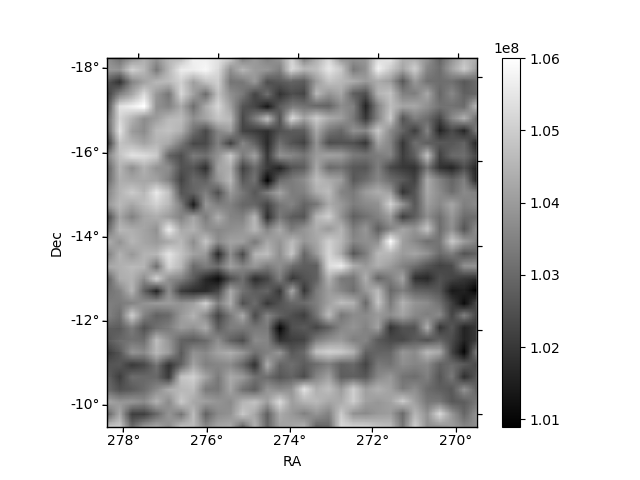
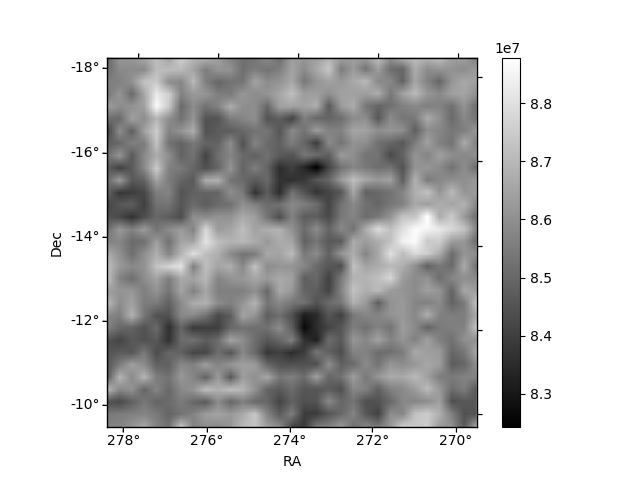
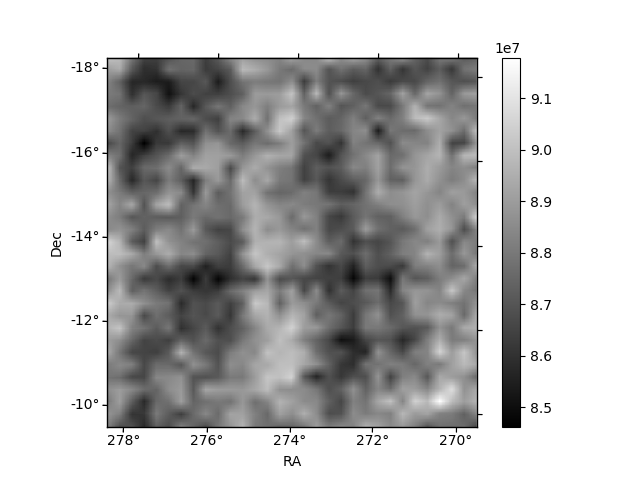
Histogram calculated using DETX and DETY for each event in the final _common_clean file
| Quadrant A | 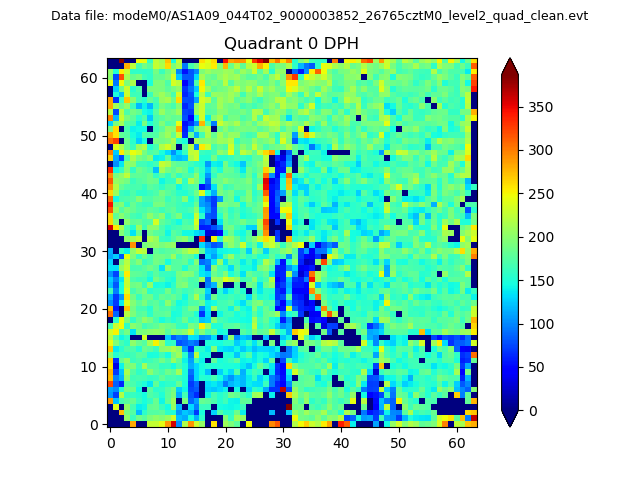 |
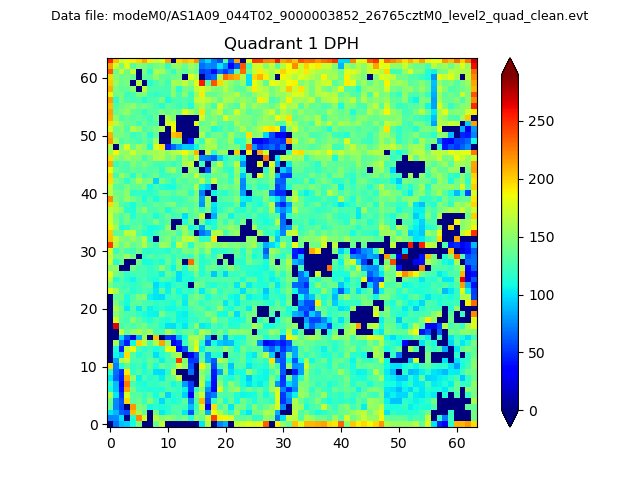 |
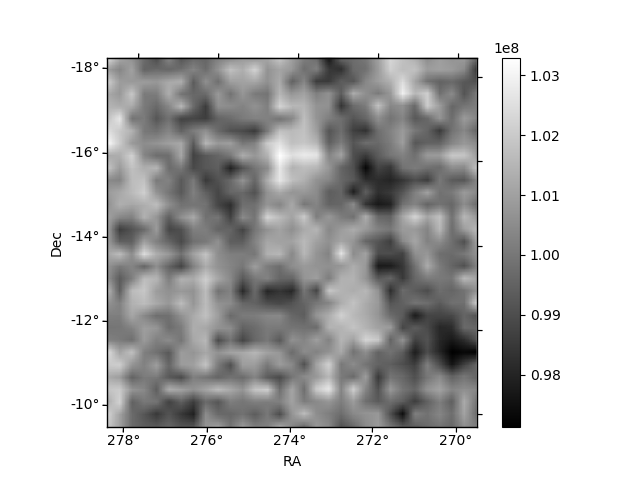
Quadrant B |
|---|---|---|---|
| Quadrant D | 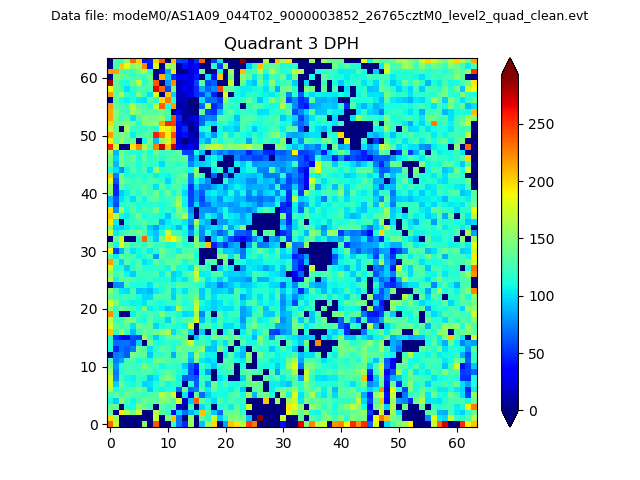 |
 |
Quadrant C |
| Plot type | Count rate plots | Images |
|---|---|---|
| Comparison with Poisson distribution Blue bars denote a histogram of data divided into 1 sec bins. Red curve is a Poisson curve with rate = median count rate of data. |
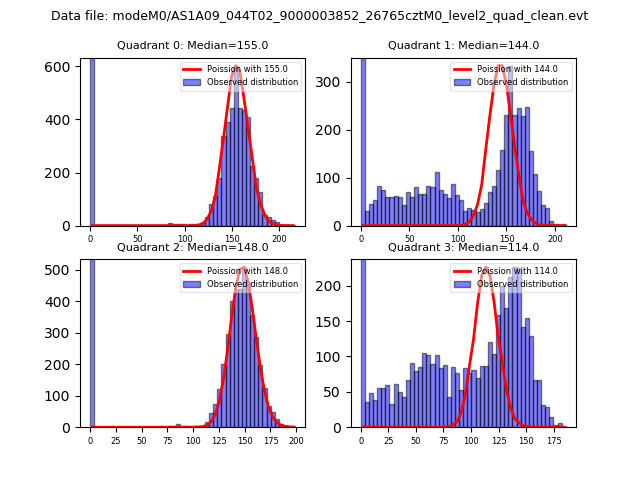 |
 |
| Quadrant-wise count rates Data is divided into 100 sec bins |
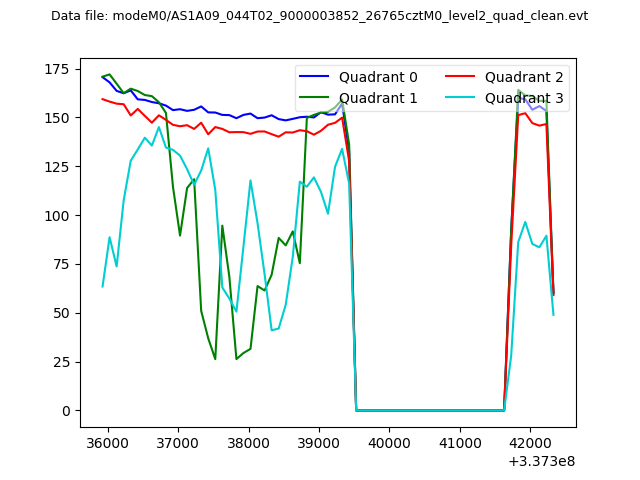 |
|
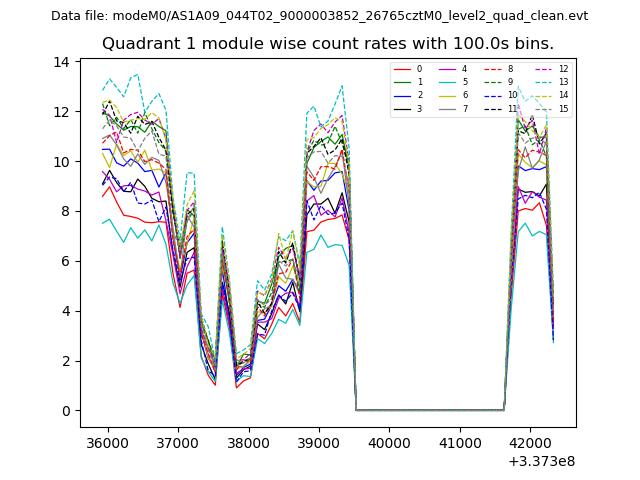
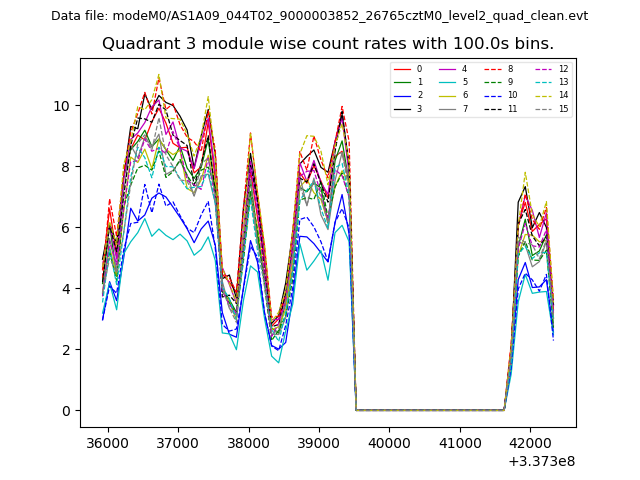
| Module-wise count rates for Quadrant A Data is divided into 100 sec bins |
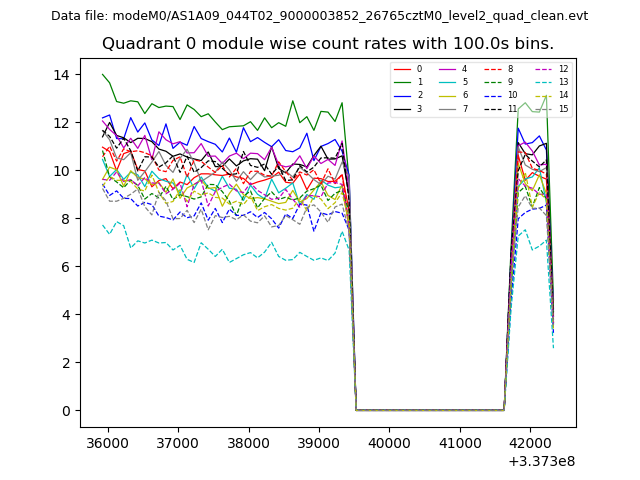 |
 |
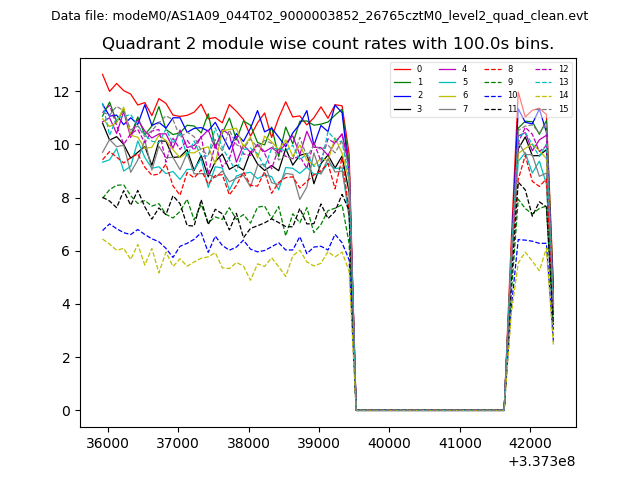
| Module-wise count rates for Quadrant B Data is divided into 100 sec bins |
 |
 |
| Module-wise count rates for Quadrant C Data is divided into 100 sec bins |
 |
 |
| Module-wise count rates for Quadrant D Data is divided into 100 sec bins |
 |
 |
| Parameter | Plot |
|---|---|
| CZT HV Monitor | 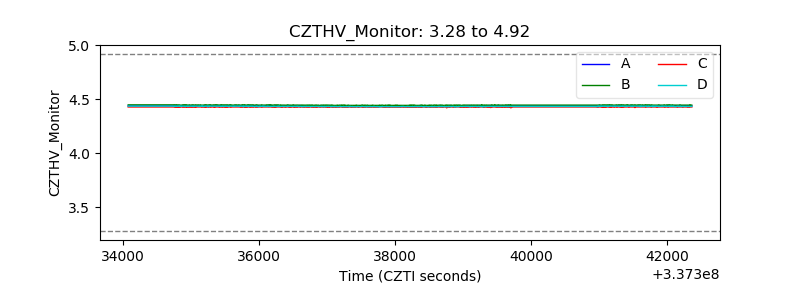 |
| D_VDD | 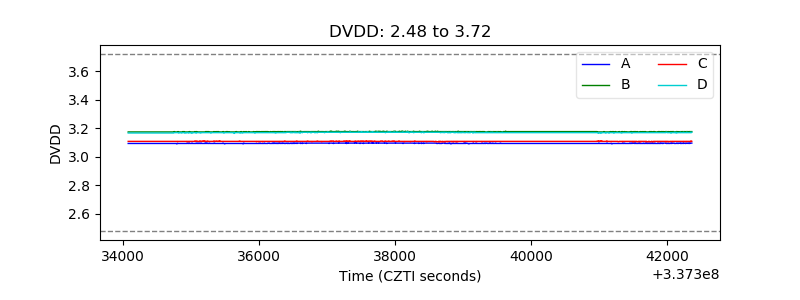 |
| Temperature 1 |  |
| Veto HV Monitor | 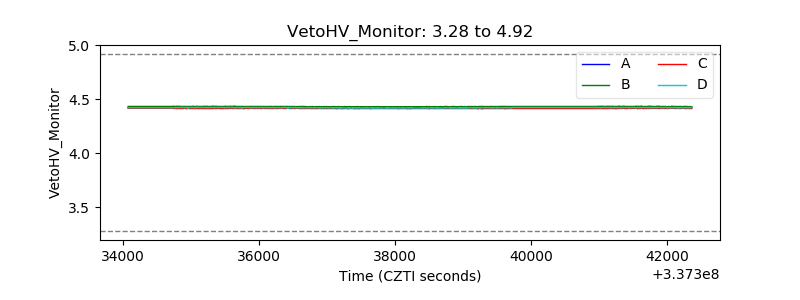 |
| Veto LLD | 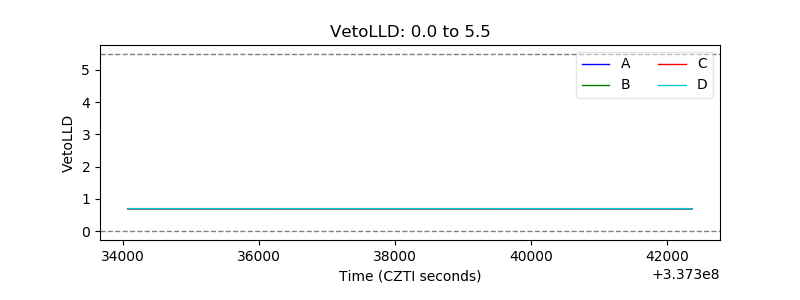 |
| Alpha Counter | 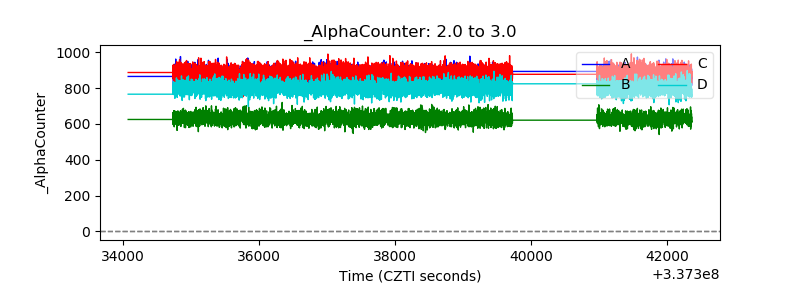 |
| _CPM_Rate | 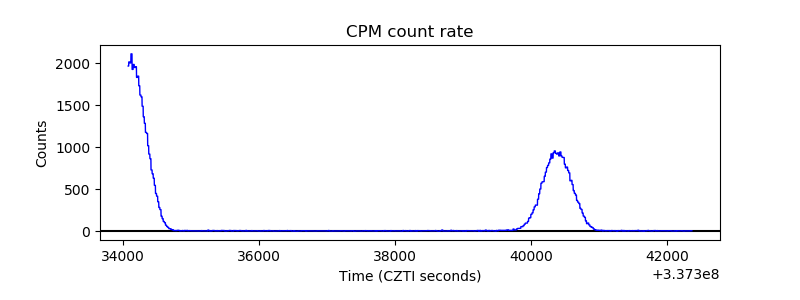 |
| CZT Counter | 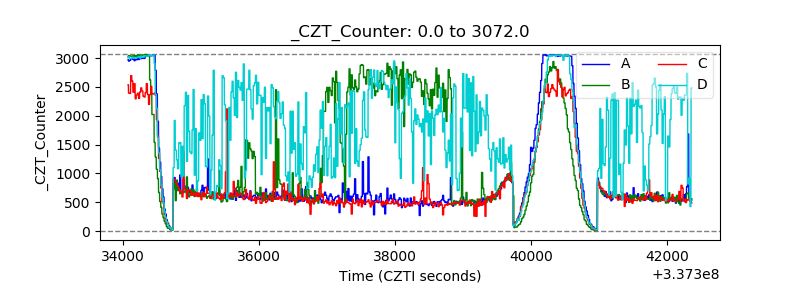 |
| +2.5 Volts monitor |  |
| +5 Volts monitor |  |
| _ROLL_ROT | 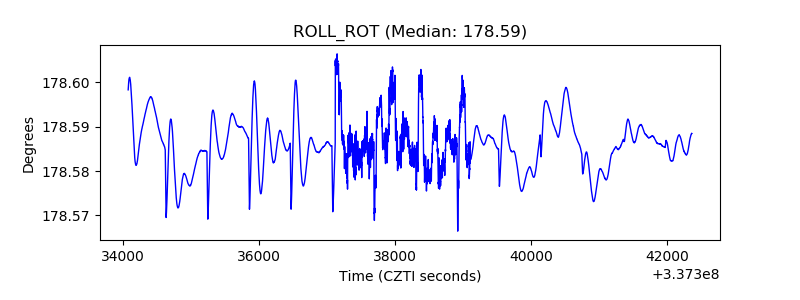 |
| _Roll_DEC |  |
| _Roll_RA | 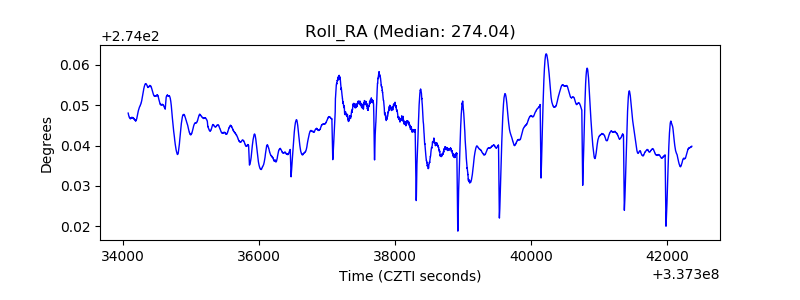 |
| Veto Counter | 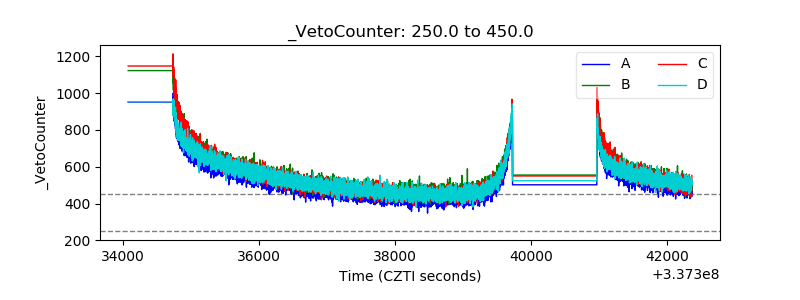 |