| Param | Original file | Final file |
|---|---|---|
| Filename | modeM0/AS1A09_044T02_9000003852_26766cztM0_level2.evt | modeM0/AS1A09_044T02_9000003852_26766cztM0_level2_quad_clean.evt |
| Size (bytes) | 90,613,440 | 16,168,320 |
| Size | 86.4 MB | 15.4 MB |
| Events in quadrant A | 458,849 | 117,560 |
| Events in quadrant B | 469,778 | 120,120 |
| Events in quadrant C | 441,419 | 112,364 |
| Events in quadrant D | 1,319,081 | 77,843 |
| Mode M0 | |||
|---|---|---|---|
| Quadrant | BADHDUFLAG | Total packets | Discarded packets |
| A | 0 | 1788 | 0 |
| B | 0 | 1812 | 0 |
| C | 0 | 1753 | 0 |
| D | 0 | 4453 | 0 |
| Quadrant | Total seconds | Saturated seconds | Saturation percentage |
|---|---|---|---|
| A | 764 | 11 | 1.439791% |
| B | 765 | 14 | 1.830065% |
| C | 765 | 1 | 0.130719% |
| D | 765 | 430 | 56.209150% |
Noise dominated data is calculated using 1-second bins in cleaned event files. If a bin has >2000 counts, and if more than 50% of those come from <1% of pixels, then it is considered to be noise-dominated and hence unusable.
| Quadrant | # 1 sec bins | Bins with >0 counts | Bins with >2000 counts | High rate bins dominated by noise | Noise dominated (total time) | Noise dominated (detector-on time) | Marked lightcurve |
|---|---|---|---|---|---|---|---|
| A | 764 | 764 | 6 | 6 | 0.79% | 0.79% | 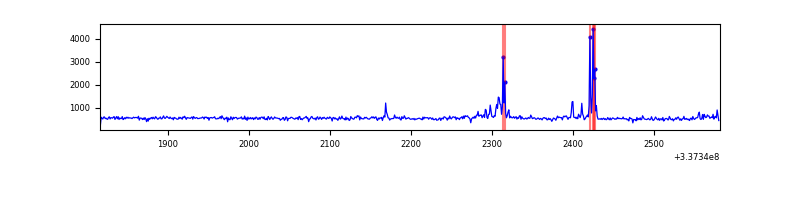 |
| B | 765 | 765 | 10 | 10 | 1.31% | 1.31% | 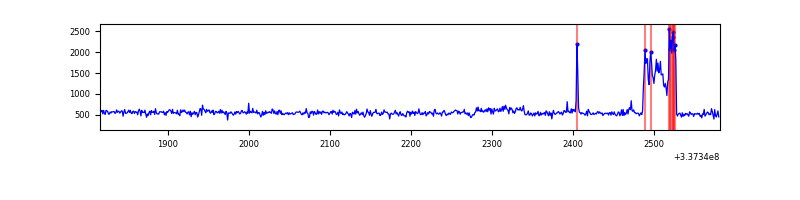 |
| C | 765 | 765 | 0 | 0 | 0.00% | 0.00% | 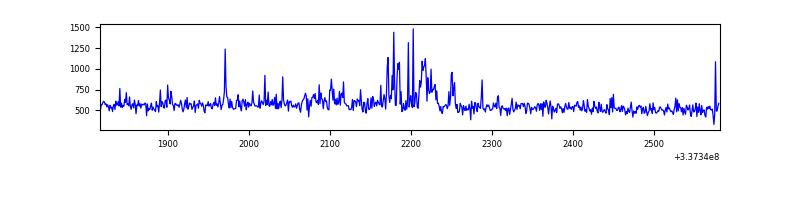 |
| D | 765 | 765 | 348 | 348 | 45.49% | 45.49% | 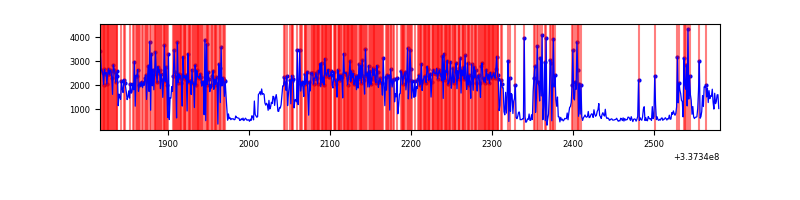 |
Top three noisy pixels from each quadrant. If the there are fewer than three noisy pixels in the level2.evt file, extra rows are filled as -1
| Pixel properties | Quadrant properties | ||||||
|---|---|---|---|---|---|---|---|
| Quadrant | DetID | PixID | Counts | Sigma | Mean | Median | Sigma |
| A | 0 | 13 | 46245 | 1993.27 | 106 | 104 | 23.1 |
| A | 13 | 254 | 1133 | 44.45 | 106 | 104 | 23.1 |
| A | 0 | 226 | 991 | 38.32 | 106 | 104 | 23.1 |
| B | 0 | 189 | 53275 | 2458.64 | 104 | 102 | 21.6 |
| B | 0 | 190 | 6089 | 276.83 | 104 | 102 | 21.6 |
| B | 12 | 111 | 2235 | 98.63 | 104 | 102 | 21.6 |
| C | 10 | 22 | 23525 | 924.73 | 100 | 100 | 25.3 |
| C | 14 | 238 | 16341 | 641.13 | 100 | 100 | 25.3 |
| C | 2 | 16 | 9630 | 376.21 | 100 | 100 | 25.3 |
| D | 7 | 80 | 986464 | 47436.71 | 76 | 74 | 20.8 |
| D | 1 | 52 | 32798 | 1573.74 | 76 | 74 | 20.8 |
| D | 15 | 20 | 2790 | 130.62 | 76 | 74 | 20.8 |
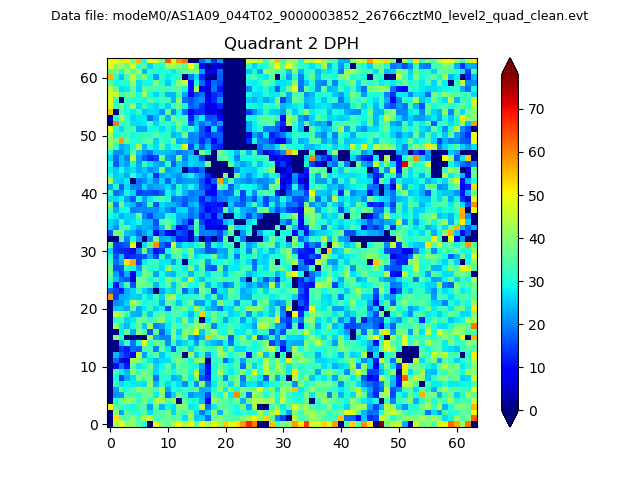
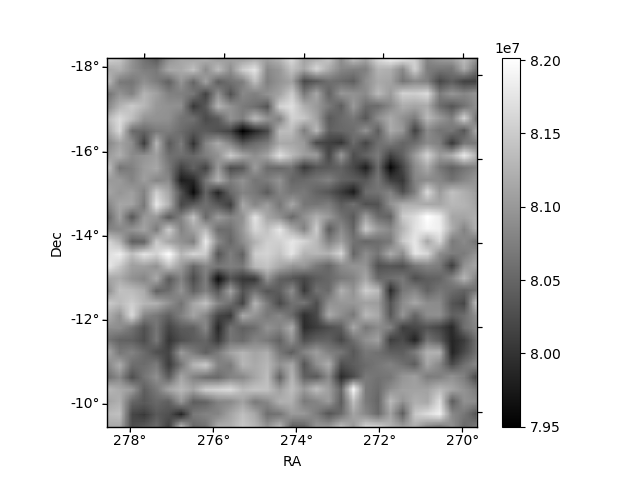
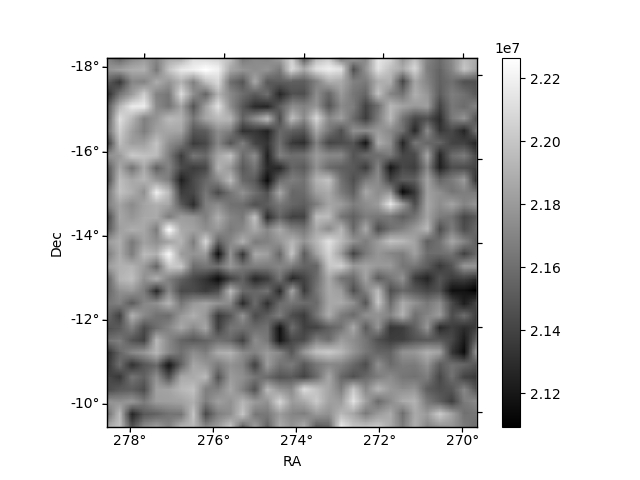
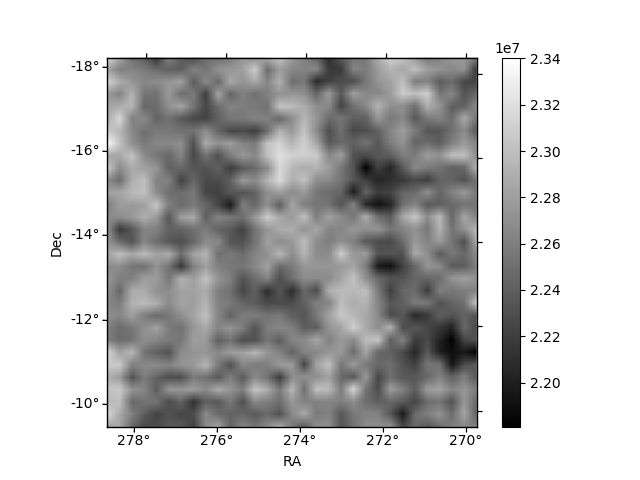
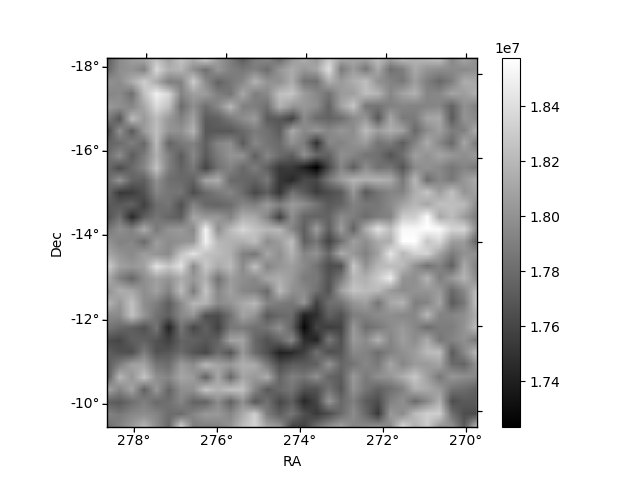
Histogram calculated using DETX and DETY for each event in the final _common_clean file
| Quadrant A | 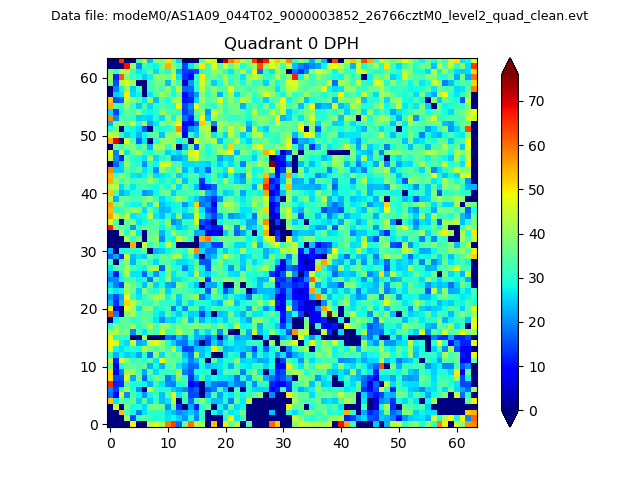 |
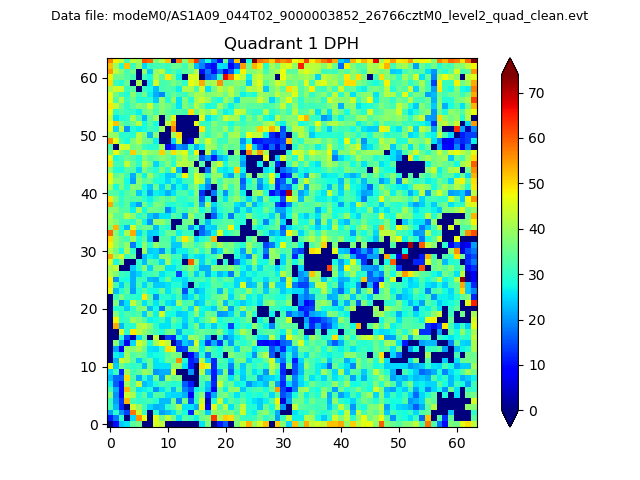 |
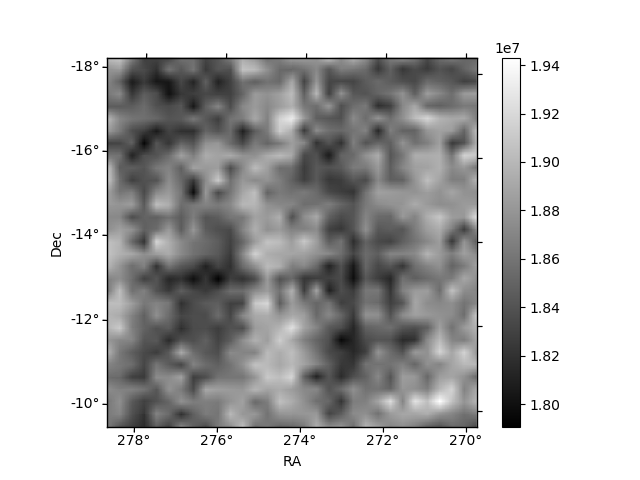
Quadrant B |
|---|---|---|---|
| Quadrant D | 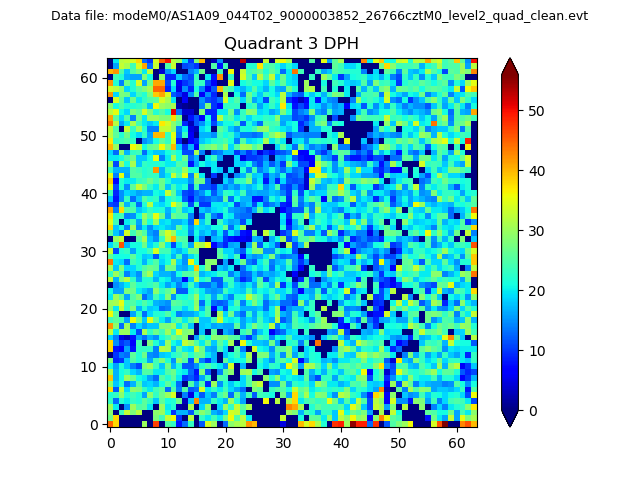 |
 |
Quadrant C |
| Plot type | Count rate plots | Images |
|---|---|---|
| Comparison with Poisson distribution Blue bars denote a histogram of data divided into 1 sec bins. Red curve is a Poisson curve with rate = median count rate of data. |
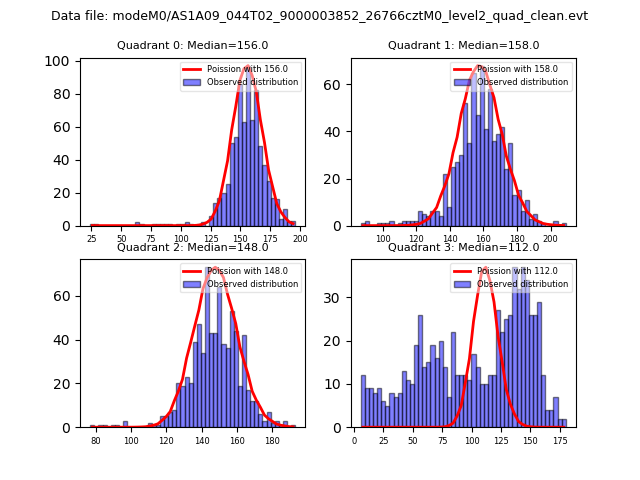 |
 |
| Quadrant-wise count rates Data is divided into 100 sec bins |
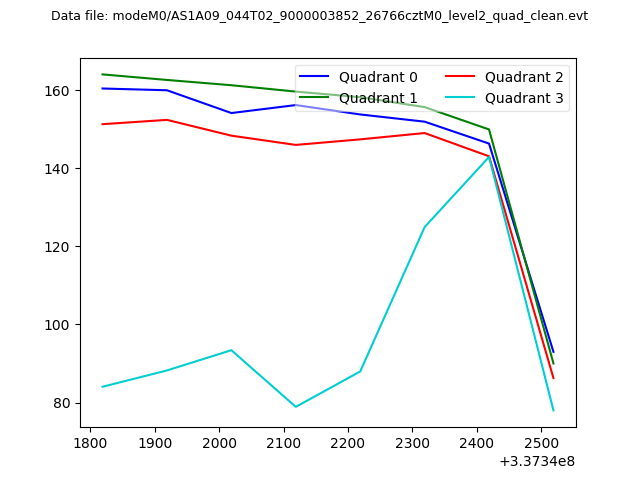 |
|
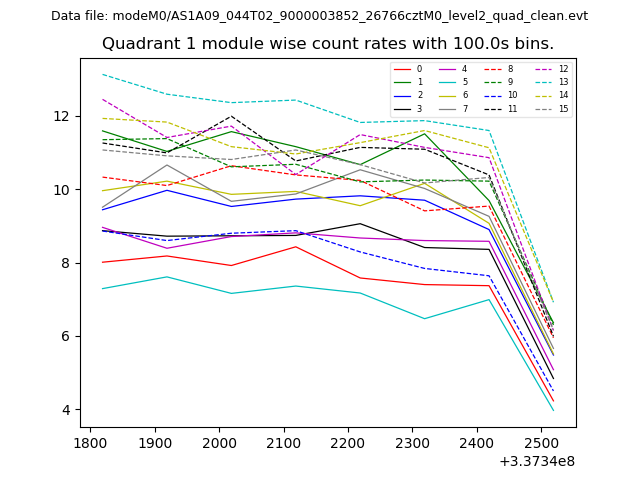
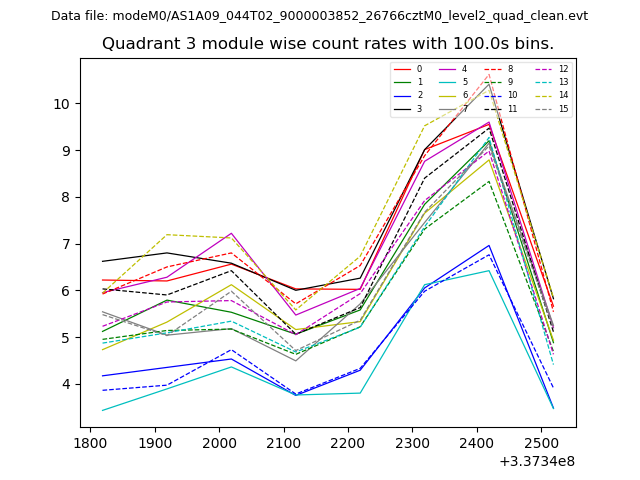
| Module-wise count rates for Quadrant A Data is divided into 100 sec bins |
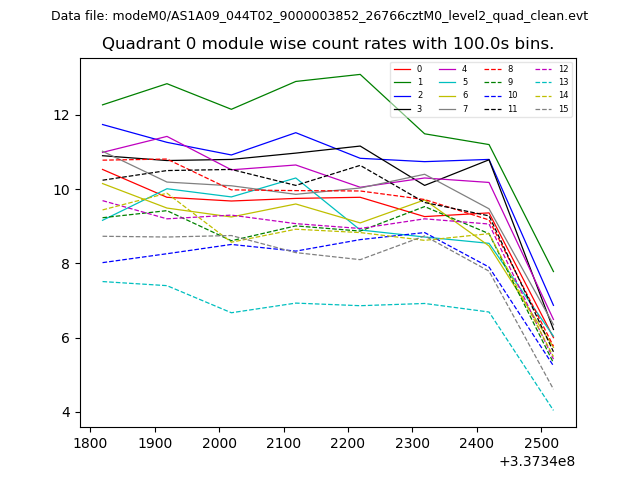 |
 |
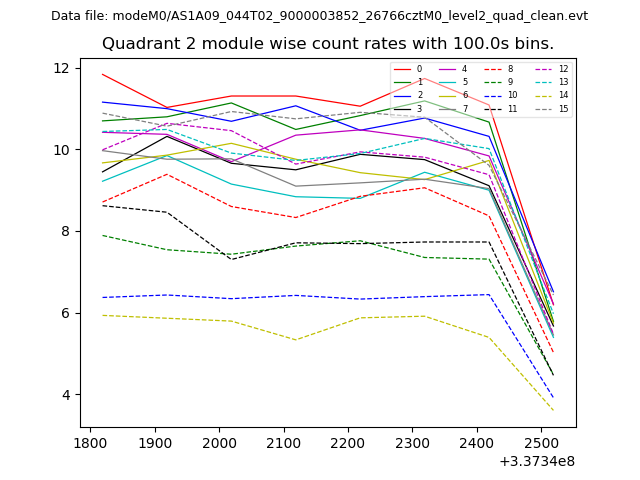
| Module-wise count rates for Quadrant B Data is divided into 100 sec bins |
 |
 |
| Module-wise count rates for Quadrant C Data is divided into 100 sec bins |
 |
 |
| Module-wise count rates for Quadrant D Data is divided into 100 sec bins |
 |
 |
| Parameter | Plot |
|---|---|
| CZT HV Monitor | 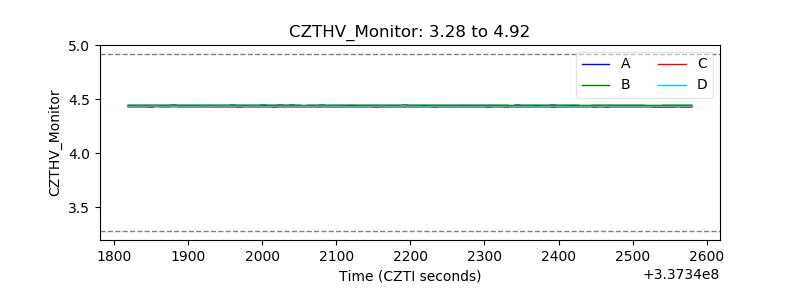 |
| D_VDD | 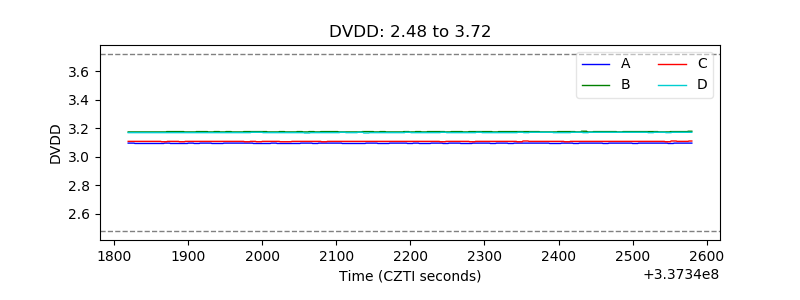 |
| Temperature 1 | 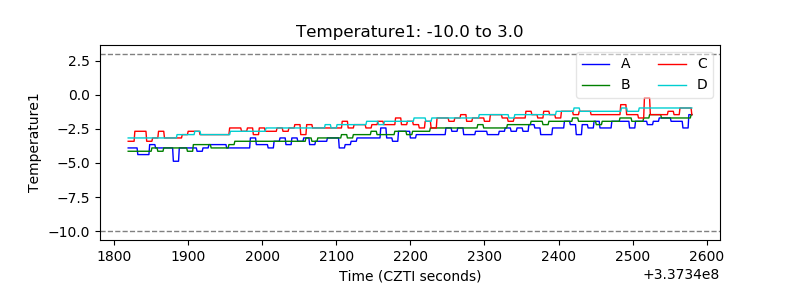 |
| Veto HV Monitor | 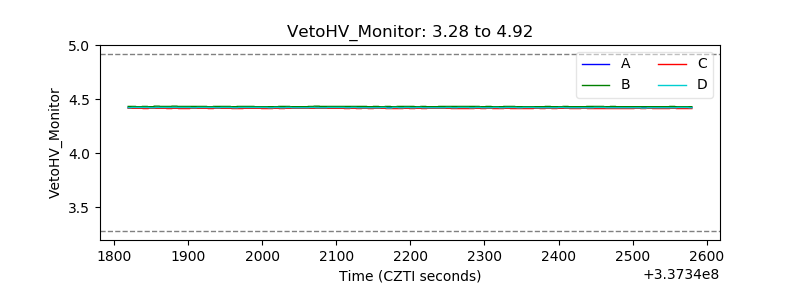 |
| Veto LLD | 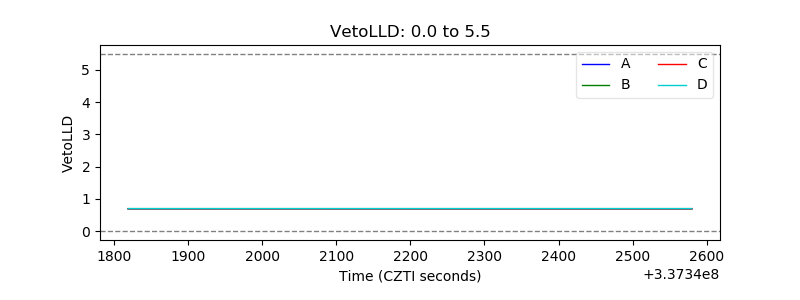 |
| Alpha Counter | 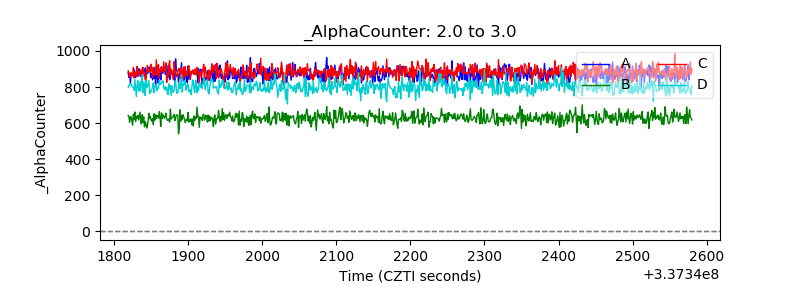 |
| _CPM_Rate | 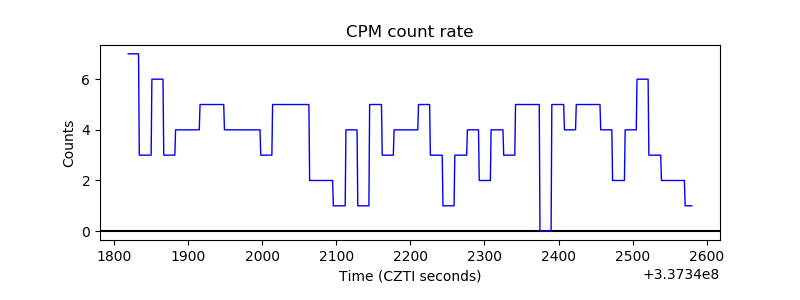 |
| CZT Counter | 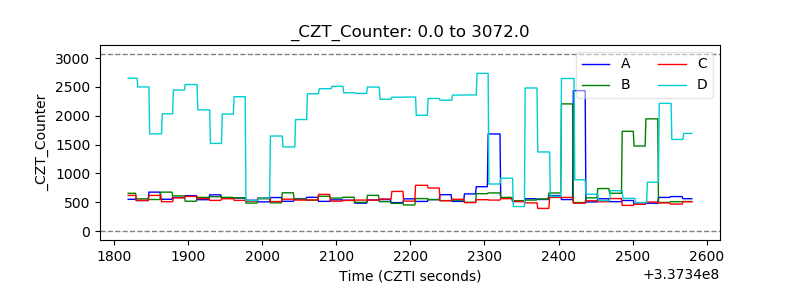 |
| +2.5 Volts monitor |  |
| +5 Volts monitor |  |
| _ROLL_ROT | 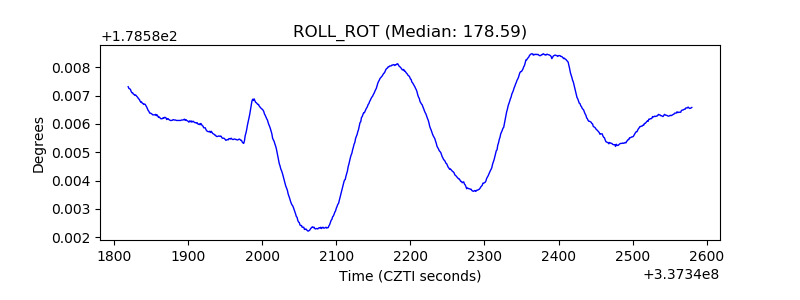 |
| _Roll_DEC | 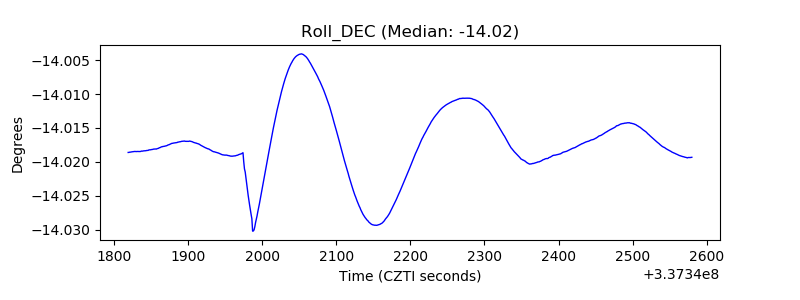 |
| _Roll_RA | 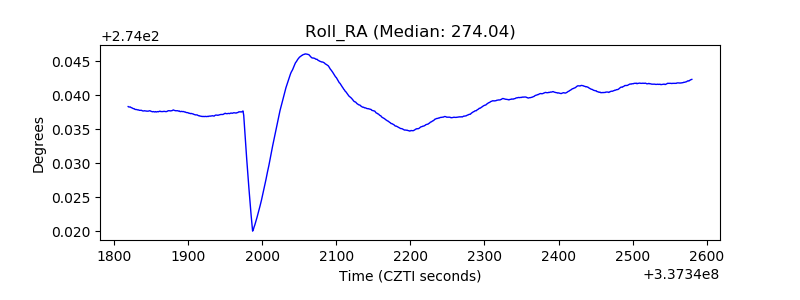 |
| Veto Counter | 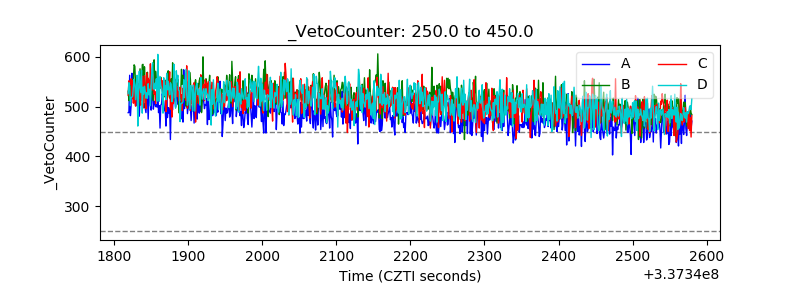 |