| Param | Original file | Final file |
|---|---|---|
| Filename | modeM0/AS1A09_038T07_9000003858cztM0_level2.fits | modeM0/AS1A09_038T07_9000003858cztM0_level2_quad_clean.evt |
| Size (bytes) | 47,041,920 | 38,393,280 |
| Size | 44.9 MB | 36.6 MB |
| Events in quadrant A | 307,134 | 248,865 |
| Events in quadrant B | 210,252 | 134,242 |
| Events in quadrant C | 302,308 | 241,287 |
| Events in quadrant D | 218,174 | 152,471 |
| Mode M0 | |||
|---|---|---|---|
| Quadrant | BADHDUFLAG | Total packets | Discarded packets |
| A | 0 | 16183 | 0 |
| B | 0 | 33025 | 0 |
| C | 0 | 11386 | 0 |
| D | 0 | 28360 | 0 |
| Mode SS | |||
|---|---|---|---|
| Quadrant | BADHDUFLAG | Total packets | Discarded packets |
| A | 0 | 112 | 0 |
| B | 0 | 112 | 0 |
| C | 0 | 112 | 0 |
| D | 0 | 112 | 0 |
| Mode M9 | |||
|---|---|---|---|
| Quadrant | BADHDUFLAG | Total packets | Discarded packets |
| A | 0 | 5 | 0 |
| B | 0 | 5 | 0 |
| C | 0 | 5 | 0 |
| D | 0 | 5 | 0 |
| Quadrant | Total seconds | Saturated seconds | Saturation percentage |
|---|---|---|---|
| A | 5494 | 119 | 2.165999% |
| B | 5494 | 3123 | 56.843830% |
| C | 5494 | 60 | 1.092100% |
| D | 5494 | 2010 | 36.585366% |
Noise dominated data is calculated using 1-second bins in cleaned event files. If a bin has >2000 counts, and if more than 50% of those come from <1% of pixels, then it is considered to be noise-dominated and hence unusable.
| Quadrant | # 1 sec bins | Bins with >0 counts | Bins with >2000 counts | High rate bins dominated by noise | Noise dominated (total time) | Noise dominated (detector-on time) | Marked lightcurve |
|---|---|---|---|---|---|---|---|
| A | 5949 | 5494 | 0 | 0 | 0.00% | 0.00% |  |
| B | 5949 | 5478 | 0 | 0 | 0.00% | 0.00% |  |
| C | 5949 | 5494 | 0 | 0 | 0.00% | 0.00% |  |
| D | 5949 | 5478 | 0 | 0 | 0.00% | 0.00% |  |
Top three noisy pixels from each quadrant. If the there are fewer than three noisy pixels in the level2.evt file, extra rows are filled as -1
| Pixel properties | Quadrant properties | ||||||
|---|---|---|---|---|---|---|---|
| Quadrant | DetID | PixID | Counts | Sigma | Mean | Median | Sigma |
| A | 0 | 29 | 271 | 9.03 | 80 | 75 | 21.7 |
| A | 0 | 30 | 256 | 8.34 | 80 | 75 | 21.7 |
| A | 7 | 110 | 246 | 7.88 | 80 | 75 | 21.7 |
| B | 2 | 9 | 160 | 7.98 | 55 | 53 | 13.4 |
| B | 14 | 254 | 148 | 7.08 | 55 | 53 | 13.4 |
| B | 5 | 232 | 143 | 6.71 | 55 | 53 | 13.4 |
| C | 2 | 191 | 217 | 6.38 | 80 | 75 | 22.2 |
| C | 12 | 241 | 213 | 6.2 | 80 | 75 | 22.2 |
| C | 7 | 233 | 203 | 5.75 | 80 | 75 | 22.2 |
| D | 3 | 14 | 169 | 6.18 | 62 | 56 | 18.3 |
| D | 6 | 67 | 166 | 6.02 | 62 | 56 | 18.3 |
| D | 10 | 189 | 157 | 5.53 | 62 | 56 | 18.3 |
Histogram calculated using DETX and DETY for each event in the final _common_clean file
| Quadrant A | 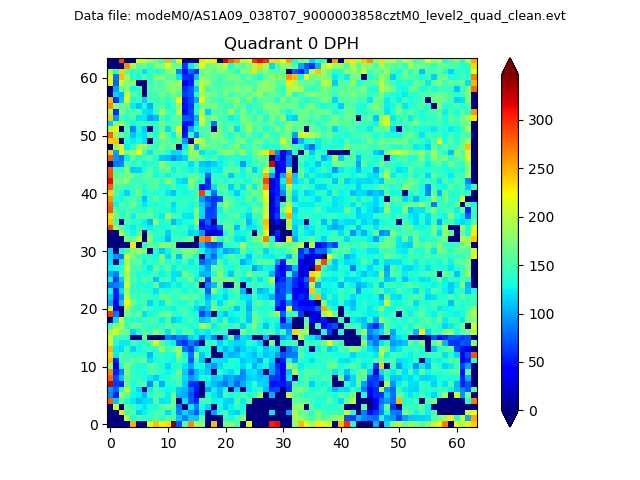 |
 |
Quadrant B |
|---|---|---|---|
| Quadrant D | 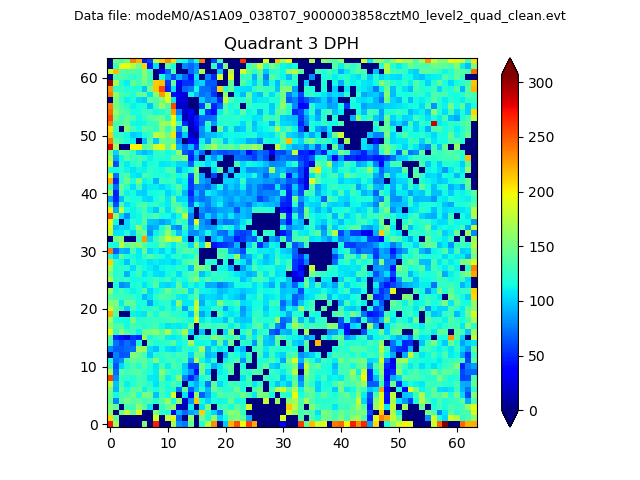 |
 |
Quadrant C |
| Plot type | Count rate plots | Images |
|---|---|---|
| Comparison with Poisson distribution Blue bars denote a histogram of data divided into 1 sec bins. Red curve is a Poisson curve with rate = median count rate of data. |
 |
 |
| Quadrant-wise count rates Data is divided into 100 sec bins |
 |
|
| Module-wise count rates for Quadrant A Data is divided into 100 sec bins |
 |
 |
| Module-wise count rates for Quadrant B Data is divided into 100 sec bins |
 |
 |
| Module-wise count rates for Quadrant C Data is divided into 100 sec bins |
 |
 |
| Module-wise count rates for Quadrant D Data is divided into 100 sec bins |
 |
 |
| Parameter | Plot |
|---|---|
| CZT HV Monitor |  |
| D_VDD | 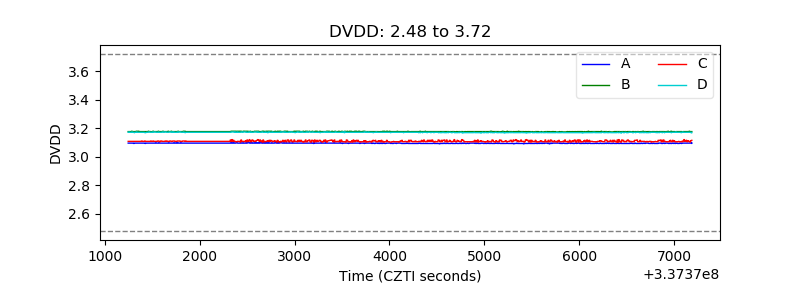 |
| Temperature 1 |  |
| Veto HV Monitor |  |
| Veto LLD |  |
| Alpha Counter |  |
| _CPM_Rate |  |
| CZT Counter |  |
| +2.5 Volts monitor |  |
| +5 Volts monitor |  |
| _ROLL_ROT |  |
| _Roll_DEC |  |
| _Roll_RA |  |
| Veto Counter |  |