| Param | Original file | Final file |
|---|---|---|
| Filename | modeM0/AS1A09_038T07_9000003858_26770cztM0_level2.evt | modeM0/AS1A09_038T07_9000003858_26770cztM0_level2_quad_clean.evt |
| Size (bytes) | 193,429,440 | 11,465,280 |
| Size | 184.5 MB | 10.9 MB |
| Events in quadrant A | 952,569 | 74,596 |
| Events in quadrant B | 2,129,340 | 50,132 |
| Events in quadrant C | 665,782 | 75,499 |
| Events in quadrant D | 2,026,416 | 55,216 |
| Mode M0 | |||
|---|---|---|---|
| Quadrant | BADHDUFLAG | Total packets | Discarded packets |
| A | 0 | 3720 | 0 |
| B | 0 | 7134 | 0 |
| C | 0 | 2697 | 0 |
| D | 0 | 6862 | 0 |
| Mode M9 | |||
|---|---|---|---|
| Quadrant | BADHDUFLAG | Total packets | Discarded packets |
| A | 0 | 5 | 0 |
| B | 0 | 5 | 0 |
| C | 0 | 5 | 0 |
| D | 0 | 5 | 0 |
| Quadrant | Total seconds | Saturated seconds | Saturation percentage |
|---|---|---|---|
| A | 1203 | 65 | 5.403159% |
| B | 1202 | 755 | 62.811980% |
| C | 1202 | 40 | 3.327787% |
| D | 1202 | 605 | 50.332779% |
Noise dominated data is calculated using 1-second bins in cleaned event files. If a bin has >2000 counts, and if more than 50% of those come from <1% of pixels, then it is considered to be noise-dominated and hence unusable.
| Quadrant | # 1 sec bins | Bins with >0 counts | Bins with >2000 counts | High rate bins dominated by noise | Noise dominated (total time) | Noise dominated (detector-on time) | Marked lightcurve |
|---|---|---|---|---|---|---|---|
| A | 1658 | 1204 | 5 | 5 | 0.30% | 0.42% | 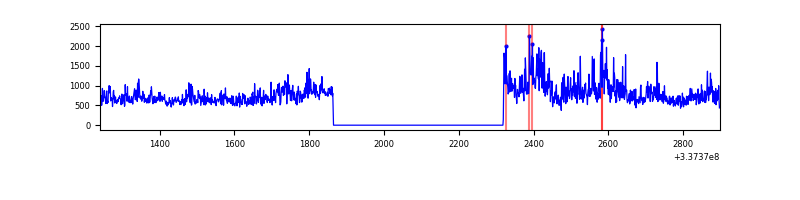 |
| B | 1657 | 1202 | 571 | 571 | 34.46% | 47.50% | 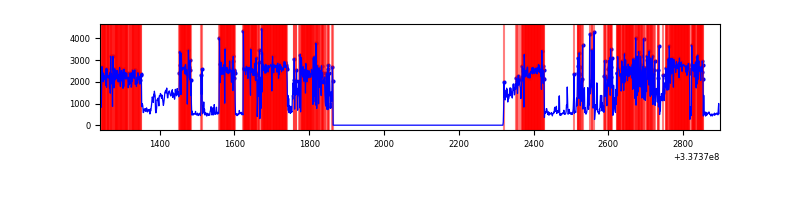 |
| C | 1657 | 1203 | 3 | 3 | 0.18% | 0.25% | 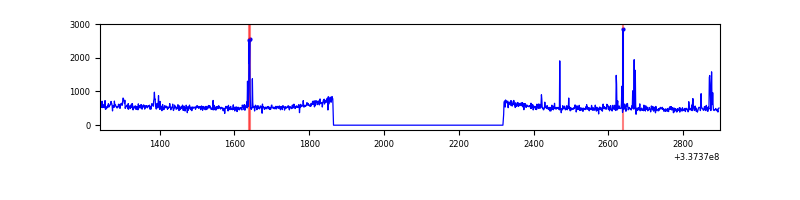 |
| D | 1657 | 1202 | 406 | 406 | 24.50% | 33.78% | 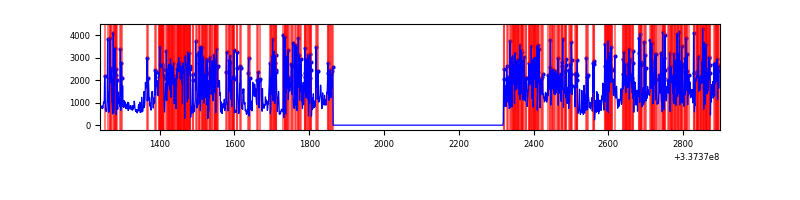 |
Top three noisy pixels from each quadrant. If the there are fewer than three noisy pixels in the level2.evt file, extra rows are filled as -1
| Pixel properties | Quadrant properties | ||||||
|---|---|---|---|---|---|---|---|
| Quadrant | DetID | PixID | Counts | Sigma | Mean | Median | Sigma |
| A | 0 | 13 | 324871 | 9361.69 | 162 | 158 | 34.7 |
| A | 13 | 254 | 2075 | 55.27 | 162 | 158 | 34.7 |
| A | 3 | 137 | 1609 | 41.83 | 162 | 158 | 34.7 |
| B | 0 | 189 | 1700053 | 74418.42 | 108 | 105 | 22.8 |
| B | 0 | 190 | 2666 | 112.11 | 108 | 105 | 22.8 |
| B | 12 | 111 | 2439 | 102.18 | 108 | 105 | 22.8 |
| C | 2 | 16 | 40382 | 1082.38 | 152 | 153 | 37.2 |
| C | 14 | 238 | 24224 | 647.64 | 152 | 153 | 37.2 |
| C | 8 | 128 | 1764 | 43.34 | 152 | 153 | 37.2 |
| D | 7 | 80 | 1479028 | 44568.86 | 127 | 123 | 33.2 |
| D | 2 | 250 | 23126 | 693.23 | 127 | 123 | 33.2 |
| D | 1 | 52 | 18249 | 546.25 | 127 | 123 | 33.2 |
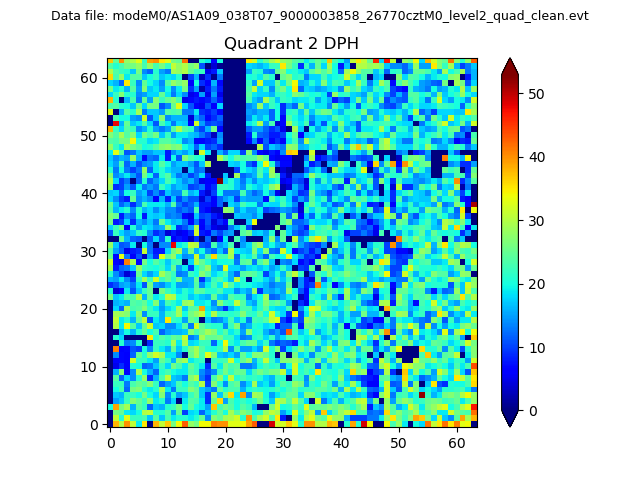
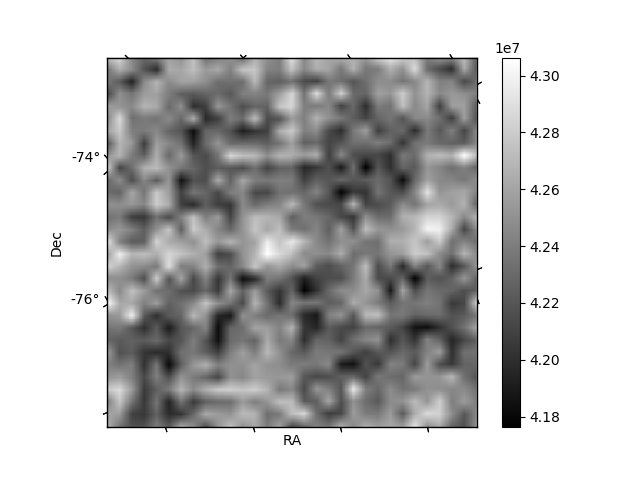
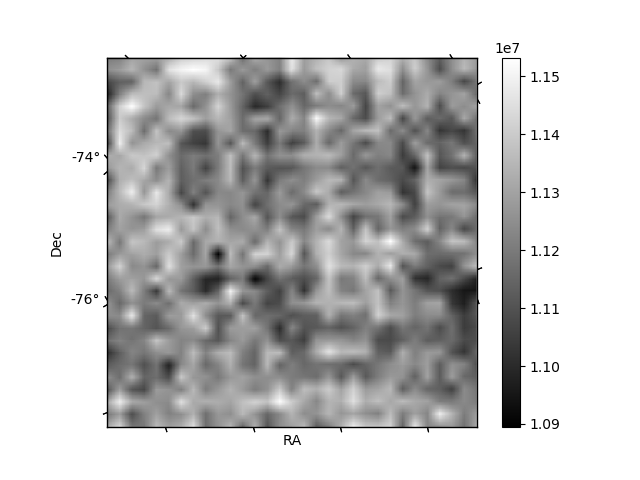
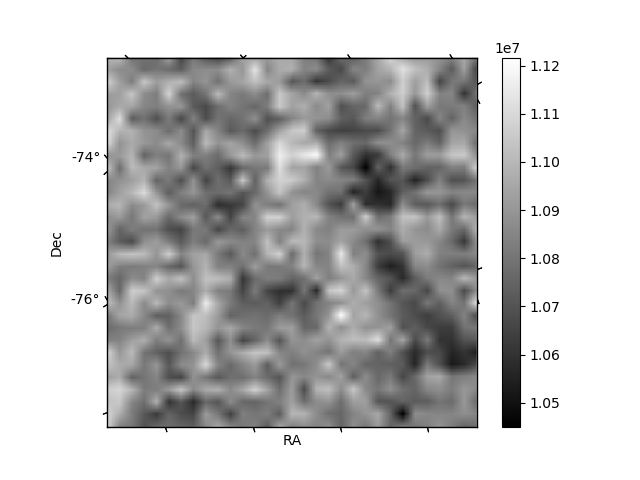
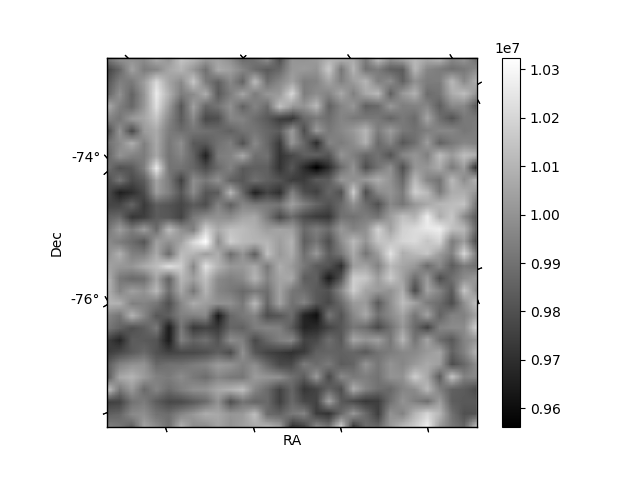
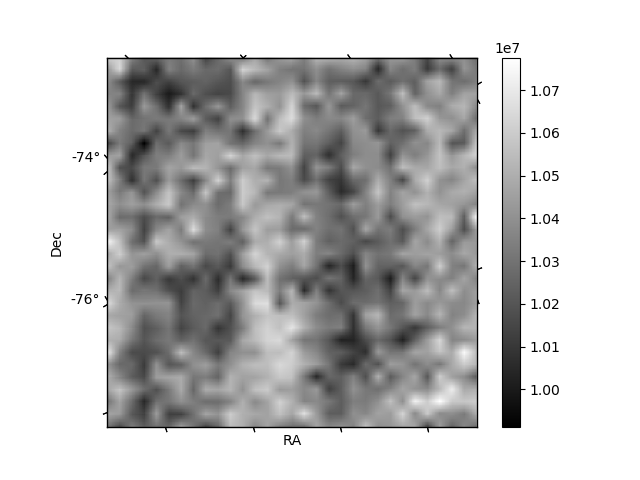
Histogram calculated using DETX and DETY for each event in the final _common_clean file
| Quadrant A | 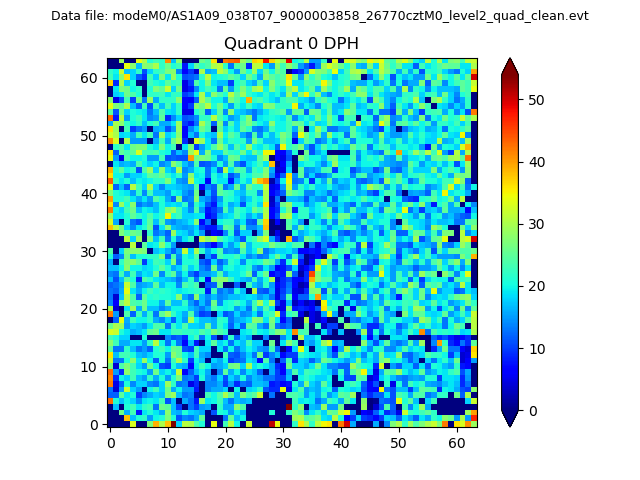 |
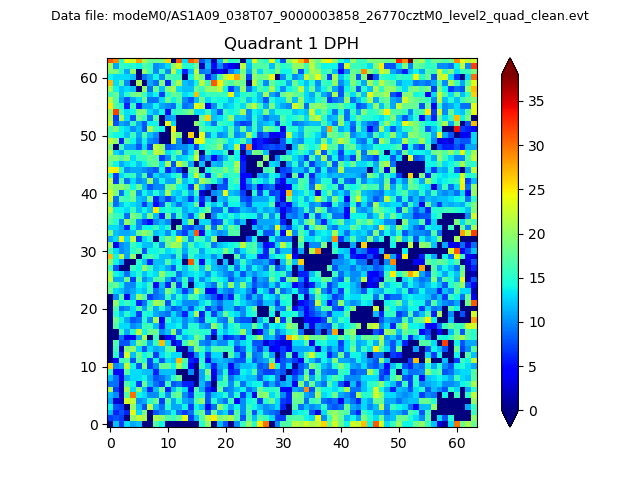 |
Quadrant B |
|---|---|---|---|
| Quadrant D | 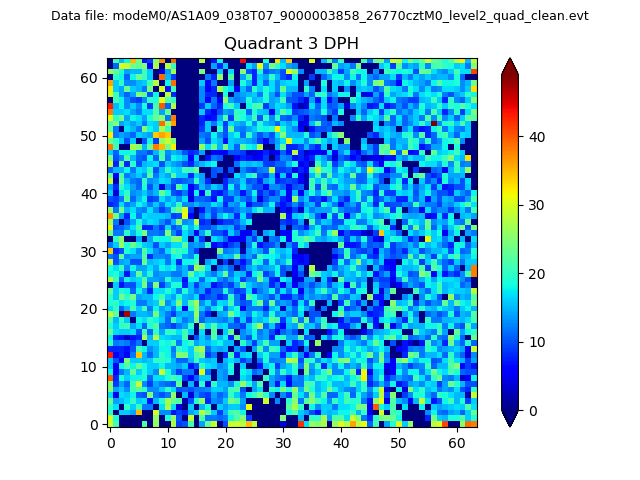 |
 |
Quadrant C |
| Plot type | Count rate plots | Images |
|---|---|---|
| Comparison with Poisson distribution Blue bars denote a histogram of data divided into 1 sec bins. Red curve is a Poisson curve with rate = median count rate of data. |
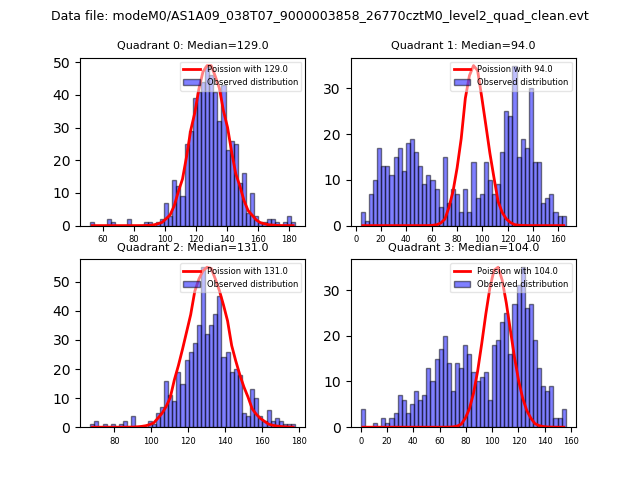 |
 |
| Quadrant-wise count rates Data is divided into 100 sec bins |
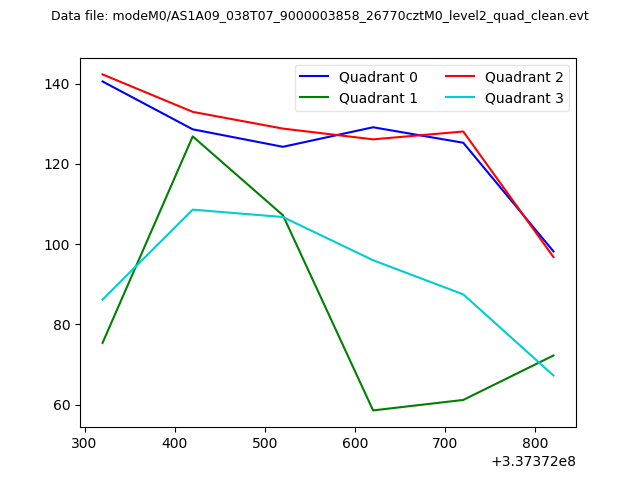 |
|
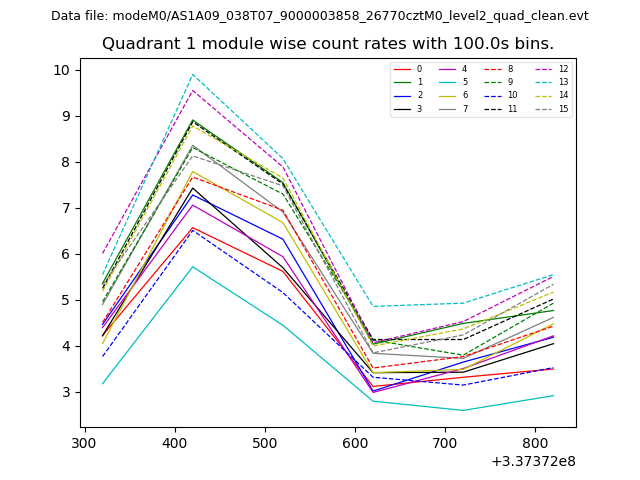
| Module-wise count rates for Quadrant A Data is divided into 100 sec bins |
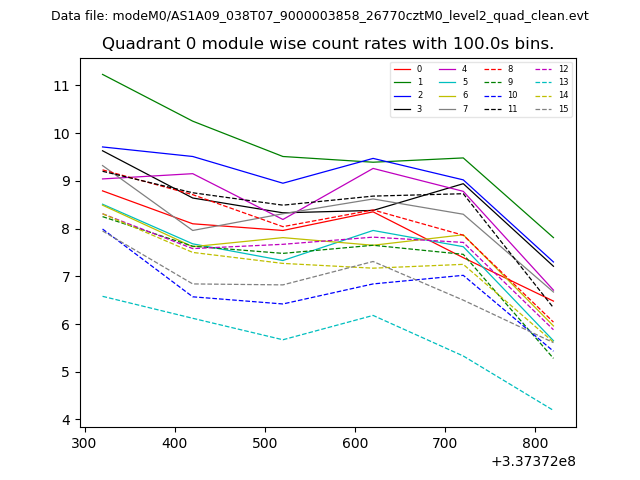 |
 |
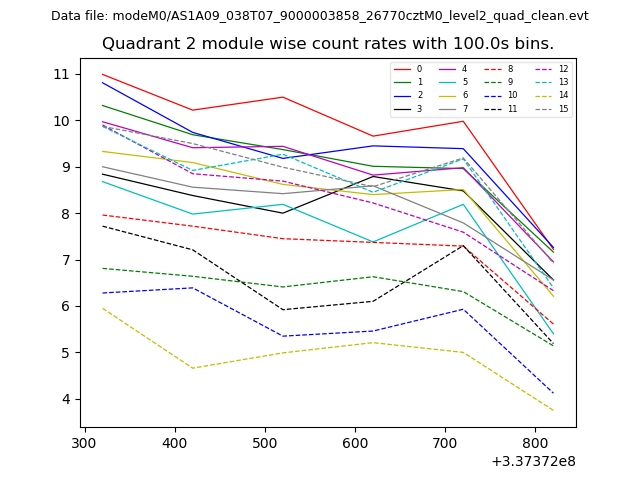
| Module-wise count rates for Quadrant B Data is divided into 100 sec bins |
 |
 |
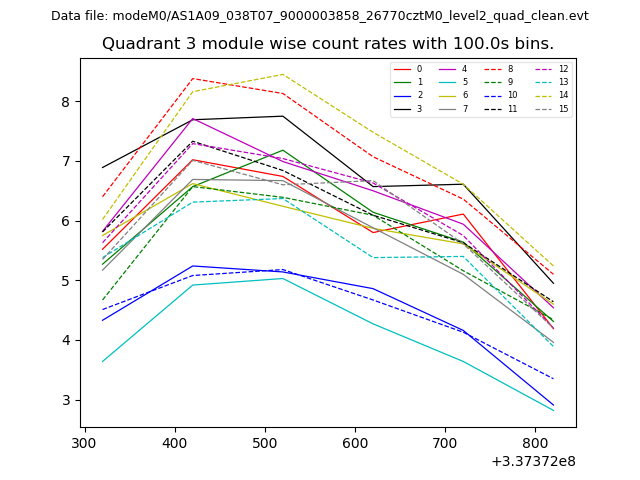
| Module-wise count rates for Quadrant C Data is divided into 100 sec bins |
 |
 |
| Module-wise count rates for Quadrant D Data is divided into 100 sec bins |
 |
 |
| Parameter | Plot |
|---|---|
| CZT HV Monitor | 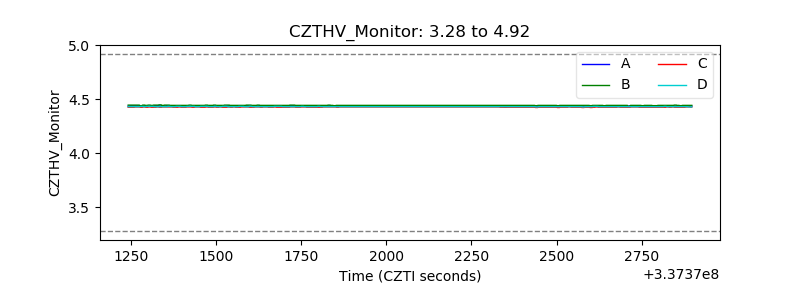 |
| D_VDD | 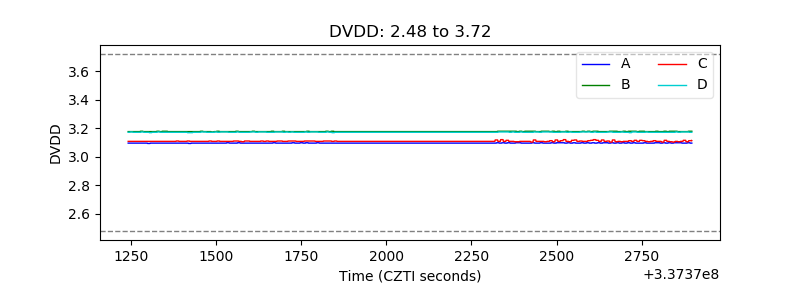 |
| Temperature 1 | 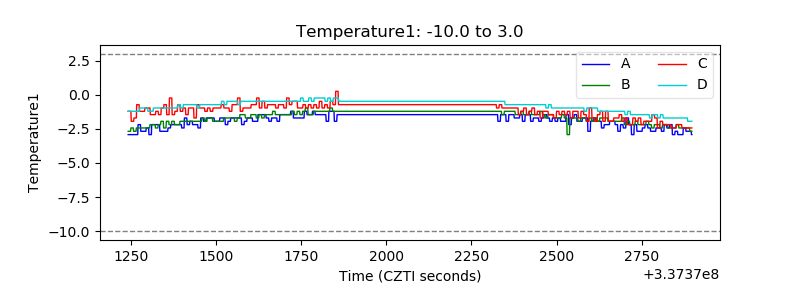 |
| Veto HV Monitor | 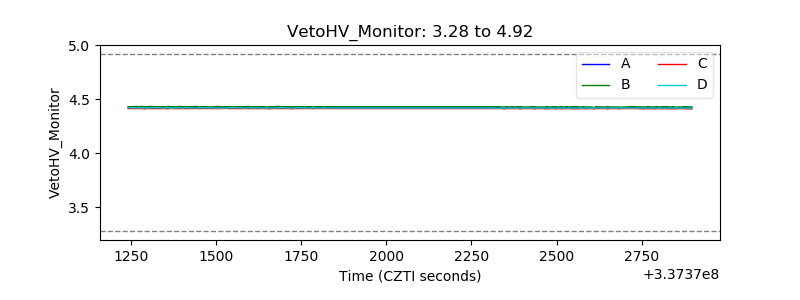 |
| Veto LLD | 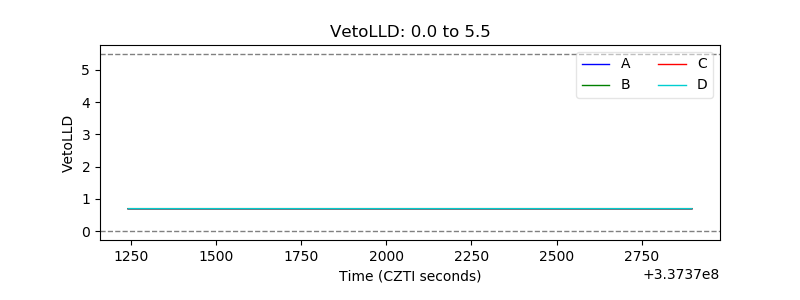 |
| Alpha Counter | 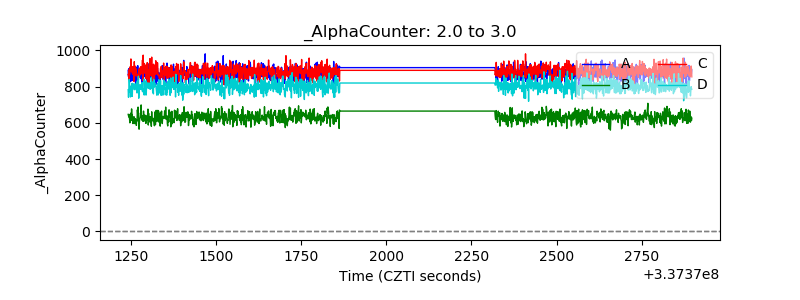 |
| _CPM_Rate | 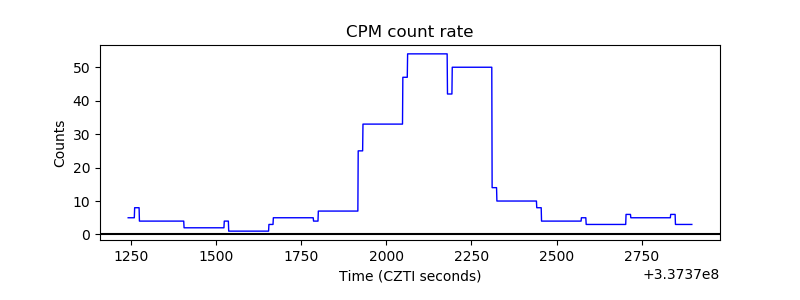 |
| CZT Counter | 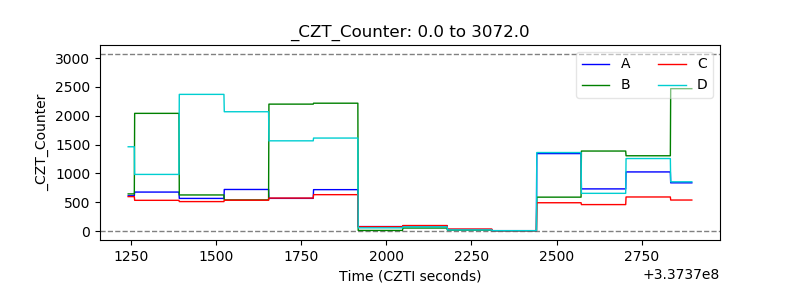 |
| +2.5 Volts monitor |  |
| +5 Volts monitor |  |
| _ROLL_ROT | 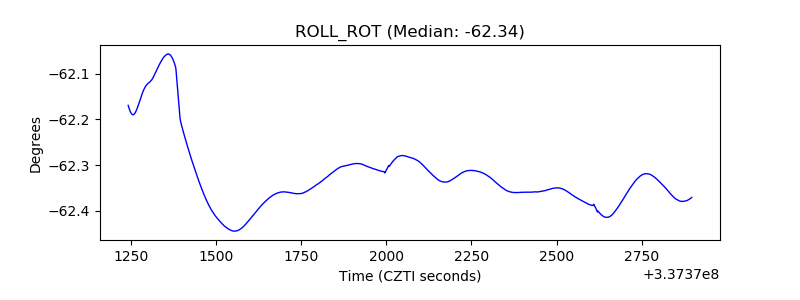 |
| _Roll_DEC | 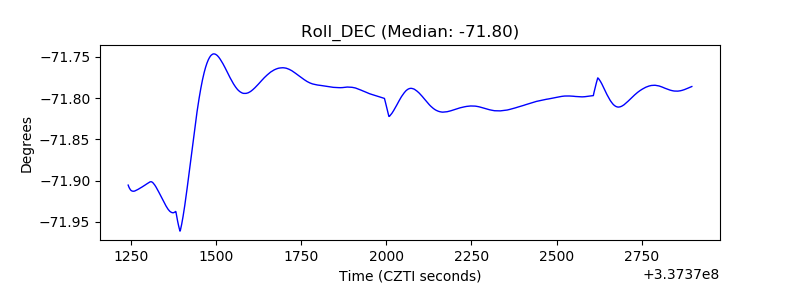 |
| _Roll_RA | 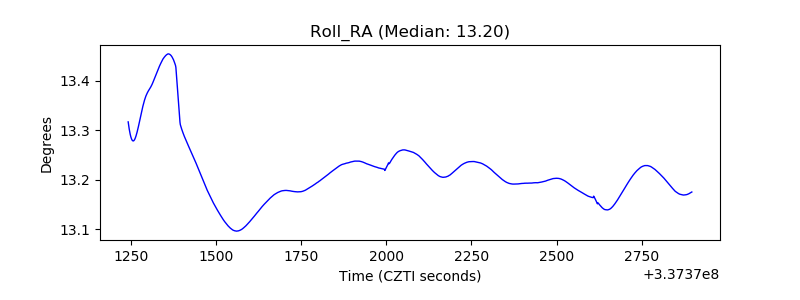 |
| Veto Counter | 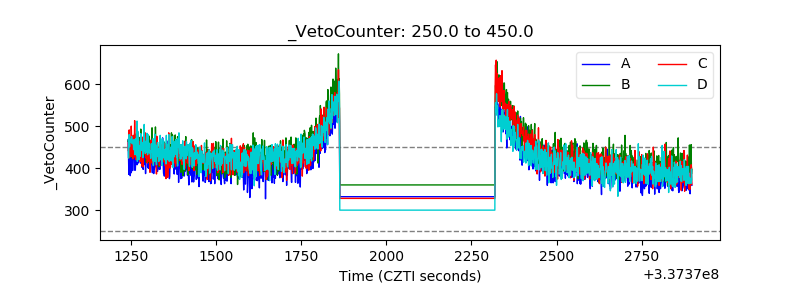 |