| Param | Original file | Final file |
|---|---|---|
| Filename | modeM0/AS1A09_038T07_9000003858_26772cztM0_level2.evt | modeM0/AS1A09_038T07_9000003858_26772cztM0_level2_quad_clean.evt |
| Size (bytes) | 692,691,840 | 69,416,640 |
| Size | 660.6 MB | 66.2 MB |
| Events in quadrant A | 3,425,300 | 496,774 |
| Events in quadrant B | 8,312,440 | 388,267 |
| Events in quadrant C | 2,116,404 | 492,322 |
| Events in quadrant D | 6,814,744 | 400,621 |
| Mode M0 | |||
|---|---|---|---|
| Quadrant | BADHDUFLAG | Total packets | Discarded packets |
| A | 0 | 13321 | 0 |
| B | 0 | 27824 | 0 |
| C | 0 | 9330 | 0 |
| D | 0 | 23377 | 0 |
| Quadrant | Total seconds | Saturated seconds | Saturation percentage |
|---|---|---|---|
| A | 4583 | 58 | 1.265547% |
| B | 4584 | 2572 | 56.108202% |
| C | 4584 | 24 | 0.523560% |
| D | 4584 | 1570 | 34.249564% |
Noise dominated data is calculated using 1-second bins in cleaned event files. If a bin has >2000 counts, and if more than 50% of those come from <1% of pixels, then it is considered to be noise-dominated and hence unusable.
| Quadrant | # 1 sec bins | Bins with >0 counts | Bins with >2000 counts | High rate bins dominated by noise | Noise dominated (total time) | Noise dominated (detector-on time) | Marked lightcurve |
|---|---|---|---|---|---|---|---|
| A | 4583 | 4583 | 46 | 46 | 1.00% | 1.00% | 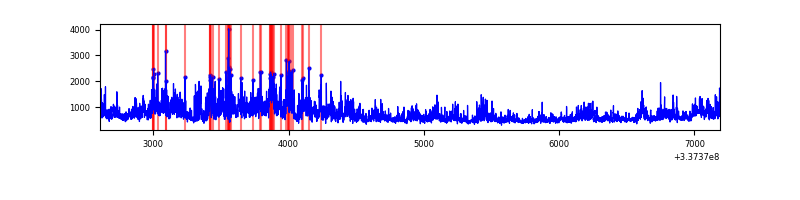 |
| B | 4584 | 4584 | 2246 | 2246 | 49.00% | 49.00% | 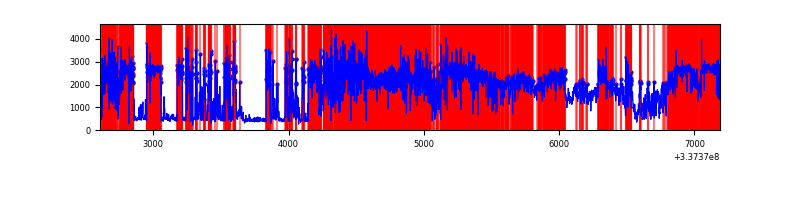 |
| C | 4584 | 4584 | 1 | 1 | 0.02% | 0.02% | 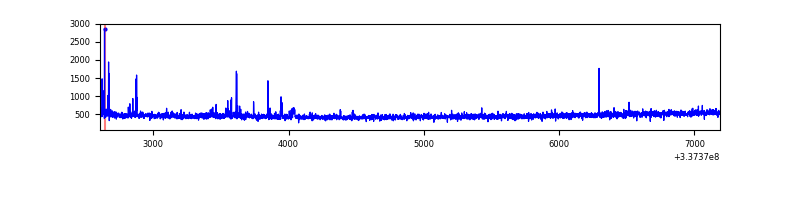 |
| D | 4584 | 4584 | 1322 | 1322 | 28.84% | 28.84% | 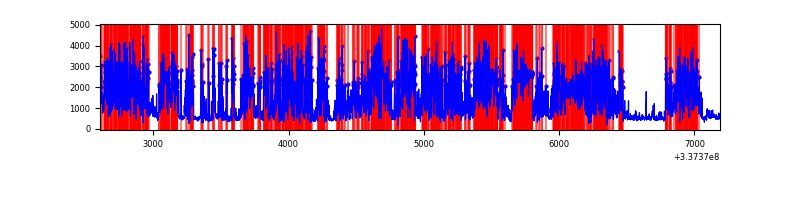 |
Top three noisy pixels from each quadrant. If the there are fewer than three noisy pixels in the level2.evt file, extra rows are filled as -1
| Pixel properties | Quadrant properties | ||||||
|---|---|---|---|---|---|---|---|
| Quadrant | DetID | PixID | Counts | Sigma | Mean | Median | Sigma |
| A | 0 | 13 | 1414819 | 13481.8 | 517 | 506 | 104.9 |
| A | 6 | 16 | 10456 | 94.85 | 517 | 506 | 104.9 |
| A | 13 | 254 | 8264 | 73.95 | 517 | 506 | 104.9 |
| B | 0 | 189 | 6712016 | 86297.32 | 407 | 396 | 77.8 |
| B | 12 | 111 | 9169 | 112.8 | 407 | 396 | 77.8 |
| B | 11 | 111 | 8145 | 99.64 | 407 | 396 | 77.8 |
| C | 14 | 238 | 80720 | 679.4 | 503 | 507 | 118.1 |
| C | 2 | 16 | 35359 | 295.2 | 503 | 507 | 118.1 |
| C | 1 | 0 | 19749 | 162.98 | 503 | 507 | 118.1 |
| D | 7 | 80 | 4781123 | 44943.07 | 436 | 425 | 106.4 |
| D | 1 | 52 | 254011 | 2383.95 | 436 | 425 | 106.4 |
| D | 2 | 250 | 77739 | 726.82 | 436 | 425 | 106.4 |
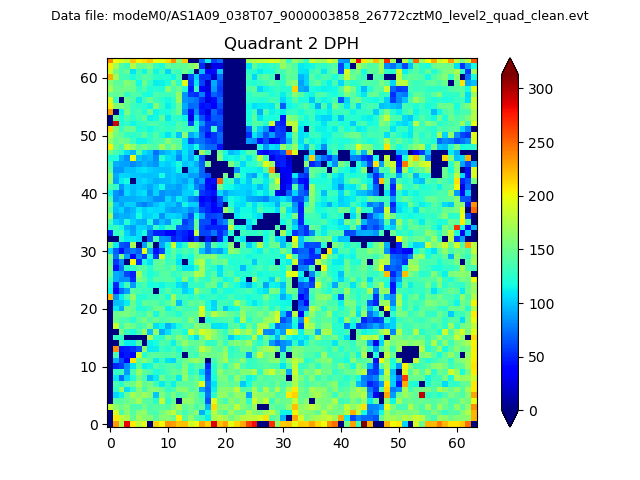
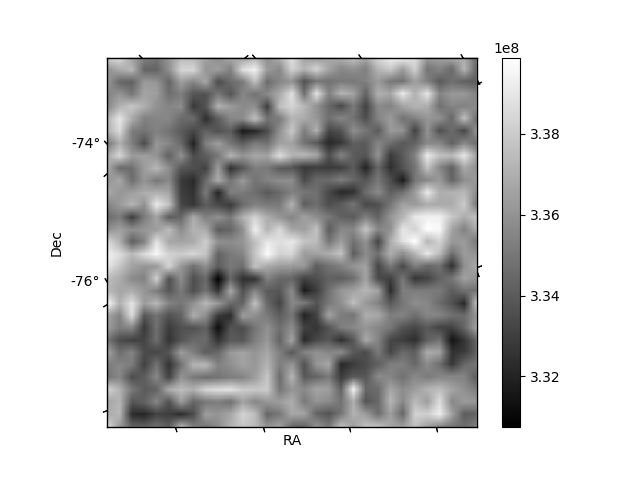
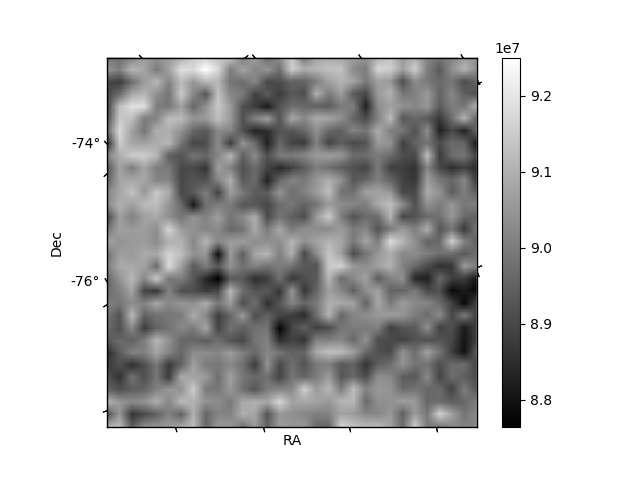
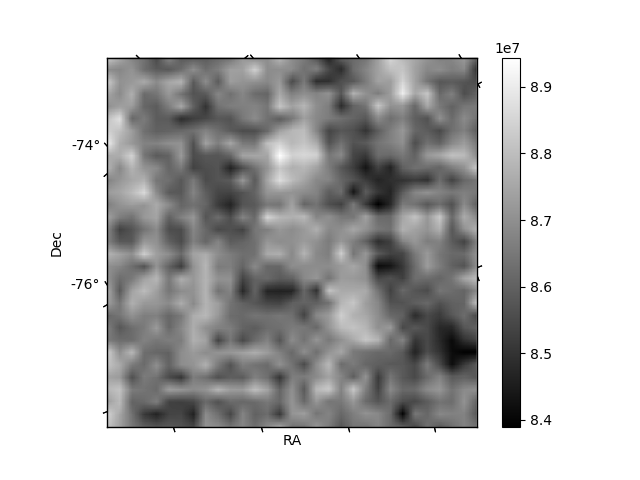
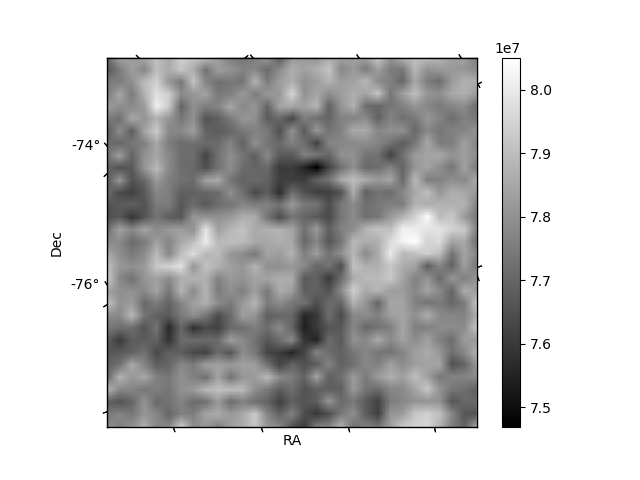
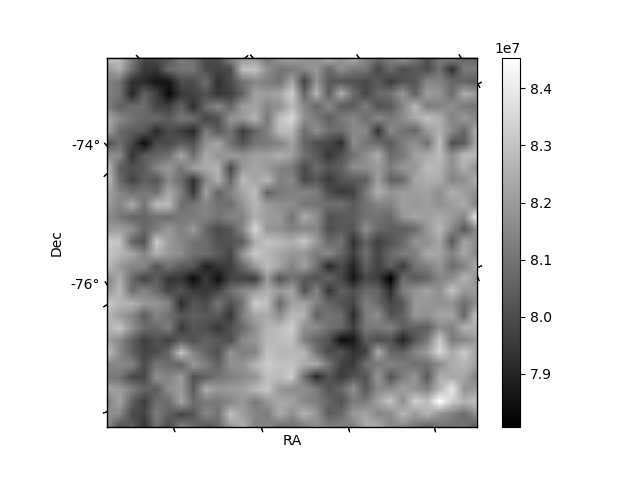
Histogram calculated using DETX and DETY for each event in the final _common_clean file
| Quadrant A | 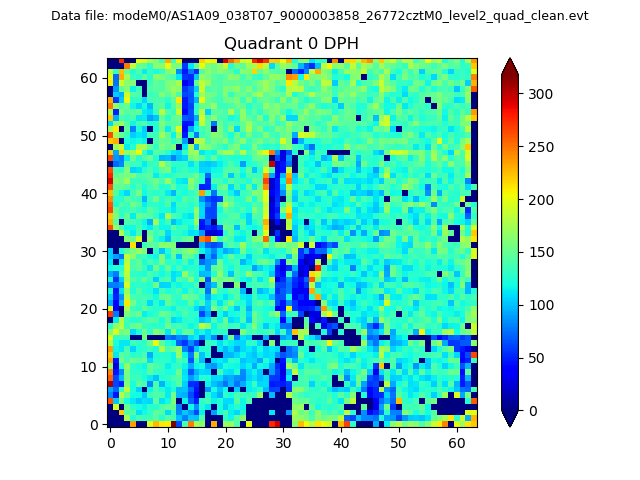 |
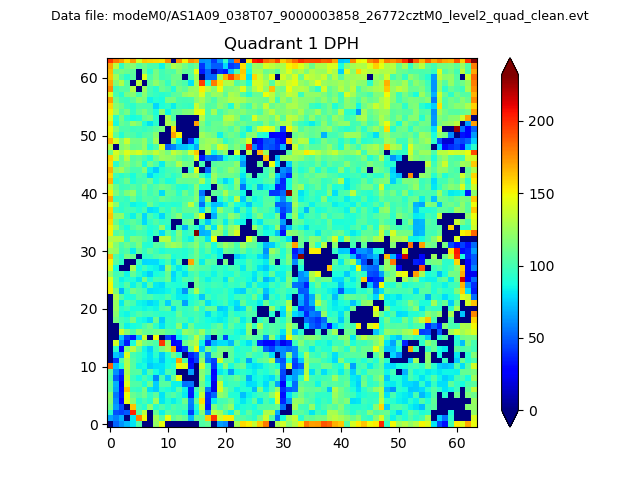 |
Quadrant B |
|---|---|---|---|
| Quadrant D | 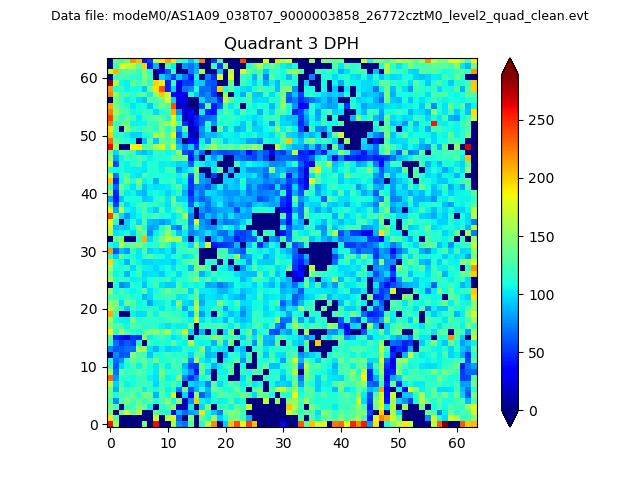 |
 |
Quadrant C |
| Plot type | Count rate plots | Images |
|---|---|---|
| Comparison with Poisson distribution Blue bars denote a histogram of data divided into 1 sec bins. Red curve is a Poisson curve with rate = median count rate of data. |
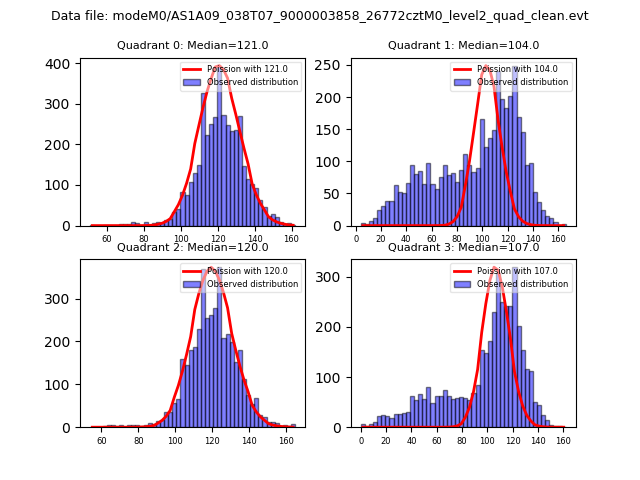 |
 |
| Quadrant-wise count rates Data is divided into 100 sec bins |
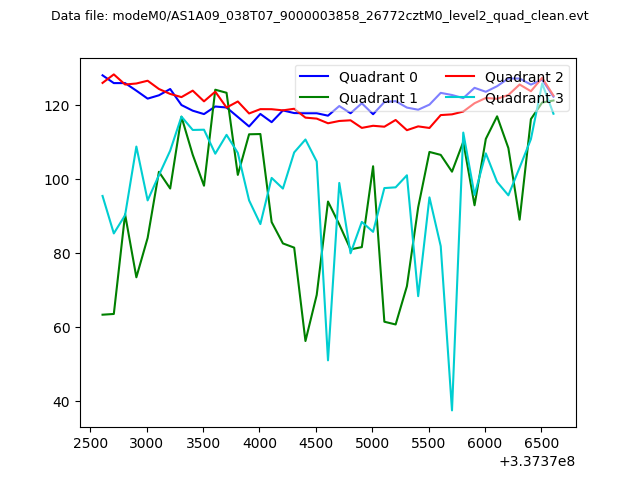 |
|
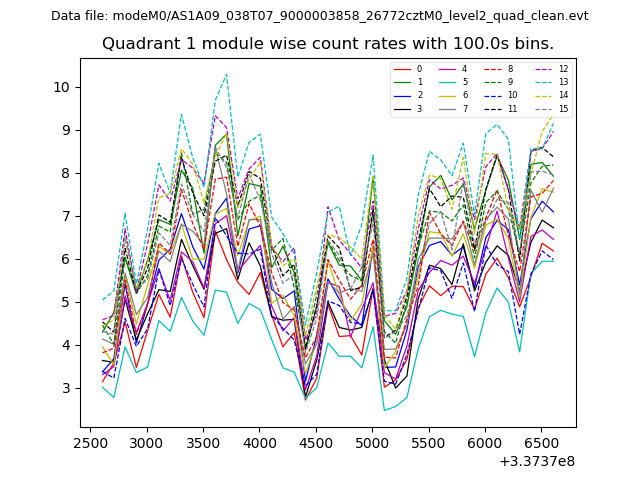
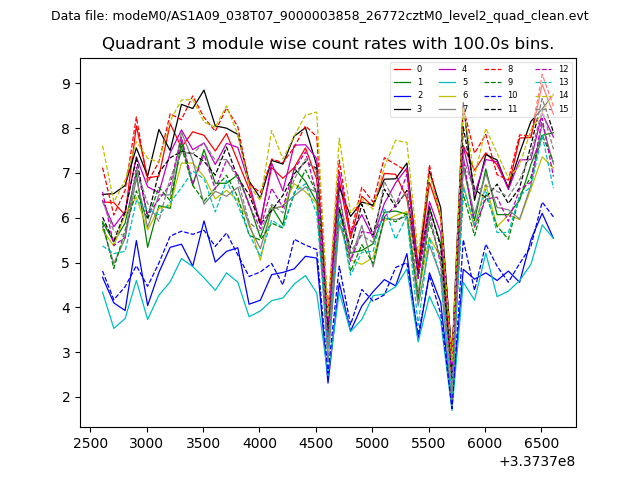
| Module-wise count rates for Quadrant A Data is divided into 100 sec bins |
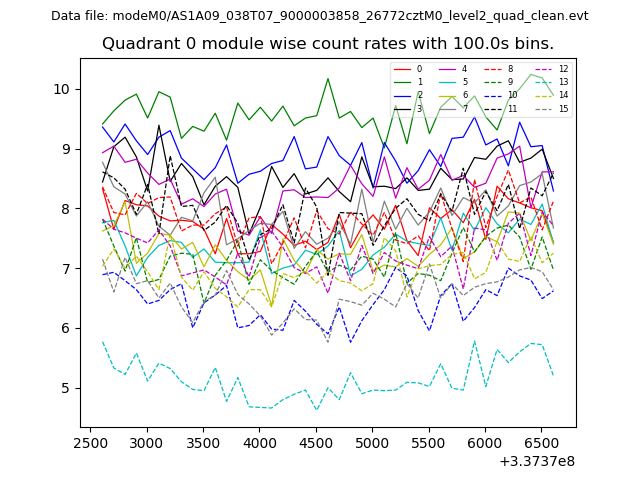 |
 |
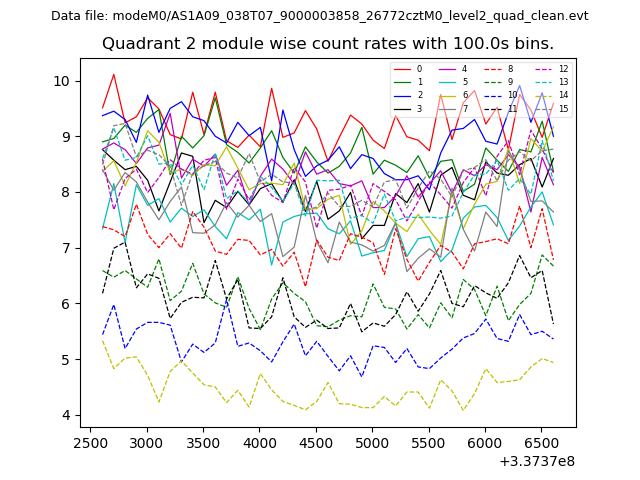
| Module-wise count rates for Quadrant B Data is divided into 100 sec bins |
 |
 |
| Module-wise count rates for Quadrant C Data is divided into 100 sec bins |
 |
 |
| Module-wise count rates for Quadrant D Data is divided into 100 sec bins |
 |
 |
| Parameter | Plot |
|---|---|
| CZT HV Monitor | 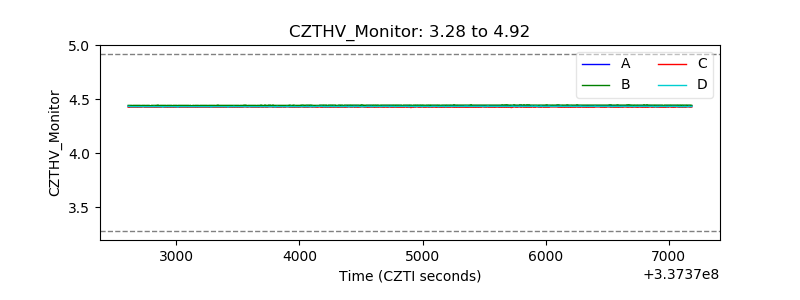 |
| D_VDD | 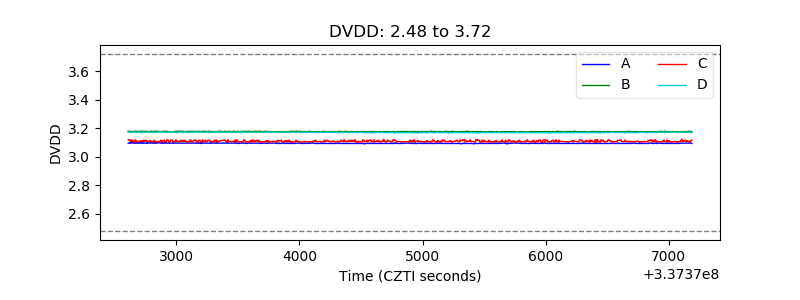 |
| Temperature 1 | 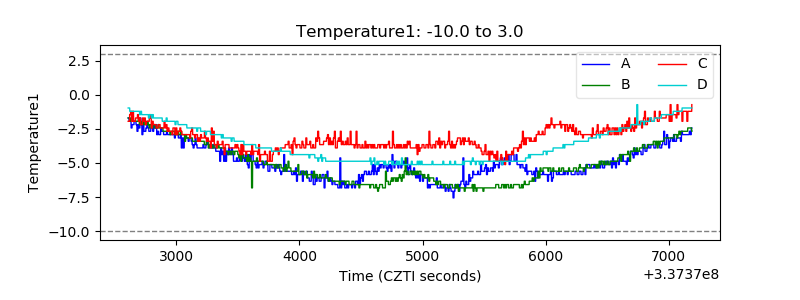 |
| Veto HV Monitor | 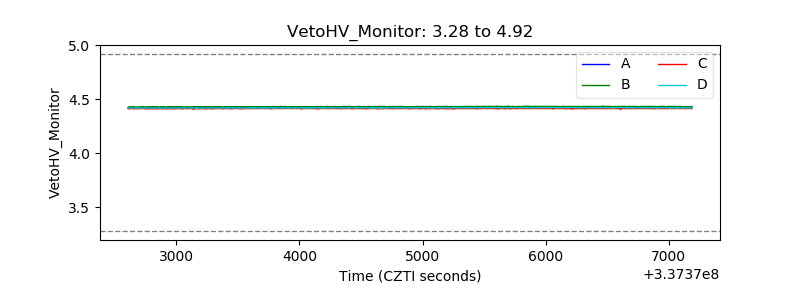 |
| Veto LLD | 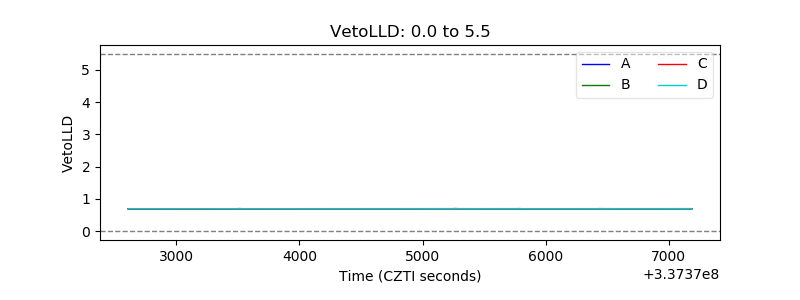 |
| Alpha Counter | 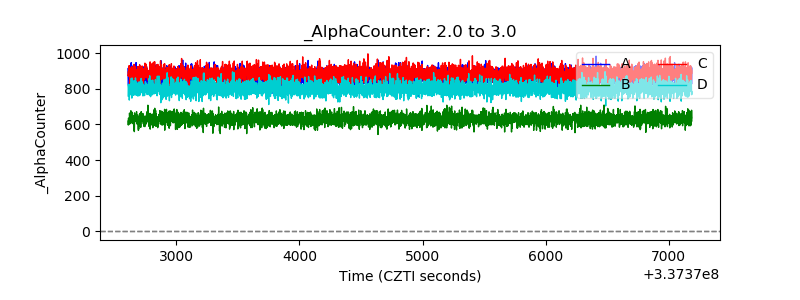 |
| _CPM_Rate | 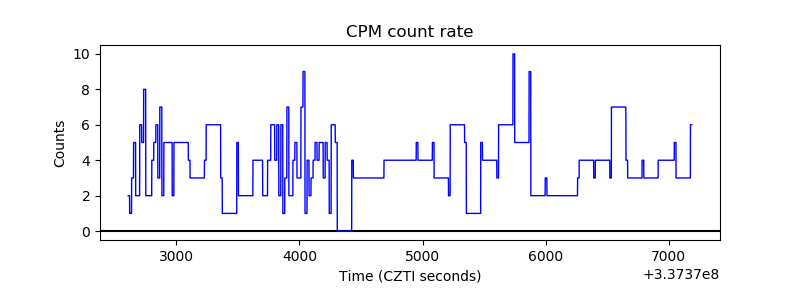 |
| CZT Counter | 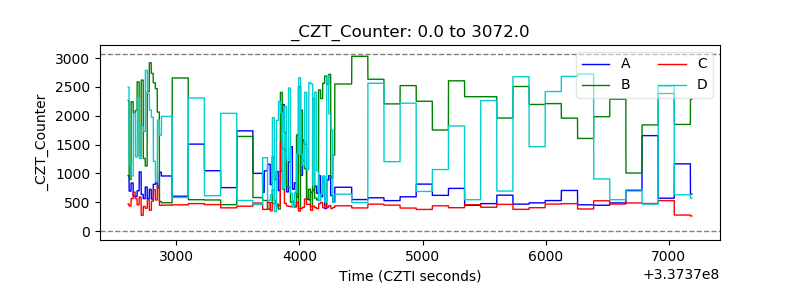 |
| +2.5 Volts monitor |  |
| +5 Volts monitor |  |
| _ROLL_ROT | 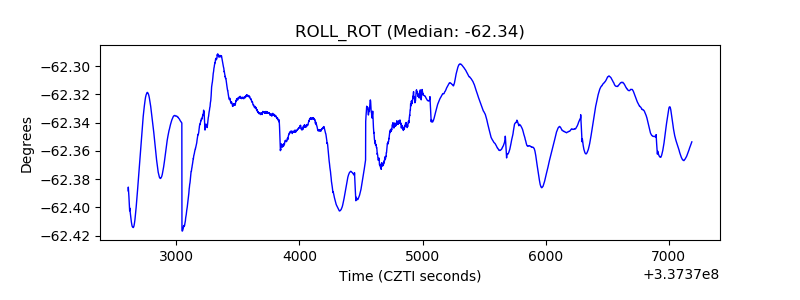 |
| _Roll_DEC | 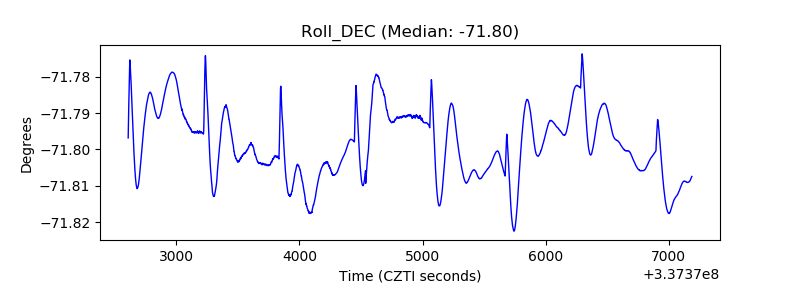 |
| _Roll_RA | 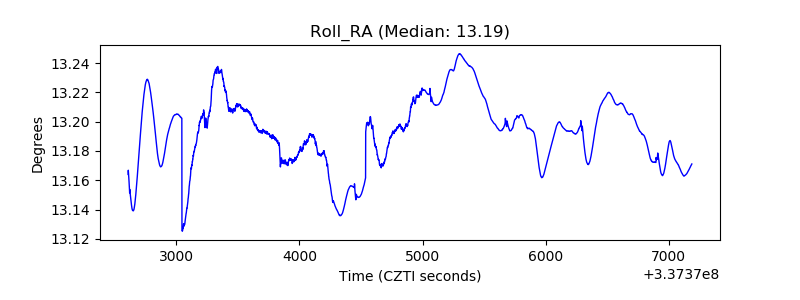 |
| Veto Counter | 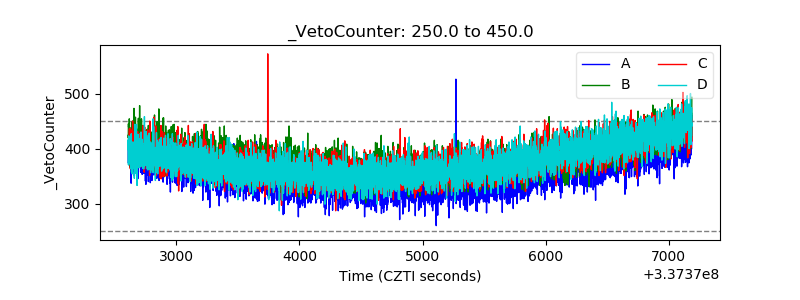 |