| Param | Original file | Final file |
|---|---|---|
| Filename | modeM0/AS1A09_038T08_9000003856_26769cztM0_level2.evt | modeM0/AS1A09_038T08_9000003856_26769cztM0_level2_quad_clean.evt |
| Size (bytes) | 315,066,240 | 37,356,480 |
| Size | 300.5 MB | 35.6 MB |
| Events in quadrant A | 1,422,264 | 259,247 |
| Events in quadrant B | 1,999,372 | 253,568 |
| Events in quadrant C | 1,323,563 | 259,577 |
| Events in quadrant D | 4,618,500 | 171,158 |
| Mode M9 | |||
|---|---|---|---|
| Quadrant | BADHDUFLAG | Total packets | Discarded packets |
| A | 0 | 4 | 0 |
| B | 0 | 4 | 0 |
| C | 0 | 4 | 0 |
| D | 0 | 4 | 0 |
| Mode M0 | |||
|---|---|---|---|
| Quadrant | BADHDUFLAG | Total packets | Discarded packets |
| A | 0 | 5796 | 0 |
| B | 0 | 7655 | 0 |
| C | 0 | 5557 | 0 |
| D | 0 | 15542 | 0 |
| Quadrant | Total seconds | Saturated seconds | Saturation percentage |
|---|---|---|---|
| A | 2610 | 59 | 2.260536% |
| B | 2610 | 242 | 9.272031% |
| C | 2610 | 48 | 1.839080% |
| D | 2610 | 1408 | 53.946360% |
Noise dominated data is calculated using 1-second bins in cleaned event files. If a bin has >2000 counts, and if more than 50% of those come from <1% of pixels, then it is considered to be noise-dominated and hence unusable.
| Quadrant | # 1 sec bins | Bins with >0 counts | Bins with >2000 counts | High rate bins dominated by noise | Noise dominated (total time) | Noise dominated (detector-on time) | Marked lightcurve |
|---|---|---|---|---|---|---|---|
| A | 2930 | 2611 | 14 | 14 | 0.48% | 0.54% | 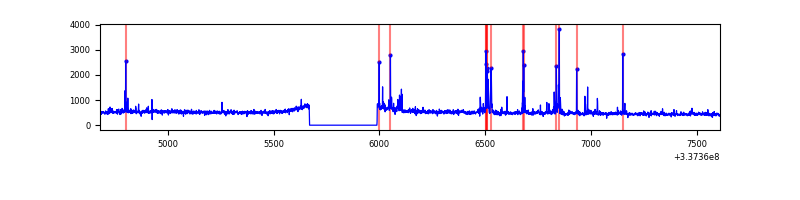 |
| B | 2930 | 2611 | 97 | 97 | 3.31% | 3.72% | 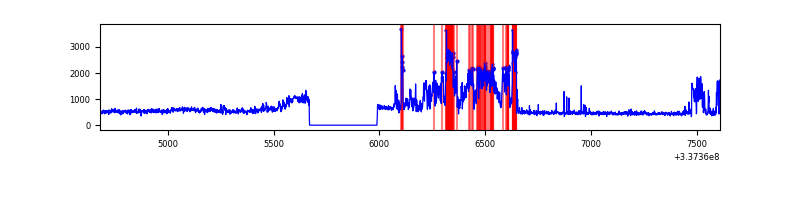 |
| C | 2930 | 2611 | 0 | 0 | 0.00% | 0.00% | 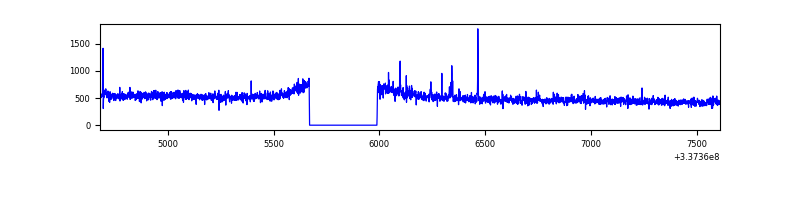 |
| D | 2930 | 2611 | 1027 | 1027 | 35.05% | 39.33% | 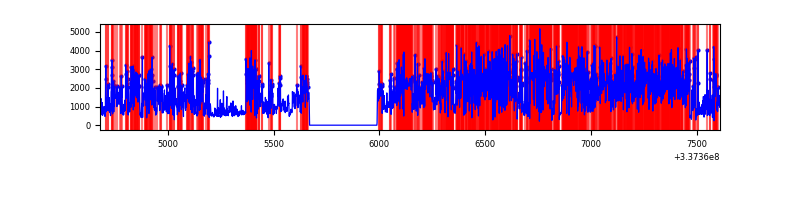 |
Top three noisy pixels from each quadrant. If the there are fewer than three noisy pixels in the level2.evt file, extra rows are filled as -1
| Pixel properties | Quadrant properties | ||||||
|---|---|---|---|---|---|---|---|
| Quadrant | DetID | PixID | Counts | Sigma | Mean | Median | Sigma |
| A | 0 | 13 | 122855 | 1801.32 | 336 | 329 | 68.0 |
| A | 13 | 254 | 4249 | 57.63 | 336 | 329 | 68.0 |
| A | 3 | 137 | 3287 | 43.49 | 336 | 329 | 68.0 |
| B | 0 | 189 | 712953 | 11110.48 | 324 | 315 | 64.1 |
| B | 12 | 111 | 7530 | 112.49 | 324 | 315 | 64.1 |
| B | 11 | 111 | 6810 | 101.26 | 324 | 315 | 64.1 |
| C | 14 | 238 | 51871 | 682.49 | 321 | 323 | 75.5 |
| C | 2 | 16 | 16526 | 214.53 | 321 | 323 | 75.5 |
| C | 13 | 61 | 2178 | 24.56 | 321 | 323 | 75.5 |
| D | 7 | 80 | 3470763 | 55651.6 | 249 | 241 | 62.4 |
| D | 1 | 52 | 104167 | 1666.51 | 249 | 241 | 62.4 |
| D | 2 | 250 | 64122 | 1024.36 | 249 | 241 | 62.4 |
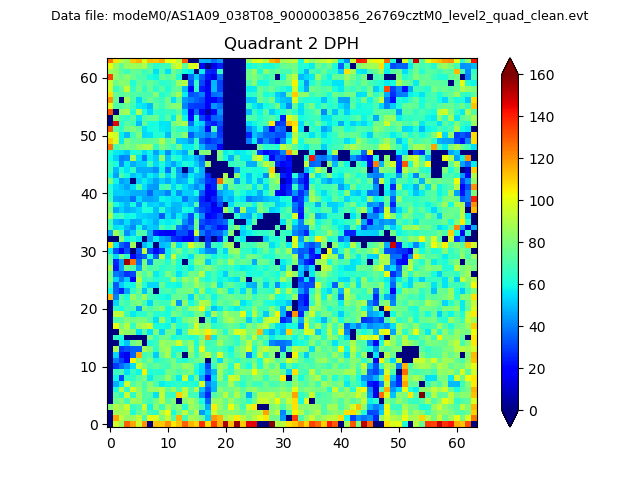
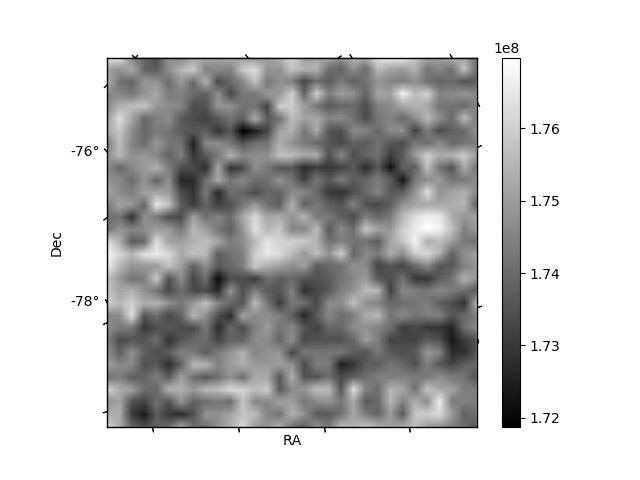
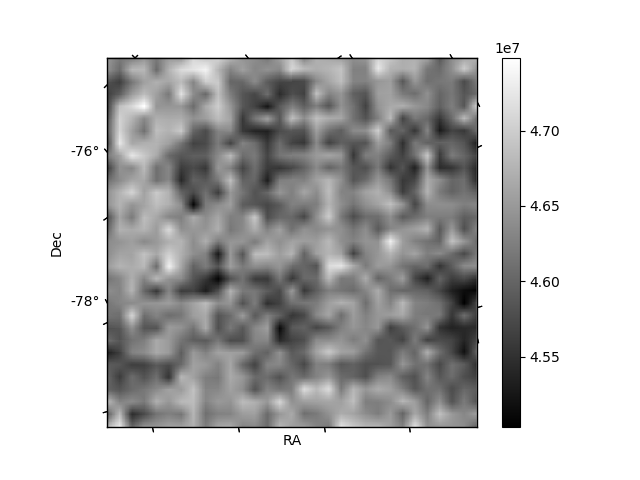
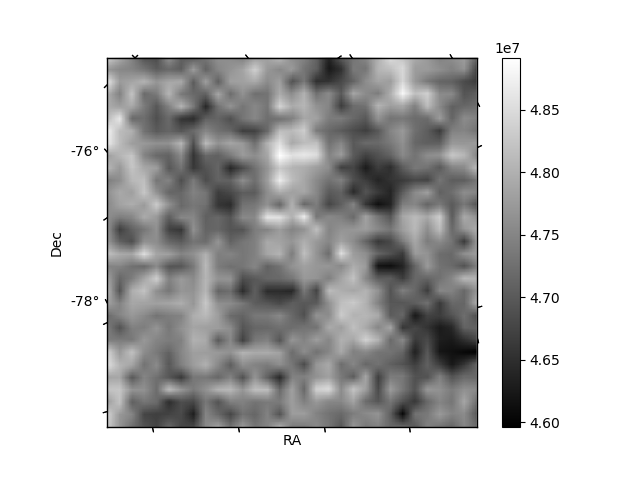
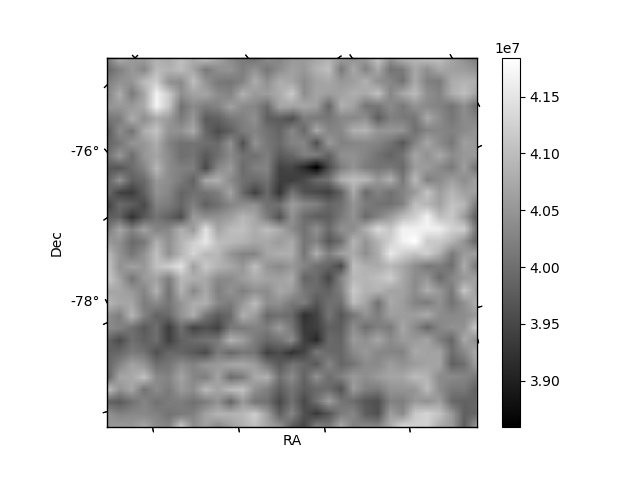
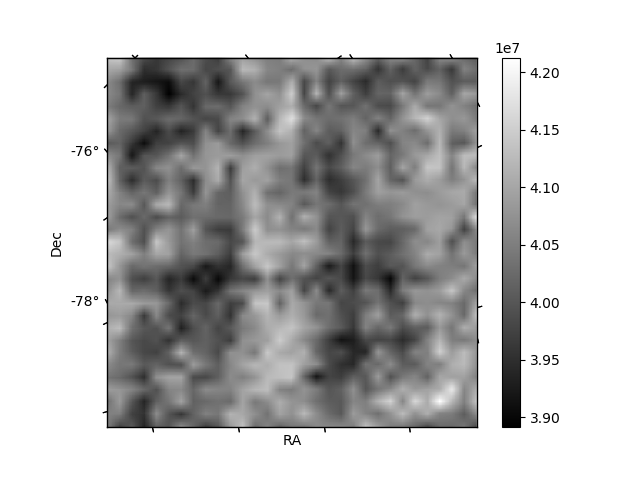
Histogram calculated using DETX and DETY for each event in the final _common_clean file
| Quadrant A | 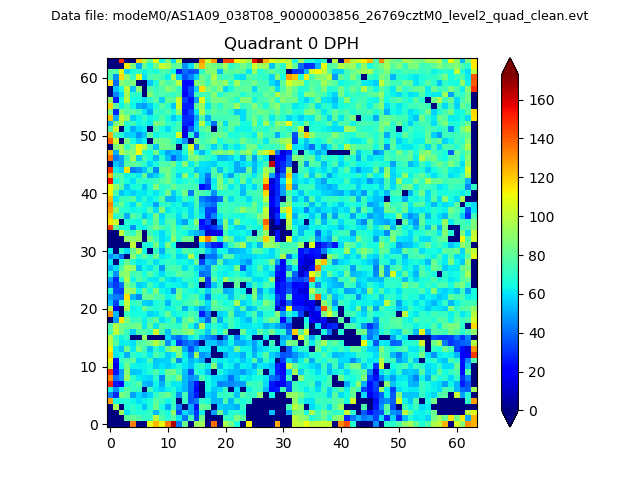 |
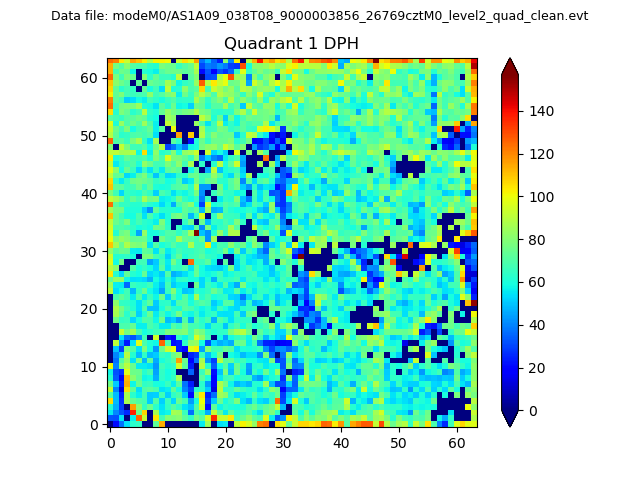 |
Quadrant B |
|---|---|---|---|
| Quadrant D | 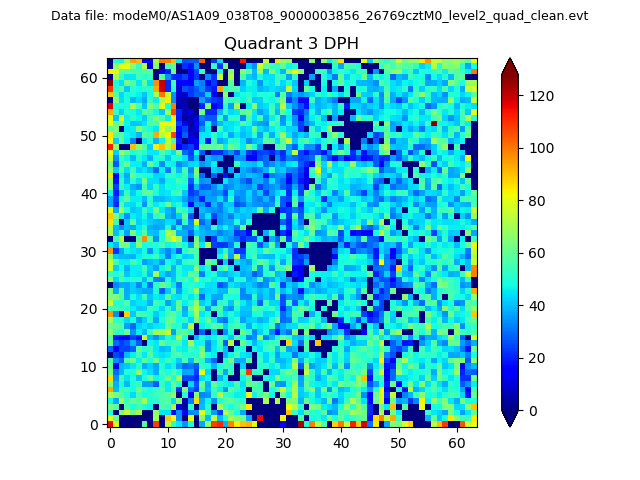 |
 |
Quadrant C |
| Plot type | Count rate plots | Images |
|---|---|---|
| Comparison with Poisson distribution Blue bars denote a histogram of data divided into 1 sec bins. Red curve is a Poisson curve with rate = median count rate of data. |
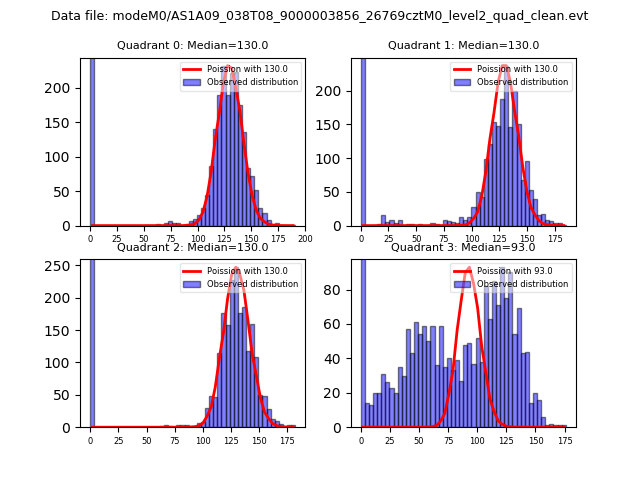 |
 |
| Quadrant-wise count rates Data is divided into 100 sec bins |
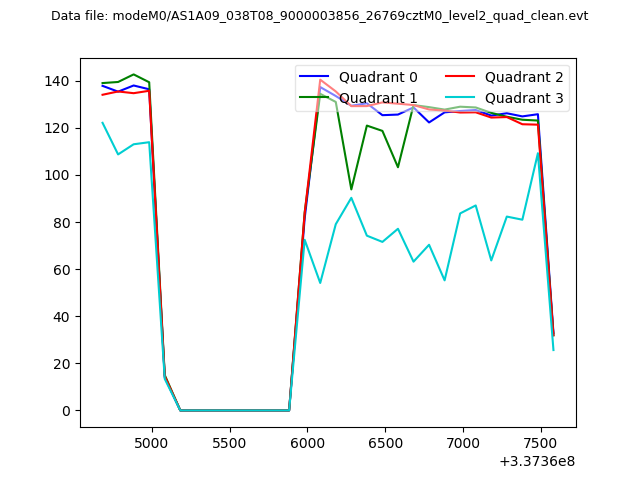 |
|
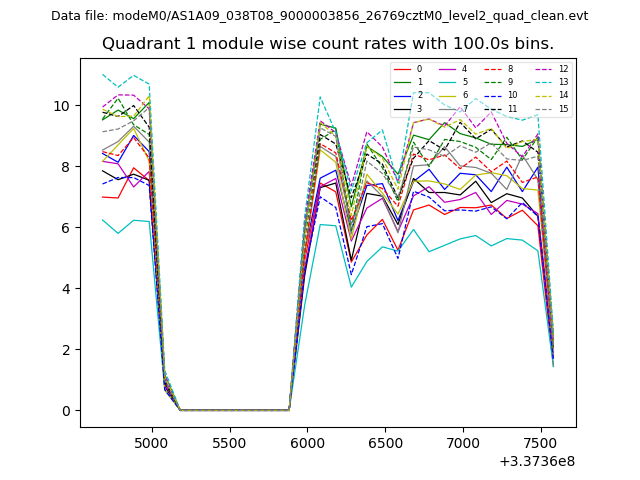
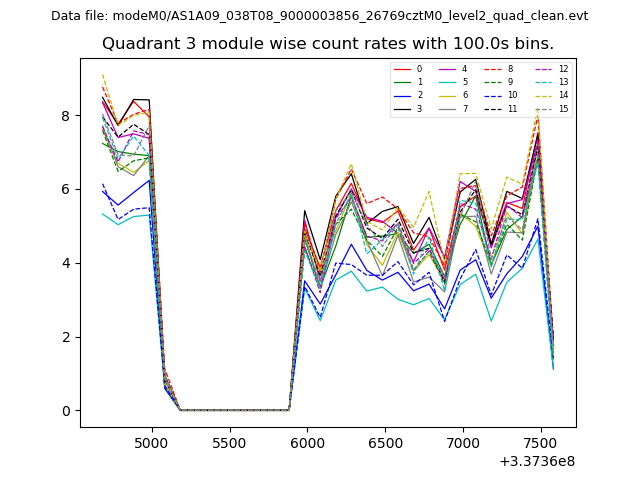
| Module-wise count rates for Quadrant A Data is divided into 100 sec bins |
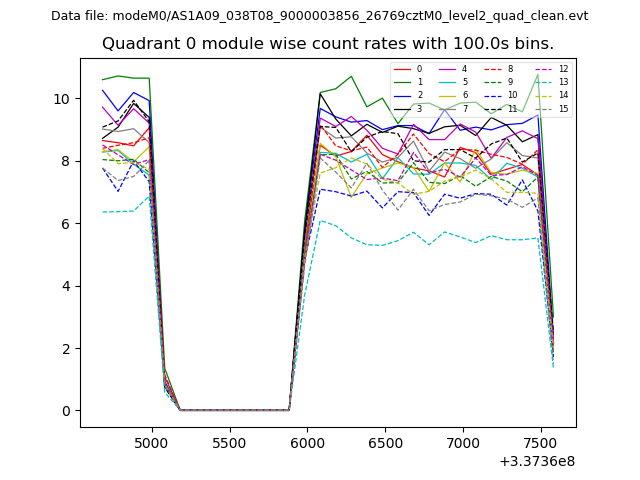 |
 |
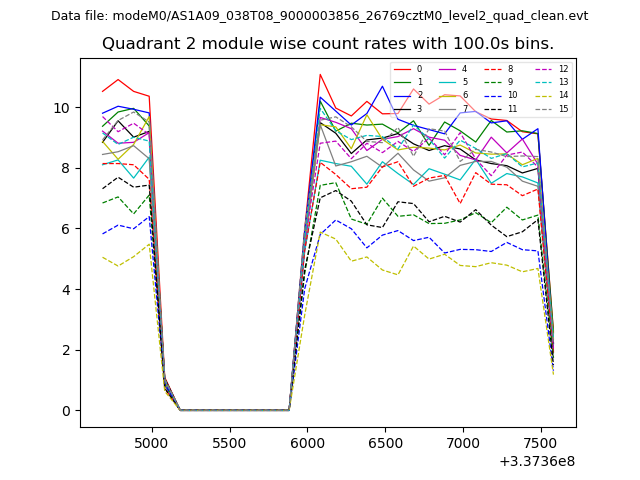
| Module-wise count rates for Quadrant B Data is divided into 100 sec bins |
 |
 |
| Module-wise count rates for Quadrant C Data is divided into 100 sec bins |
 |
 |
| Module-wise count rates for Quadrant D Data is divided into 100 sec bins |
 |
 |
| Parameter | Plot |
|---|---|
| CZT HV Monitor | 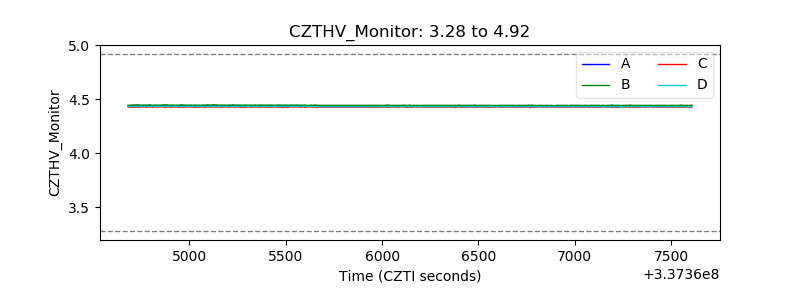 |
| D_VDD | 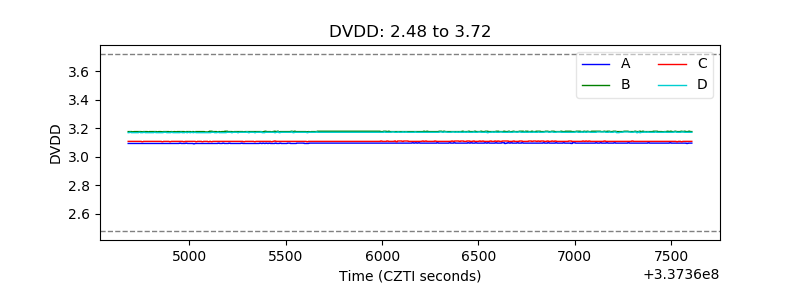 |
| Temperature 1 | 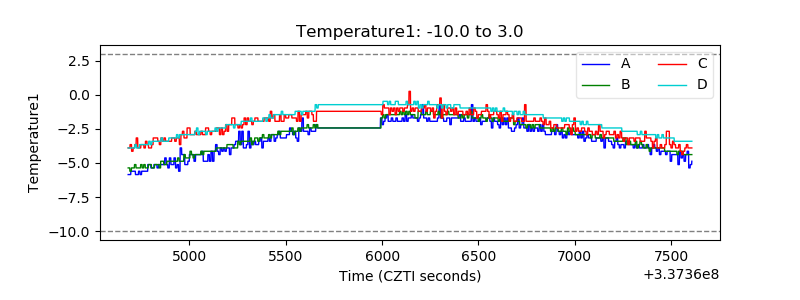 |
| Veto HV Monitor |  |
| Veto LLD | 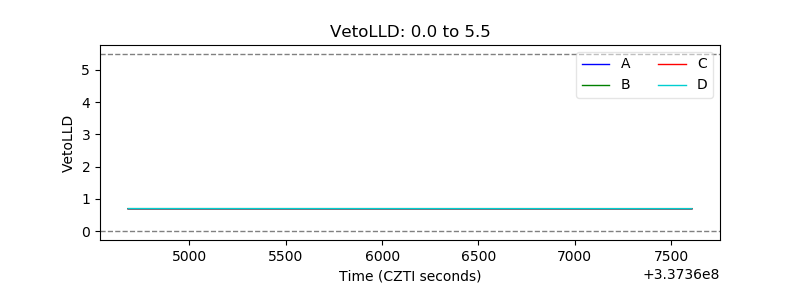 |
| Alpha Counter | 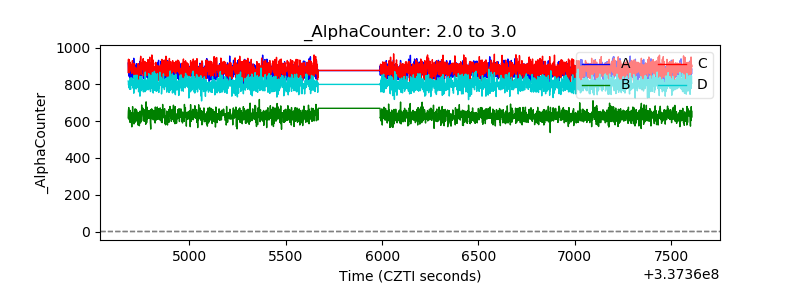 |
| _CPM_Rate | 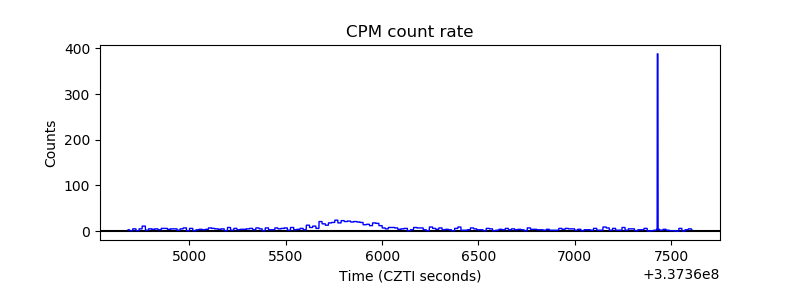 |
| CZT Counter | 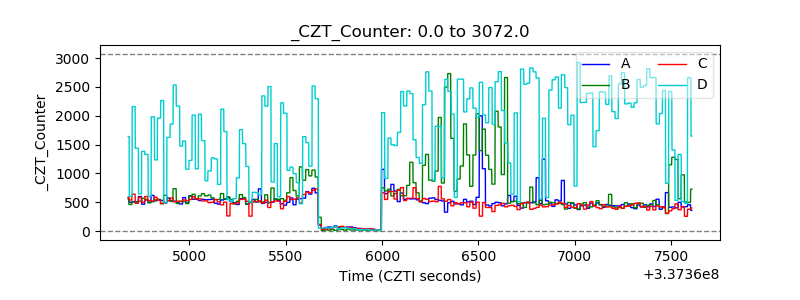 |
| +2.5 Volts monitor | 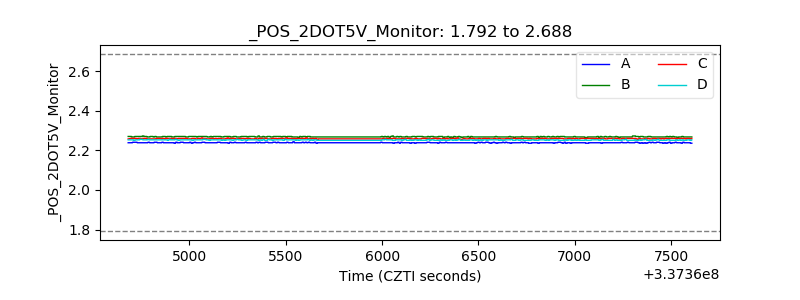 |
| +5 Volts monitor |  |
| _ROLL_ROT | 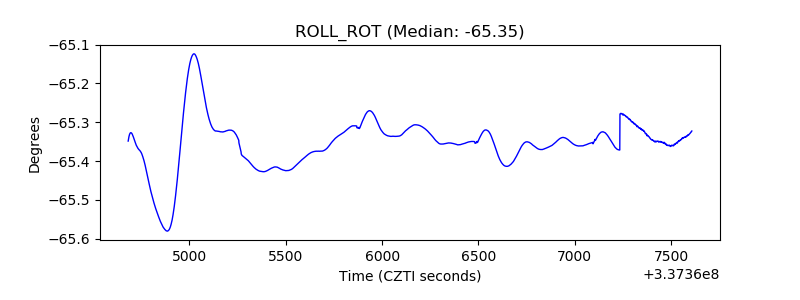 |
| _Roll_DEC | 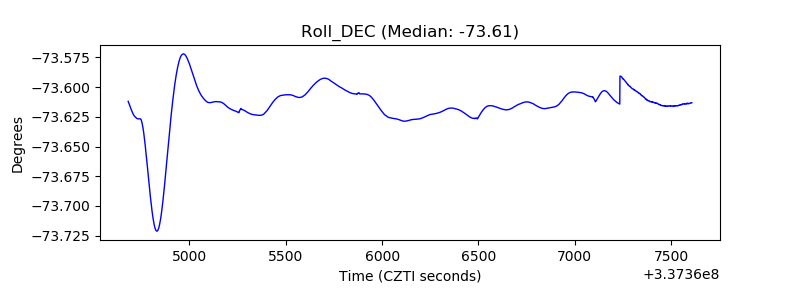 |
| _Roll_RA | 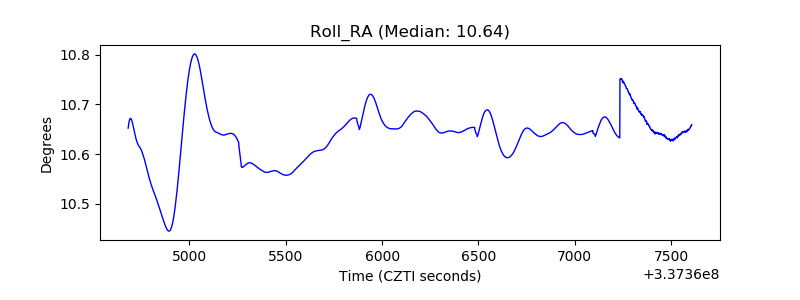 |
| Veto Counter | 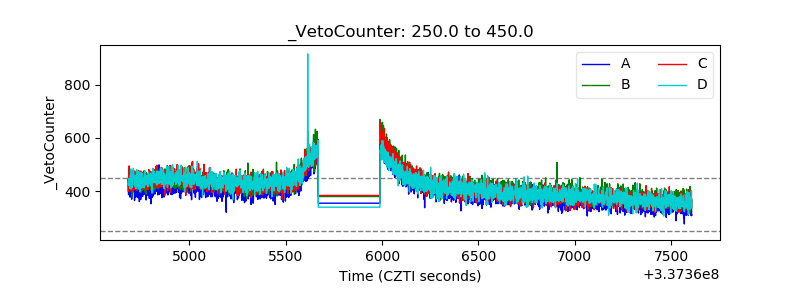 |