| Param | Original file | Final file |
|---|---|---|
| Filename | modeM0/AS1A09_038T08_9000003856_26770cztM0_level2.evt | modeM0/AS1A09_038T08_9000003856_26770cztM0_level2_quad_clean.evt |
| Size (bytes) | 539,890,560 | 76,576,320 |
| Size | 514.9 MB | 73.0 MB |
| Events in quadrant A | 2,317,639 | 546,584 |
| Events in quadrant B | 4,287,998 | 518,398 |
| Events in quadrant C | 1,983,334 | 535,295 |
| Events in quadrant D | 7,464,730 | 409,372 |
| Mode M0 | |||
|---|---|---|---|
| Quadrant | BADHDUFLAG | Total packets | Discarded packets |
| A | 0 | 9872 | 0 |
| B | 0 | 15773 | 0 |
| C | 0 | 8893 | 0 |
| D | 0 | 25254 | 0 |
| Quadrant | Total seconds | Saturated seconds | Saturation percentage |
|---|---|---|---|
| A | 4380 | 23 | 0.525114% |
| B | 4381 | 532 | 12.143346% |
| C | 4381 | 23 | 0.524994% |
| D | 4381 | 1879 | 42.889751% |
Noise dominated data is calculated using 1-second bins in cleaned event files. If a bin has >2000 counts, and if more than 50% of those come from <1% of pixels, then it is considered to be noise-dominated and hence unusable.
| Quadrant | # 1 sec bins | Bins with >0 counts | Bins with >2000 counts | High rate bins dominated by noise | Noise dominated (total time) | Noise dominated (detector-on time) | Marked lightcurve |
|---|---|---|---|---|---|---|---|
| A | 4380 | 4380 | 14 | 14 | 0.32% | 0.32% | 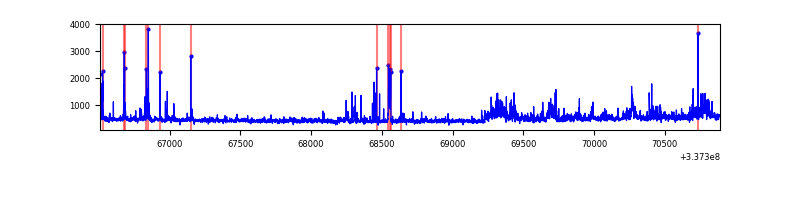 |
| B | 4381 | 4381 | 383 | 383 | 8.74% | 8.74% | 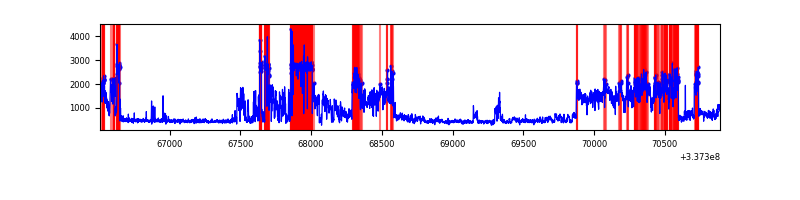 |
| C | 4381 | 4381 | 1 | 1 | 0.02% | 0.02% | 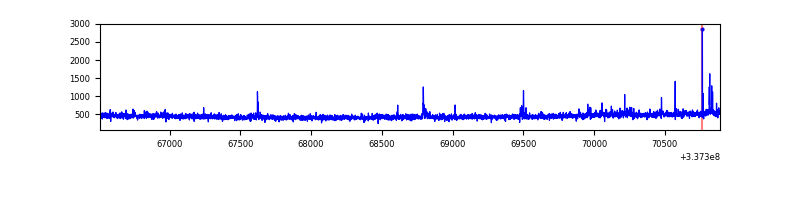 |
| D | 4381 | 4381 | 1542 | 1542 | 35.20% | 35.20% | 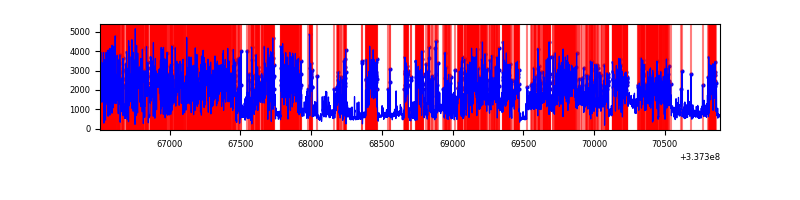 |
Top three noisy pixels from each quadrant. If the there are fewer than three noisy pixels in the level2.evt file, extra rows are filled as -1
| Pixel properties | Quadrant properties | ||||||
|---|---|---|---|---|---|---|---|
| Quadrant | DetID | PixID | Counts | Sigma | Mean | Median | Sigma |
| A | 0 | 13 | 393665 | 3968.85 | 492 | 484 | 99.1 |
| A | 12 | 96 | 15899 | 155.6 | 492 | 484 | 99.1 |
| A | 13 | 254 | 6968 | 65.45 | 492 | 484 | 99.1 |
| B | 0 | 189 | 2417126 | 26729.68 | 472 | 460 | 90.4 |
| B | 12 | 111 | 10838 | 114.79 | 472 | 460 | 90.4 |
| B | 11 | 111 | 9712 | 102.33 | 472 | 460 | 90.4 |
| C | 14 | 238 | 77102 | 686.97 | 477 | 480 | 111.5 |
| C | 2 | 16 | 20316 | 177.84 | 477 | 480 | 111.5 |
| C | 15 | 208 | 15384 | 133.62 | 477 | 480 | 111.5 |
| D | 7 | 80 | 5581080 | 58694.72 | 390 | 379 | 95.1 |
| D | 1 | 52 | 266675 | 2800.75 | 390 | 379 | 95.1 |
| D | 2 | 250 | 74595 | 780.56 | 390 | 379 | 95.1 |
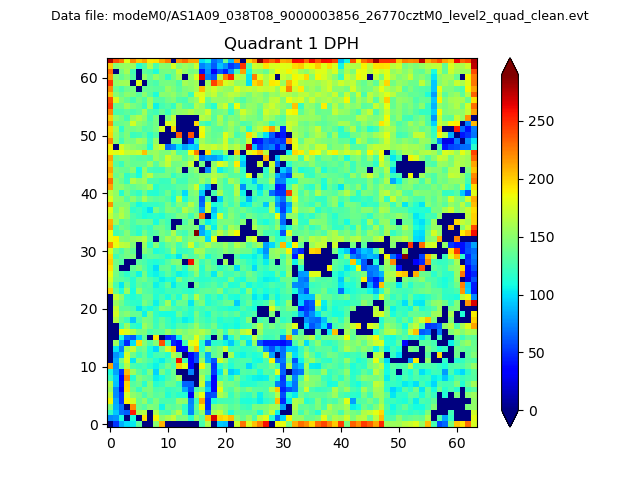
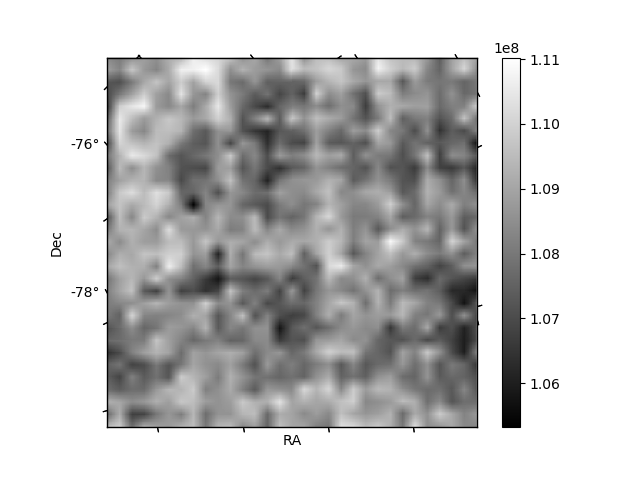
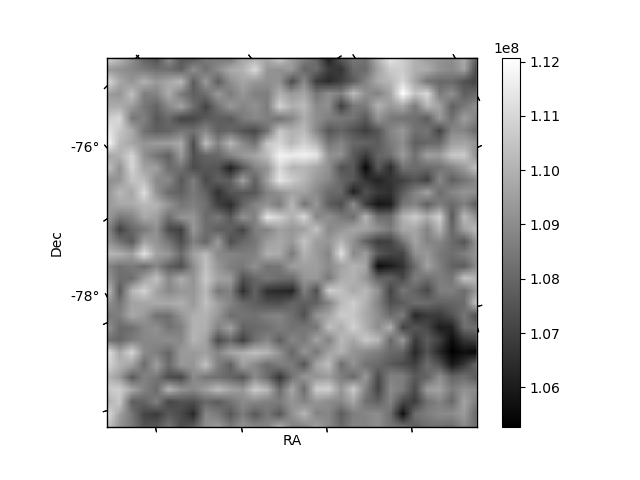
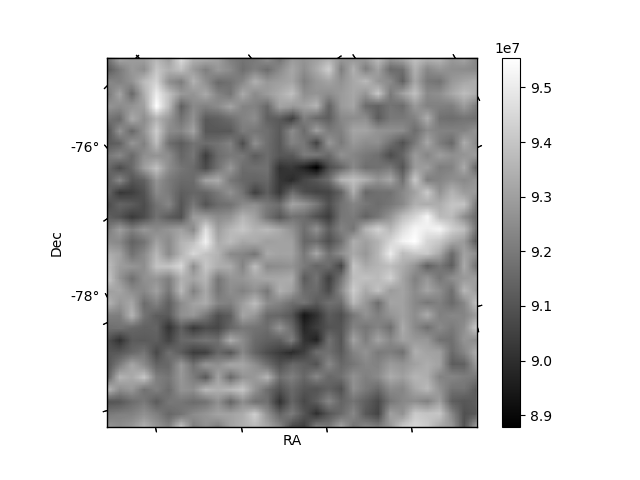
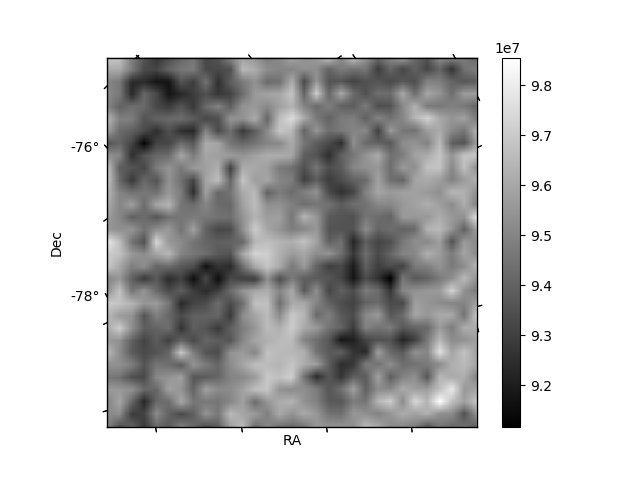
Histogram calculated using DETX and DETY for each event in the final _common_clean file
| Quadrant A |  |
 |
Quadrant B |
|---|---|---|---|
| Quadrant D | 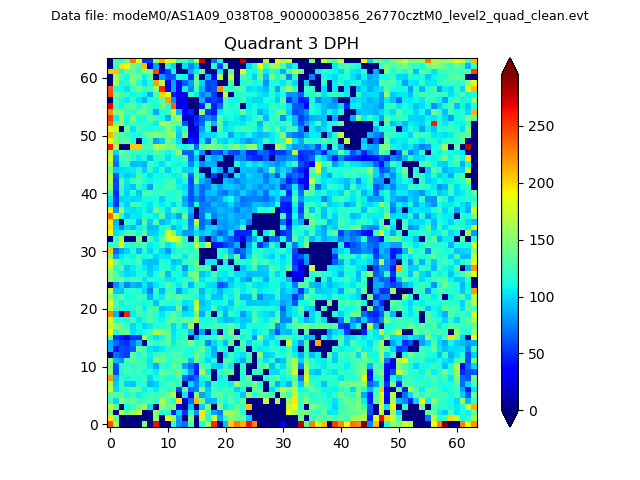 |
 |
Quadrant C |
| Plot type | Count rate plots | Images |
|---|---|---|
| Comparison with Poisson distribution Blue bars denote a histogram of data divided into 1 sec bins. Red curve is a Poisson curve with rate = median count rate of data. |
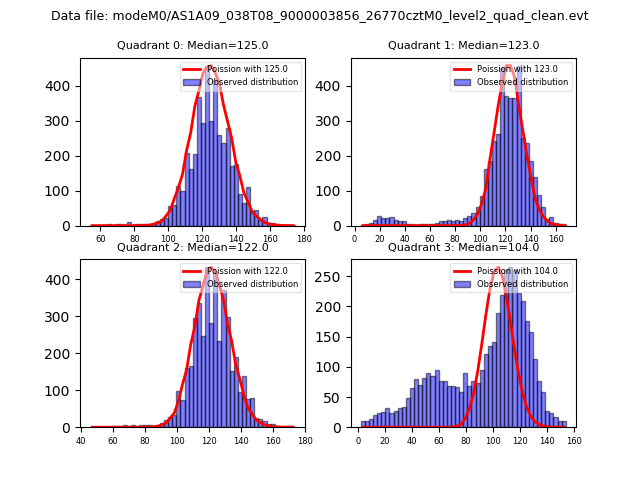 |
 |
| Quadrant-wise count rates Data is divided into 100 sec bins |
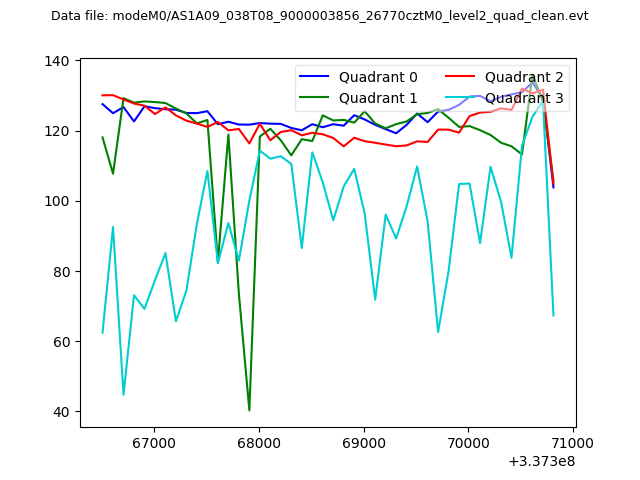 |
|
| Module-wise count rates for Quadrant A Data is divided into 100 sec bins |
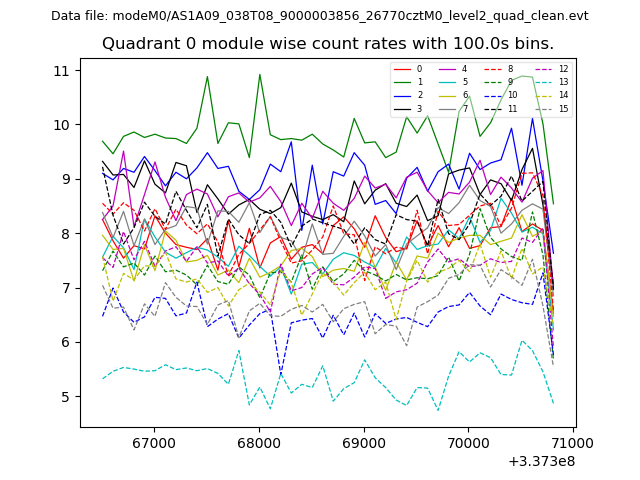 |
 |
| Module-wise count rates for Quadrant B Data is divided into 100 sec bins |
 |
 |
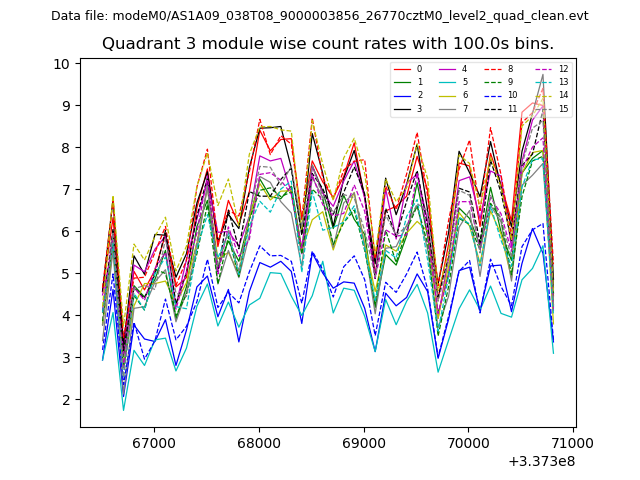
| Module-wise count rates for Quadrant C Data is divided into 100 sec bins |
 |
 |
| Module-wise count rates for Quadrant D Data is divided into 100 sec bins |
 |
 |
| Parameter | Plot |
|---|---|
| CZT HV Monitor | 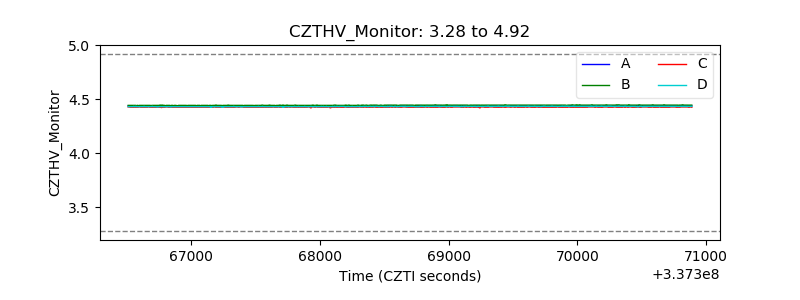 |
| D_VDD | 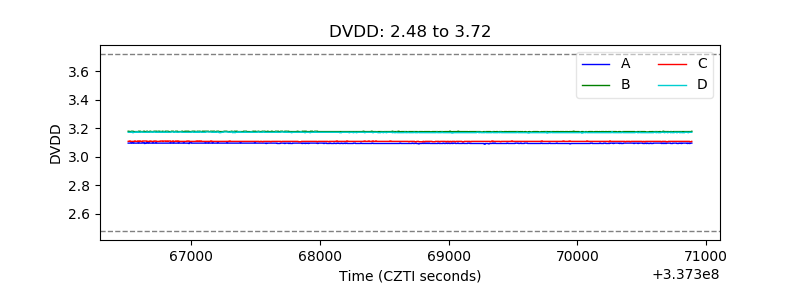 |
| Temperature 1 | 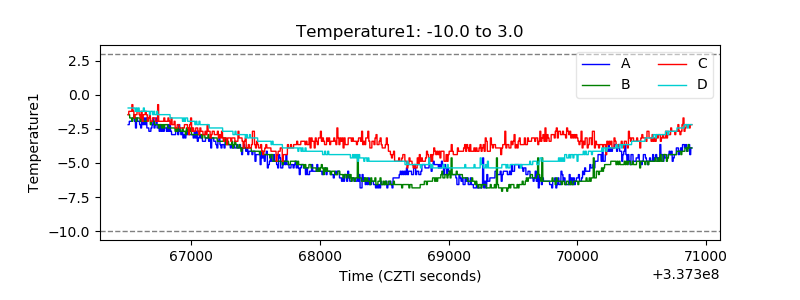 |
| Veto HV Monitor | 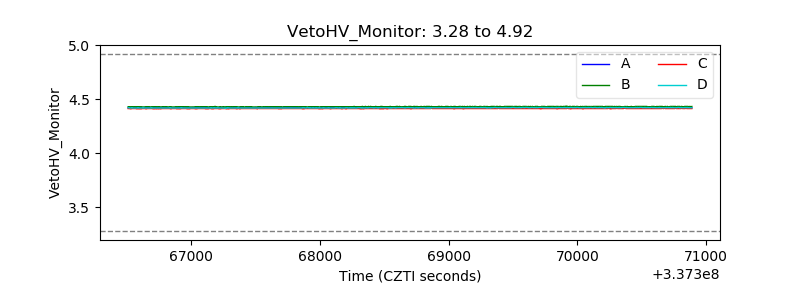 |
| Veto LLD | 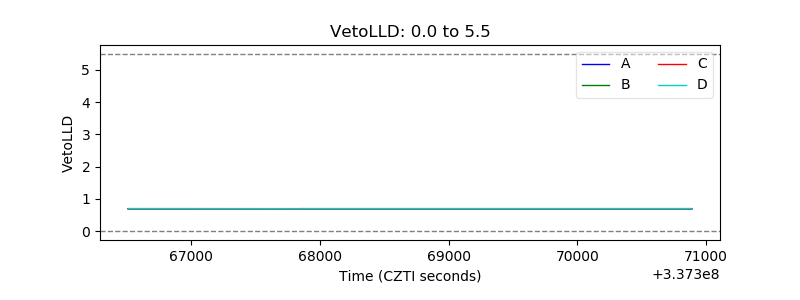 |
| Alpha Counter |  |
| _CPM_Rate | 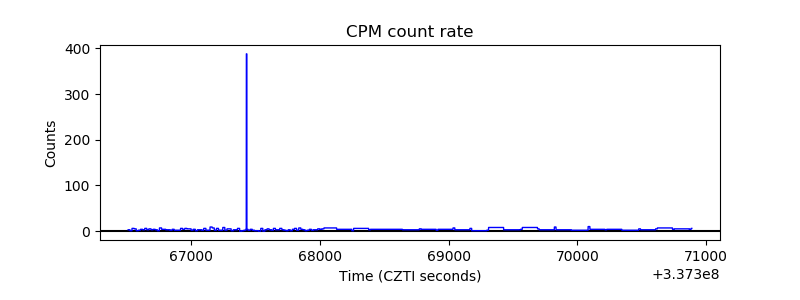 |
| CZT Counter | 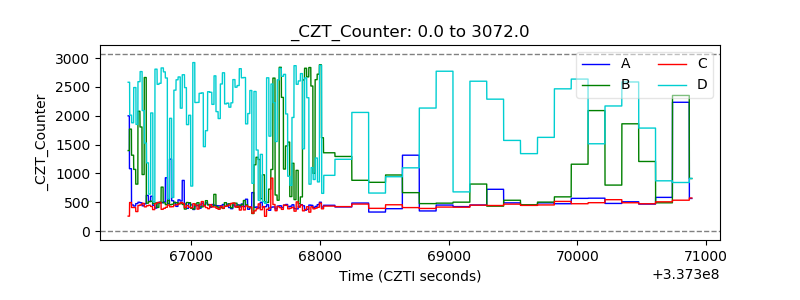 |
| +2.5 Volts monitor |  |
| +5 Volts monitor | 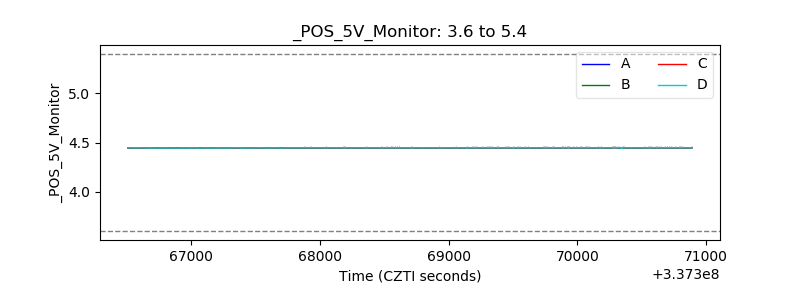 |
| _ROLL_ROT | 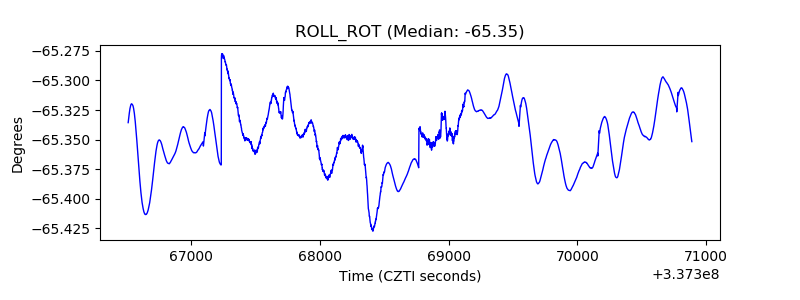 |
| _Roll_DEC | 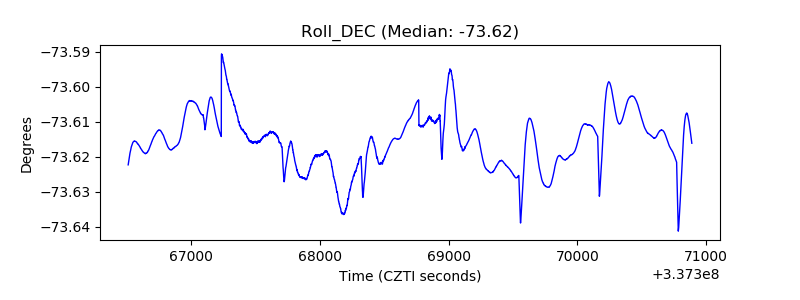 |
| _Roll_RA | 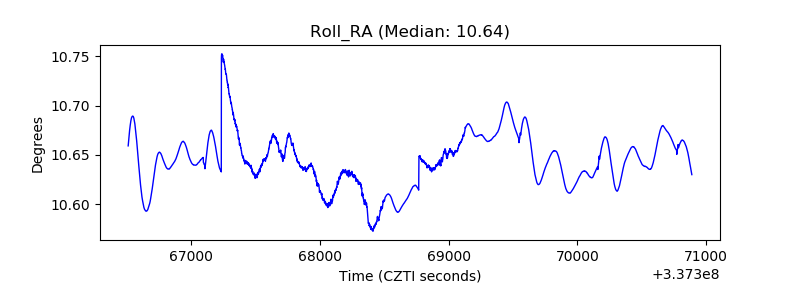 |
| Veto Counter | 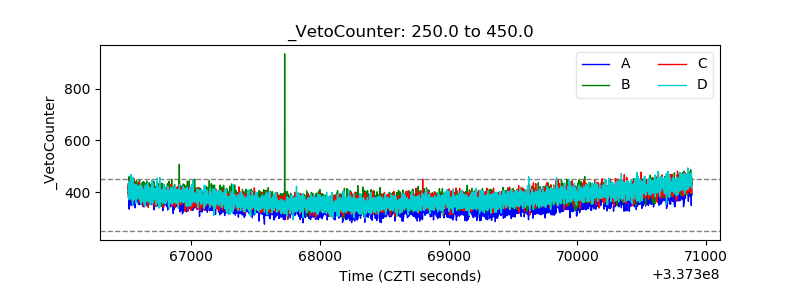 |