| Param | Original file | Final file |
|---|---|---|
| Filename | modeM0/AS1A09_038T09_9000003860cztM0_level2.fits | modeM0/AS1A09_038T09_9000003860cztM0_level2_quad_clean.evt |
| Size (bytes) | 117,092,160 | 115,689,600 |
| Size | 111.7 MB | 110.3 MB |
| Events in quadrant A | 765,688 | 811,881 |
| Events in quadrant B | 470,232 | 356,763 |
| Events in quadrant C | 769,540 | 793,855 |
| Events in quadrant D | 599,464 | 603,996 |
| Mode M0 | |||
|---|---|---|---|
| Quadrant | BADHDUFLAG | Total packets | Discarded packets |
| A | 0 | 40473 | 0 |
| B | 0 | 87693 | 0 |
| C | 0 | 27889 | 0 |
| D | 0 | 56166 | 0 |
| Mode SS | |||
|---|---|---|---|
| Quadrant | BADHDUFLAG | Total packets | Discarded packets |
| A | 0 | 278 | 0 |
| B | 0 | 278 | 0 |
| C | 0 | 278 | 0 |
| D | 0 | 278 | 0 |
| Mode M9 | |||
|---|---|---|---|
| Quadrant | BADHDUFLAG | Total packets | Discarded packets |
| A | 0 | 24 | 0 |
| B | 0 | 24 | 0 |
| C | 0 | 24 | 0 |
| D | 0 | 24 | 0 |
| Quadrant | Total seconds | Saturated seconds | Saturation percentage |
|---|---|---|---|
| A | 13544 | 407 | 3.005021% |
| B | 13544 | 8760 | 64.678086% |
| C | 13544 | 145 | 1.070585% |
| D | 13544 | 2640 | 19.492026% |
Noise dominated data is calculated using 1-second bins in cleaned event files. If a bin has >2000 counts, and if more than 50% of those come from <1% of pixels, then it is considered to be noise-dominated and hence unusable.
| Quadrant | # 1 sec bins | Bins with >0 counts | Bins with >2000 counts | High rate bins dominated by noise | Noise dominated (total time) | Noise dominated (detector-on time) | Marked lightcurve |
|---|---|---|---|---|---|---|---|
| A | 15964 | 13545 | 0 | 0 | 0.00% | 0.00% | 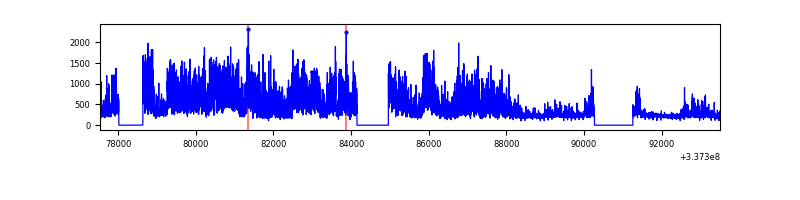 |
| B | 15964 | 13309 | 0 | 0 | 0.00% | 0.00% |  |
| C | 15964 | 13544 | 0 | 0 | 0.00% | 0.00% |  |
| D | 15964 | 13516 | 0 | 0 | 0.00% | 0.00% |  |
Top three noisy pixels from each quadrant. If the there are fewer than three noisy pixels in the level2.evt file, extra rows are filled as -1
| Pixel properties | Quadrant properties | ||||||
|---|---|---|---|---|---|---|---|
| Quadrant | DetID | PixID | Counts | Sigma | Mean | Median | Sigma |
| A | 7 | 110 | 683 | 9.67 | 199 | 187 | 51.3 |
| A | 0 | 29 | 673 | 9.47 | 199 | 187 | 51.3 |
| A | 0 | 30 | 606 | 8.17 | 199 | 187 | 51.3 |
| B | 2 | 9 | 362 | 9.07 | 124 | 118 | 26.9 |
| B | 3 | 80 | 359 | 8.96 | 124 | 118 | 26.9 |
| B | 14 | 254 | 312 | 7.21 | 124 | 118 | 26.9 |
| C | 1 | 81 | 640 | 8.47 | 202 | 189 | 53.3 |
| C | 1 | 80 | 627 | 8.22 | 202 | 189 | 53.3 |
| C | 12 | 241 | 557 | 6.91 | 202 | 189 | 53.3 |
| D | 6 | 231 | 439 | 6.07 | 171 | 156 | 46.6 |
| D | 15 | 46 | 430 | 5.88 | 171 | 156 | 46.6 |
| D | 10 | 189 | 430 | 5.88 | 171 | 156 | 46.6 |
Histogram calculated using DETX and DETY for each event in the final _common_clean file
| Quadrant A |  |
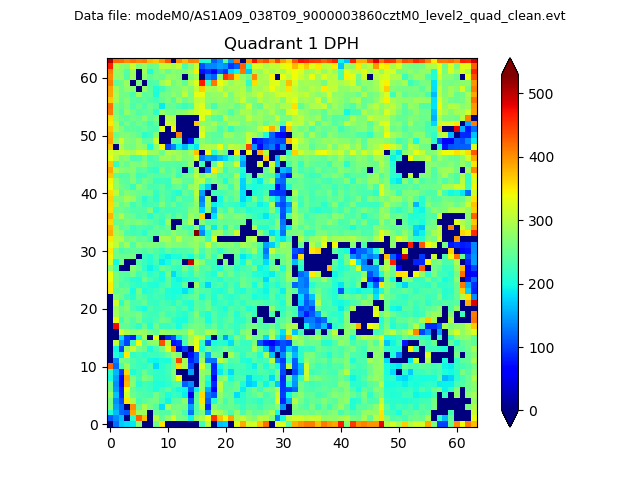 |
Quadrant B |
|---|---|---|---|
| Quadrant D |  |
 |
Quadrant C |
| Plot type | Count rate plots | Images |
|---|---|---|
| Comparison with Poisson distribution Blue bars denote a histogram of data divided into 1 sec bins. Red curve is a Poisson curve with rate = median count rate of data. |
 |
 |
| Quadrant-wise count rates Data is divided into 100 sec bins |
 |
|
| Module-wise count rates for Quadrant A Data is divided into 100 sec bins |
 |
 |
| Module-wise count rates for Quadrant B Data is divided into 100 sec bins |
 |
 |
| Module-wise count rates for Quadrant C Data is divided into 100 sec bins |
 |
 |
| Module-wise count rates for Quadrant D Data is divided into 100 sec bins |
 |
 |
| Parameter | Plot |
|---|---|
| CZT HV Monitor |  |
| D_VDD | 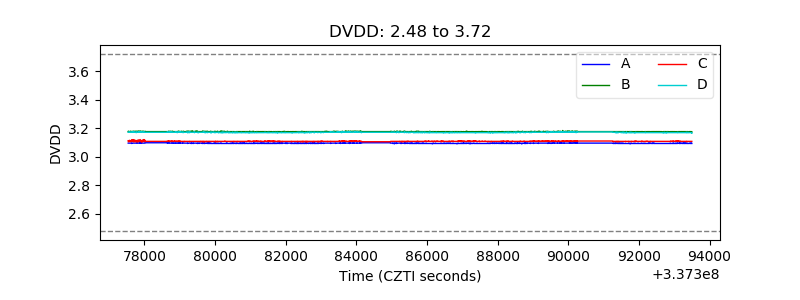 |
| Temperature 1 |  |
| Veto HV Monitor | 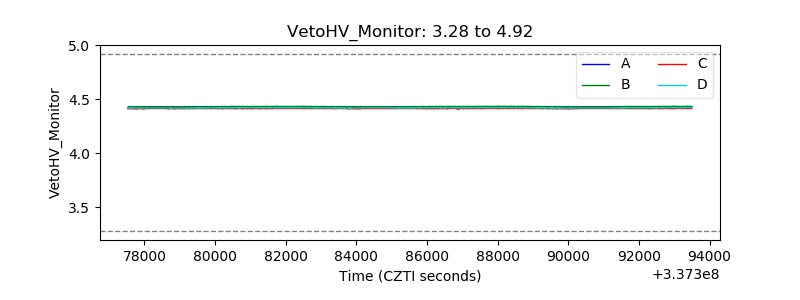 |
| Veto LLD |  |
| Alpha Counter |  |
| _CPM_Rate |  |
| CZT Counter |  |
| +2.5 Volts monitor |  |
| +5 Volts monitor |  |
| _ROLL_ROT |  |
| _Roll_DEC |  |
| _Roll_RA |  |
| Veto Counter |  |