| Param | Original file | Final file |
|---|---|---|
| Filename | modeM0/AS1A09_038T09_9000003860_26772cztM0_level2.evt | modeM0/AS1A09_038T09_9000003860_26772cztM0_level2_quad_clean.evt |
| Size (bytes) | 1,145,102,400 | 108,437,760 |
| Size | 1.1 GB | 103.4 MB |
| Events in quadrant A | 7,021,508 | 778,266 |
| Events in quadrant B | 14,889,965 | 497,090 |
| Events in quadrant C | 3,602,517 | 787,678 |
| Events in quadrant D | 8,659,479 | 694,207 |
| Mode M0 | |||
|---|---|---|---|
| Quadrant | BADHDUFLAG | Total packets | Discarded packets |
| A | 0 | 26187 | 0 |
| B | 0 | 49334 | 0 |
| C | 0 | 15487 | 0 |
| D | 0 | 31063 | 0 |
| Mode M9 | |||
|---|---|---|---|
| Quadrant | BADHDUFLAG | Total packets | Discarded packets |
| A | 0 | 14 | 0 |
| B | 0 | 14 | 0 |
| C | 0 | 14 | 0 |
| D | 0 | 14 | 0 |
| Quadrant | Total seconds | Saturated seconds | Saturation percentage |
|---|---|---|---|
| A | 7528 | 394 | 5.233794% |
| B | 7528 | 5219 | 69.327843% |
| C | 7528 | 88 | 1.168969% |
| D | 7527 | 1455 | 19.330411% |
Noise dominated data is calculated using 1-second bins in cleaned event files. If a bin has >2000 counts, and if more than 50% of those come from <1% of pixels, then it is considered to be noise-dominated and hence unusable.
| Quadrant | # 1 sec bins | Bins with >0 counts | Bins with >2000 counts | High rate bins dominated by noise | Noise dominated (total time) | Noise dominated (detector-on time) | Marked lightcurve |
|---|---|---|---|---|---|---|---|
| A | 8958 | 7530 | 160 | 160 | 1.79% | 2.12% | 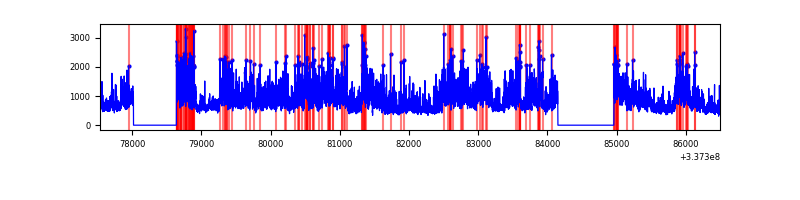 |
| B | 8958 | 7530 | 4496 | 4496 | 50.19% | 59.71% | 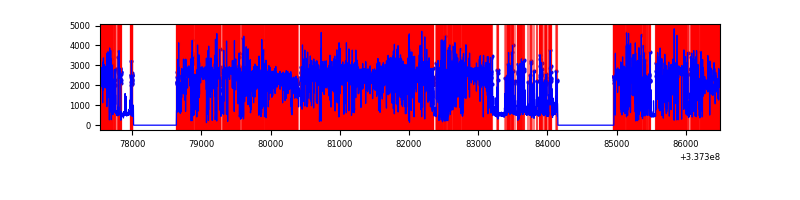 |
| C | 8958 | 7530 | 1 | 1 | 0.01% | 0.01% | 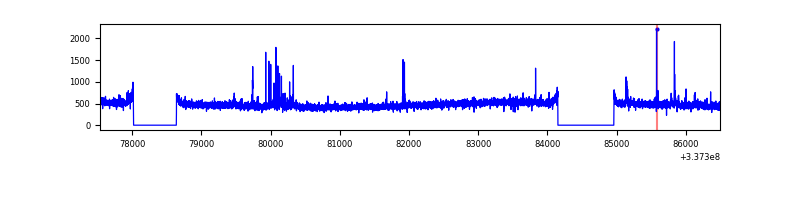 |
| D | 8957 | 7528 | 1121 | 1121 | 12.52% | 14.89% |  |
Top three noisy pixels from each quadrant. If the there are fewer than three noisy pixels in the level2.evt file, extra rows are filled as -1
| Pixel properties | Quadrant properties | ||||||
|---|---|---|---|---|---|---|---|
| Quadrant | DetID | PixID | Counts | Sigma | Mean | Median | Sigma |
| A | 0 | 13 | 3568710 | 19837.98 | 889 | 870 | 179.8 |
| A | 13 | 254 | 13388 | 69.6 | 889 | 870 | 179.8 |
| A | 6 | 16 | 10976 | 56.19 | 889 | 870 | 179.8 |
| B | 0 | 189 | 12502236 | 109208.8 | 601 | 584 | 114.5 |
| B | 3 | 112 | 24543 | 209.3 | 601 | 584 | 114.5 |
| B | 12 | 111 | 13709 | 114.65 | 601 | 584 | 114.5 |
| C | 14 | 238 | 137436 | 670.95 | 865 | 869 | 203.5 |
| C | 15 | 208 | 61591 | 298.32 | 865 | 869 | 203.5 |
| C | 2 | 16 | 29811 | 142.19 | 865 | 869 | 203.5 |
| D | 7 | 80 | 5202993 | 27089.37 | 800 | 781 | 192.0 |
| D | 2 | 250 | 208722 | 1082.81 | 800 | 781 | 192.0 |
| D | 1 | 52 | 93029 | 480.36 | 800 | 781 | 192.0 |
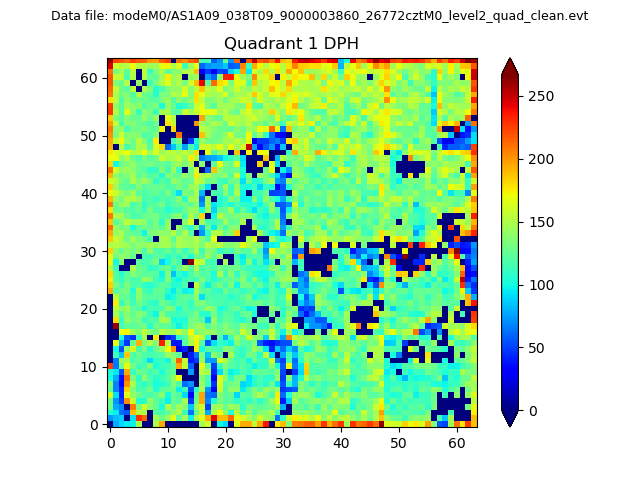
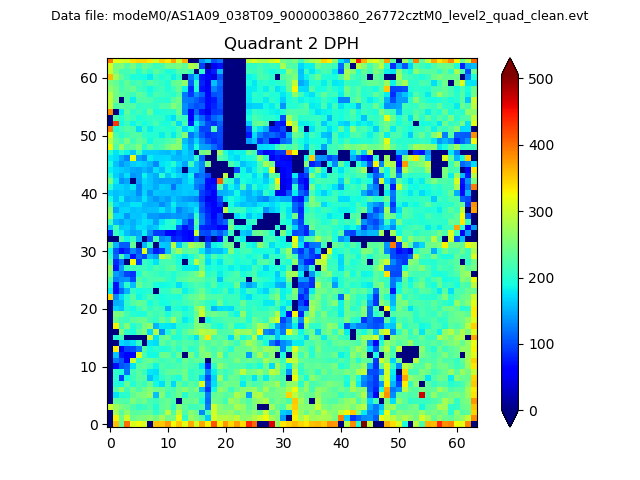
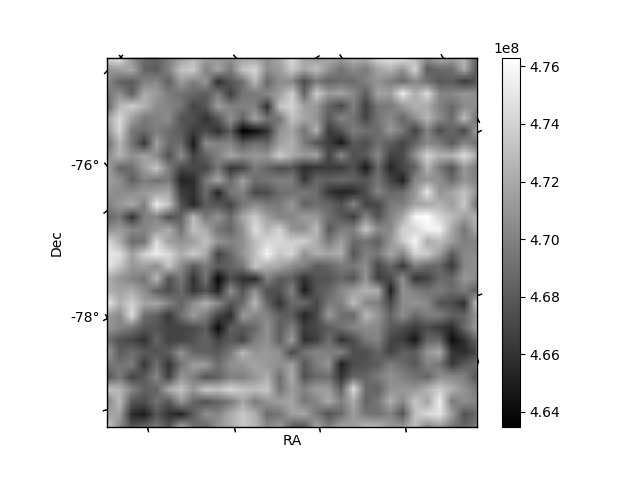
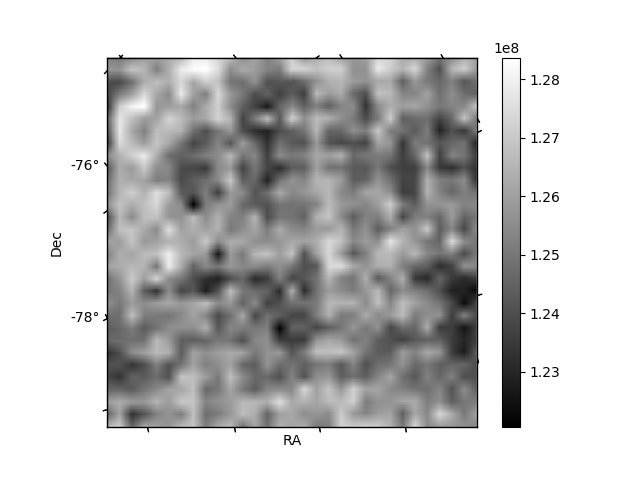
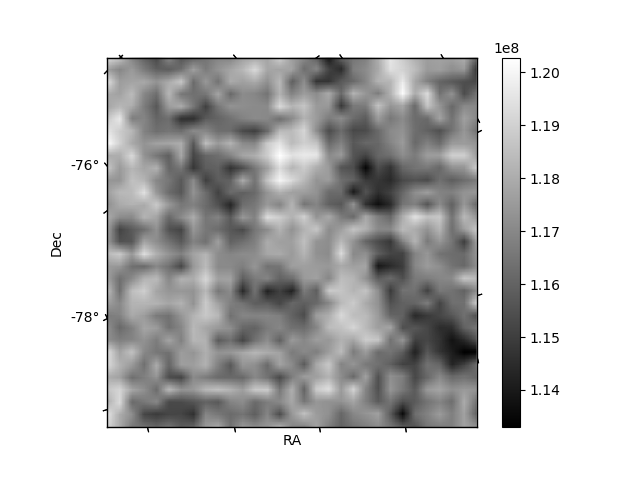
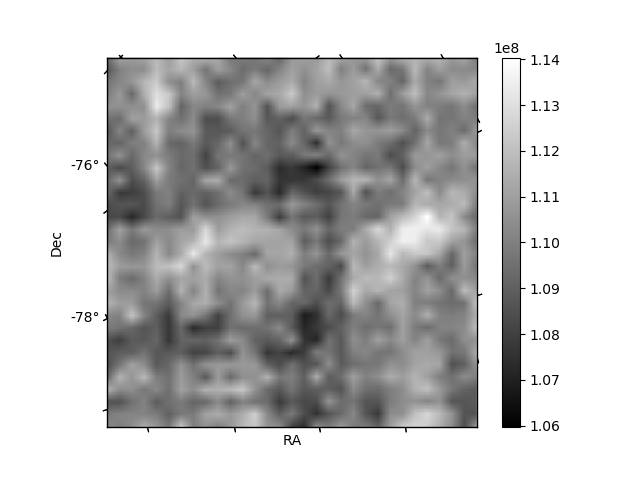
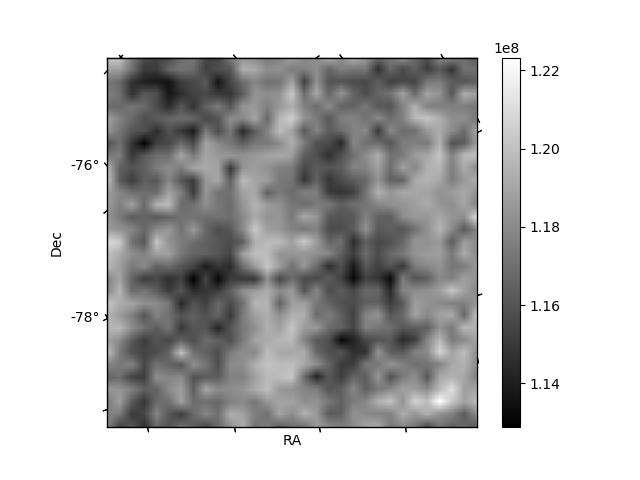
Histogram calculated using DETX and DETY for each event in the final _common_clean file
| Quadrant A | 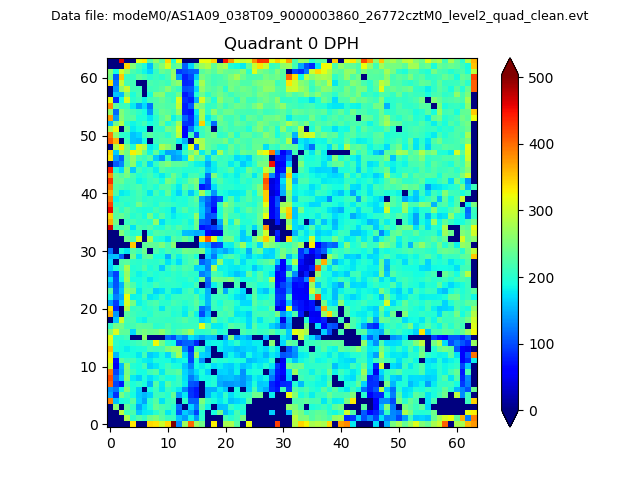 |
 |
Quadrant B |
|---|---|---|---|
| Quadrant D | 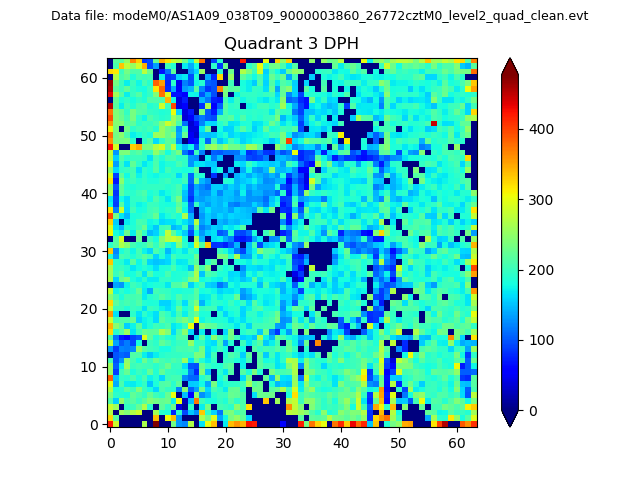 |
 |
Quadrant C |
| Plot type | Count rate plots | Images |
|---|---|---|
| Comparison with Poisson distribution Blue bars denote a histogram of data divided into 1 sec bins. Red curve is a Poisson curve with rate = median count rate of data. |
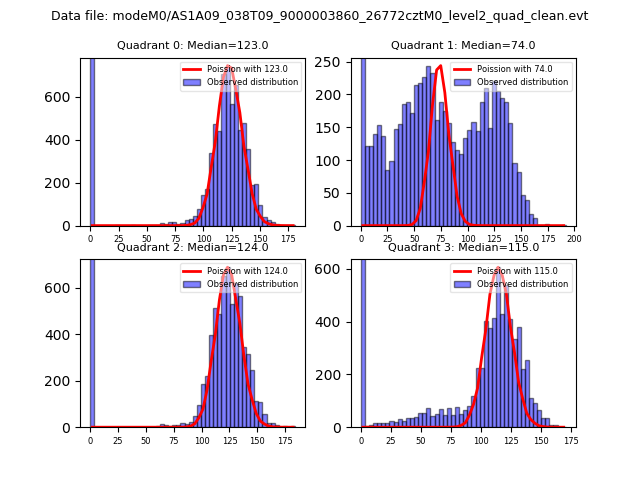 |
 |
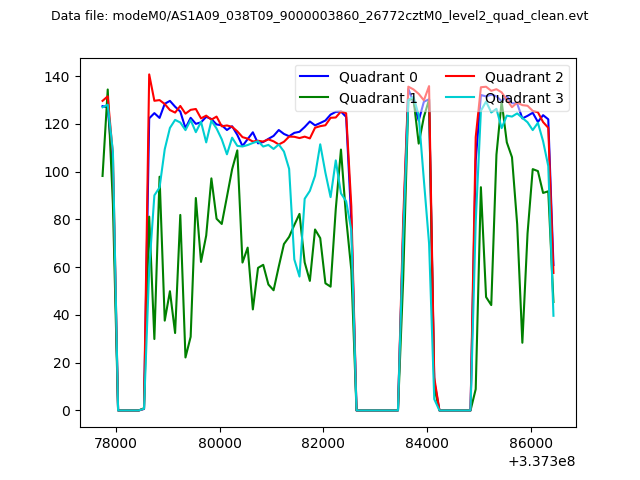
| Quadrant-wise count rates Data is divided into 100 sec bins |
 |
|
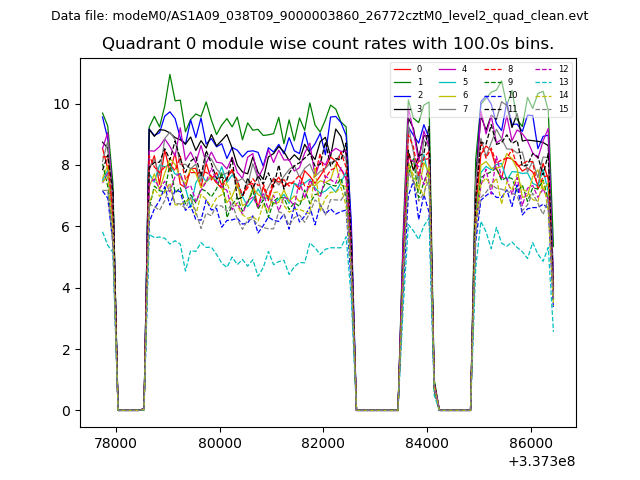
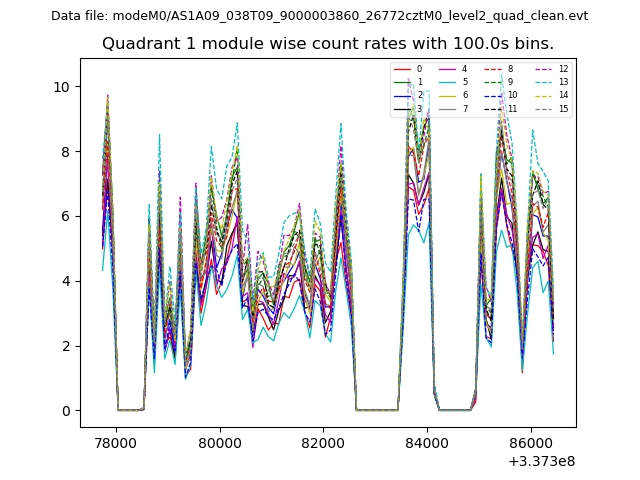
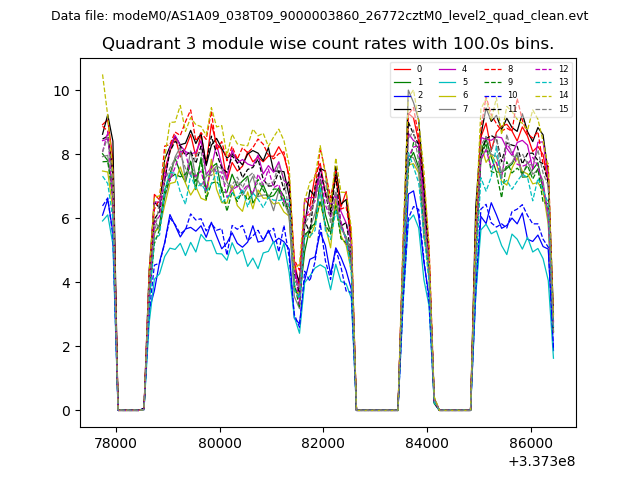
| Module-wise count rates for Quadrant A Data is divided into 100 sec bins |
 |
 |
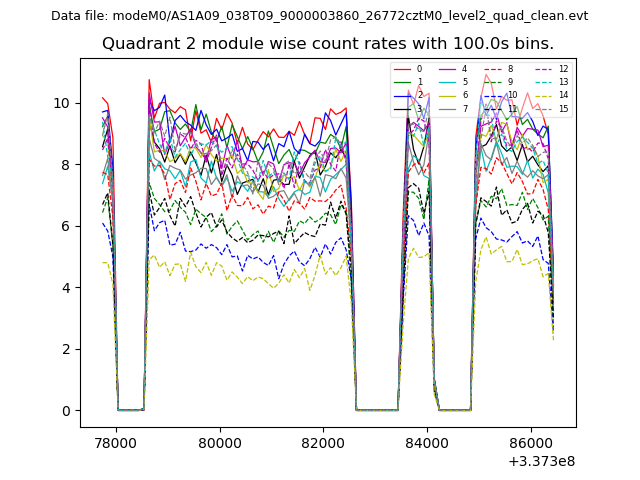
| Module-wise count rates for Quadrant B Data is divided into 100 sec bins |
 |
 |
| Module-wise count rates for Quadrant C Data is divided into 100 sec bins |
 |
 |
| Module-wise count rates for Quadrant D Data is divided into 100 sec bins |
 |
 |
| Parameter | Plot |
|---|---|
| CZT HV Monitor | 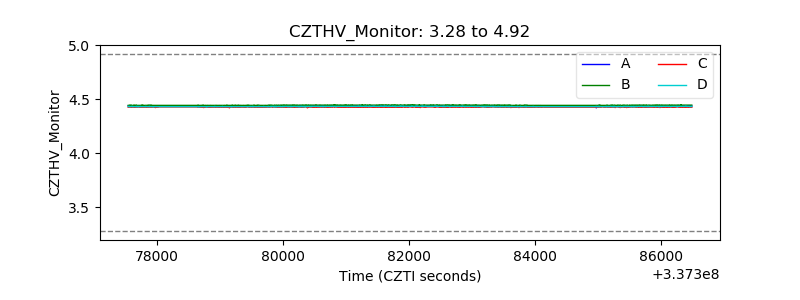 |
| D_VDD | 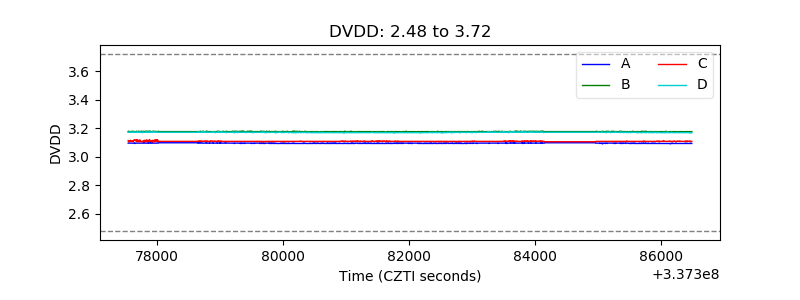 |
| Temperature 1 | 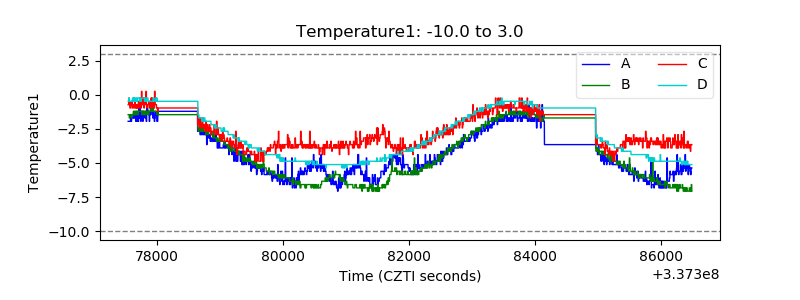 |
| Veto HV Monitor |  |
| Veto LLD | 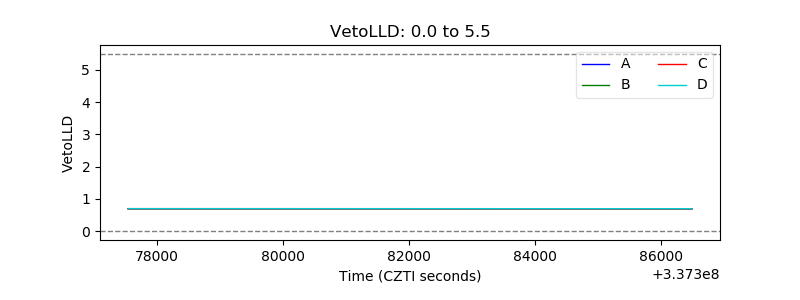 |
| Alpha Counter | 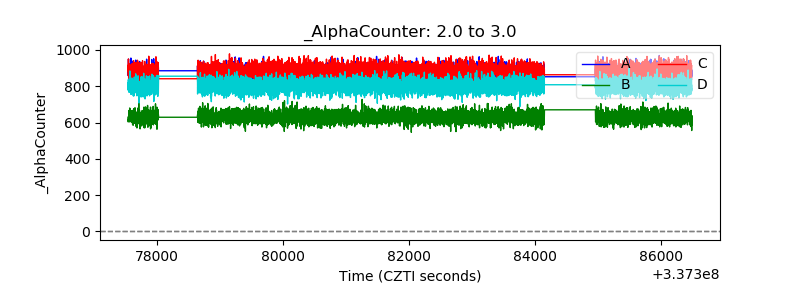 |
| _CPM_Rate | 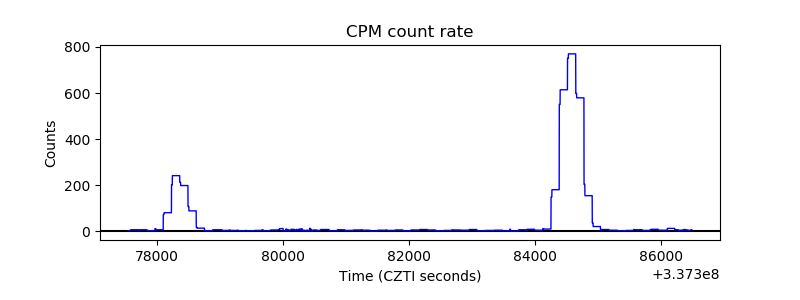 |
| CZT Counter | 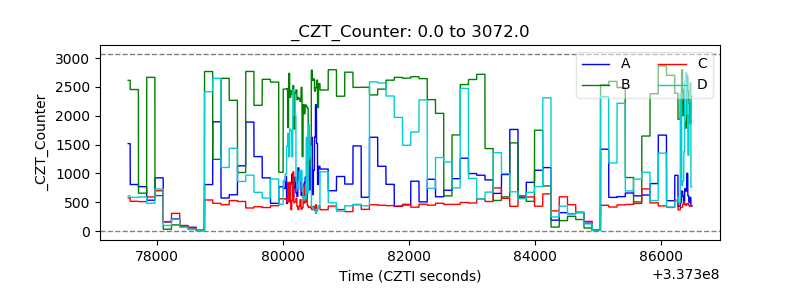 |
| +2.5 Volts monitor |  |
| +5 Volts monitor |  |
| _ROLL_ROT | 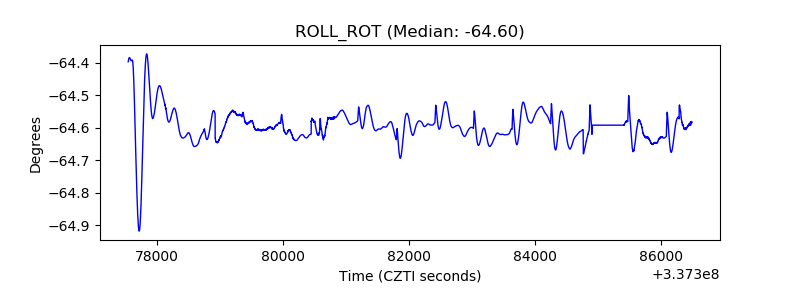 |
| _Roll_DEC | 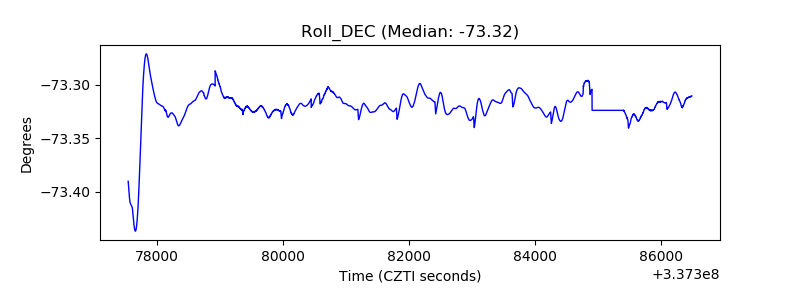 |
| _Roll_RA | 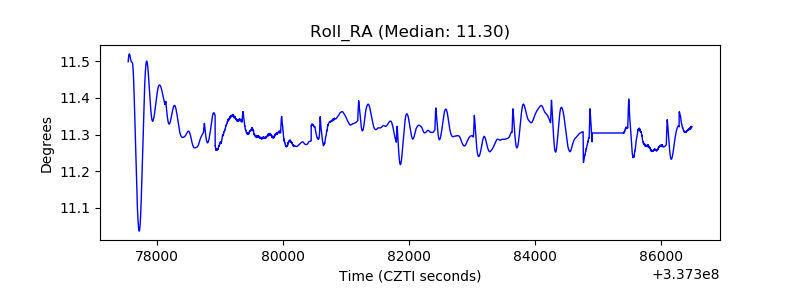 |
| Veto Counter | 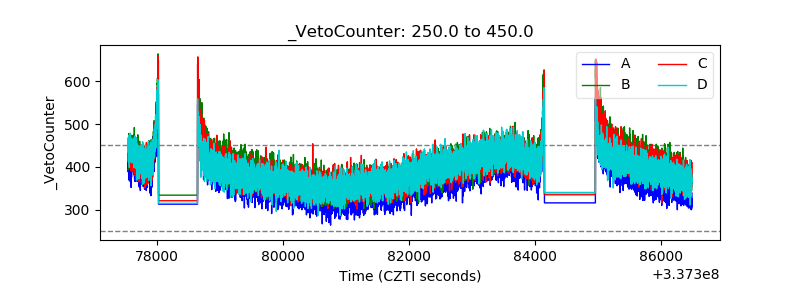 |