| Param | Original file | Final file |
|---|---|---|
| Filename | modeM0/AS1A09_038T09_9000003860_26773cztM0_level2.evt | modeM0/AS1A09_038T09_9000003860_26773cztM0_level2_quad_clean.evt |
| Size (bytes) | 920,085,120 | 98,147,520 |
| Size | 877.5 MB | 93.6 MB |
| Events in quadrant A | 4,174,056 | 710,589 |
| Events in quadrant B | 12,397,198 | 486,664 |
| Events in quadrant C | 3,149,772 | 707,737 |
| Events in quadrant D | 7,705,329 | 611,219 |
| Mode M0 | |||
|---|---|---|---|
| Quadrant | BADHDUFLAG | Total packets | Discarded packets |
| A | 0 | 16644 | 0 |
| B | 0 | 41254 | 0 |
| C | 0 | 13424 | 0 |
| D | 0 | 27358 | 0 |
| Mode M9 | |||
|---|---|---|---|
| Quadrant | BADHDUFLAG | Total packets | Discarded packets |
| A | 0 | 10 | 0 |
| B | 0 | 10 | 0 |
| C | 0 | 10 | 0 |
| D | 0 | 10 | 0 |
| Quadrant | Total seconds | Saturated seconds | Saturation percentage |
|---|---|---|---|
| A | 6511 | 32 | 0.491476% |
| B | 6512 | 3914 | 60.104423% |
| C | 6511 | 62 | 0.952235% |
| D | 6511 | 1244 | 19.106128% |
Noise dominated data is calculated using 1-second bins in cleaned event files. If a bin has >2000 counts, and if more than 50% of those come from <1% of pixels, then it is considered to be noise-dominated and hence unusable.
| Quadrant | # 1 sec bins | Bins with >0 counts | Bins with >2000 counts | High rate bins dominated by noise | Noise dominated (total time) | Noise dominated (detector-on time) | Marked lightcurve |
|---|---|---|---|---|---|---|---|
| A | 7501 | 6512 | 19 | 19 | 0.25% | 0.29% | 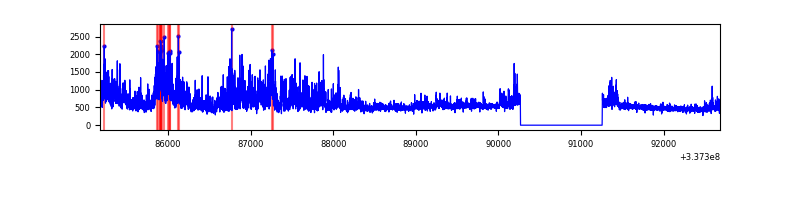 |
| B | 7502 | 6513 | 3381 | 3381 | 45.07% | 51.91% | 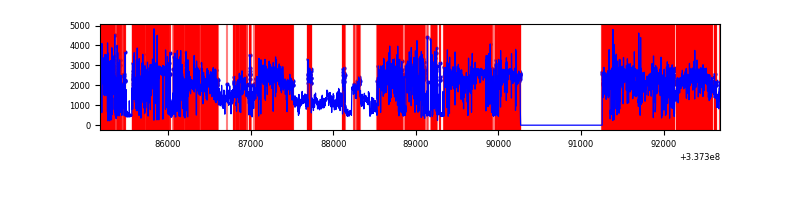 |
| C | 7501 | 6512 | 5 | 5 | 0.07% | 0.08% | 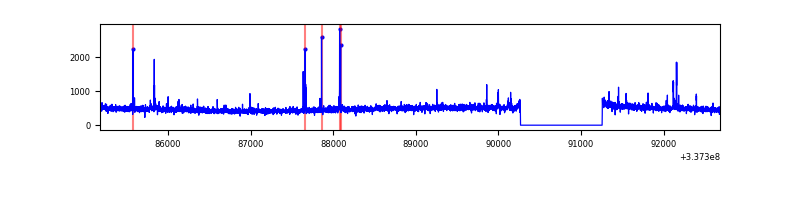 |
| D | 7501 | 6511 | 1028 | 1028 | 13.70% | 15.79% | 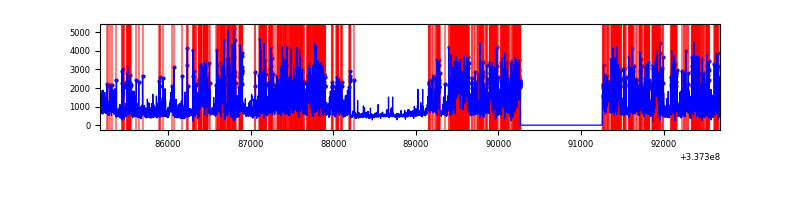 |
Top three noisy pixels from each quadrant. If the there are fewer than three noisy pixels in the level2.evt file, extra rows are filled as -1
| Pixel properties | Quadrant properties | ||||||
|---|---|---|---|---|---|---|---|
| Quadrant | DetID | PixID | Counts | Sigma | Mean | Median | Sigma |
| A | 0 | 13 | 1183196 | 7667.86 | 770 | 753 | 154.2 |
| A | 13 | 254 | 11270 | 68.2 | 770 | 753 | 154.2 |
| A | 6 | 16 | 9536 | 56.96 | 770 | 753 | 154.2 |
| B | 0 | 189 | 10203057 | 98265.54 | 555 | 540 | 103.8 |
| B | 10 | 246 | 13572 | 125.51 | 555 | 540 | 103.8 |
| B | 12 | 111 | 12737 | 117.47 | 555 | 540 | 103.8 |
| C | 14 | 238 | 121956 | 685.5 | 752 | 758 | 176.8 |
| C | 2 | 16 | 78572 | 440.12 | 752 | 758 | 176.8 |
| C | 15 | 208 | 14552 | 78.02 | 752 | 758 | 176.8 |
| D | 7 | 80 | 4119878 | 25022.06 | 691 | 674 | 164.6 |
| D | 1 | 52 | 790154 | 4795.69 | 691 | 674 | 164.6 |
| D | 2 | 250 | 112929 | 681.89 | 691 | 674 | 164.6 |
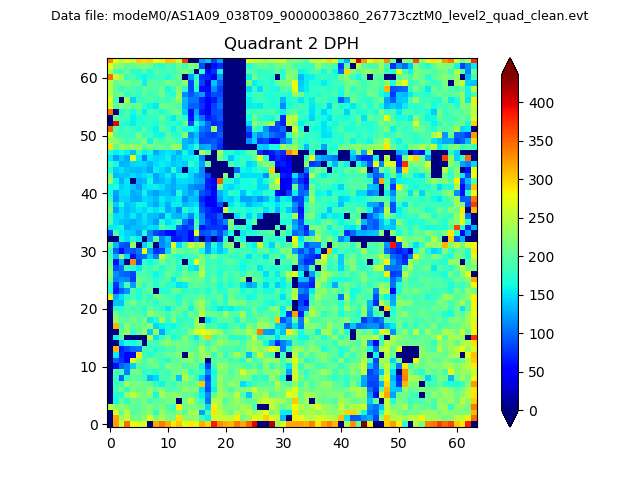
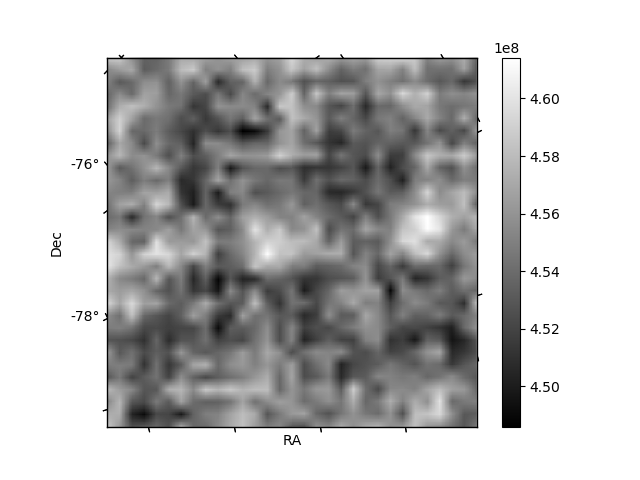
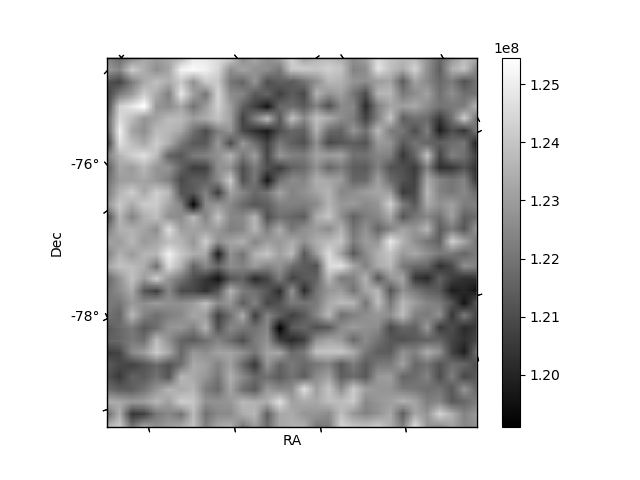
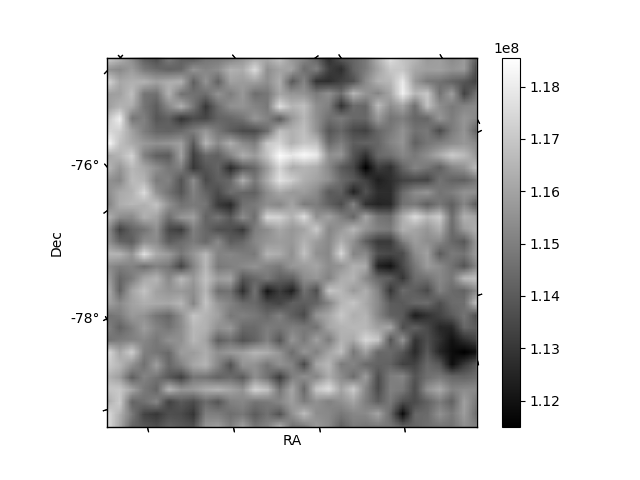
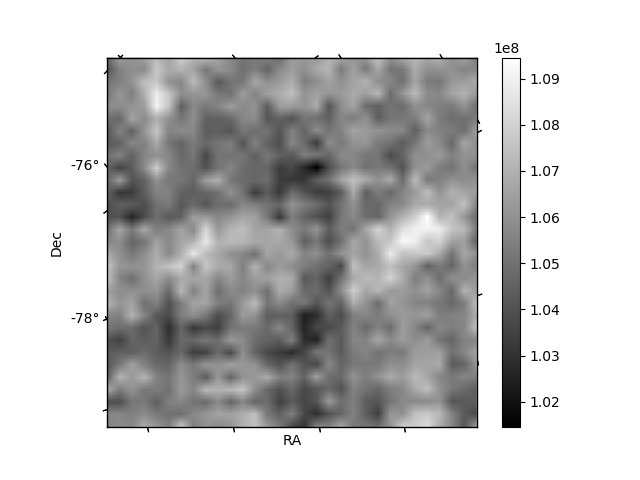
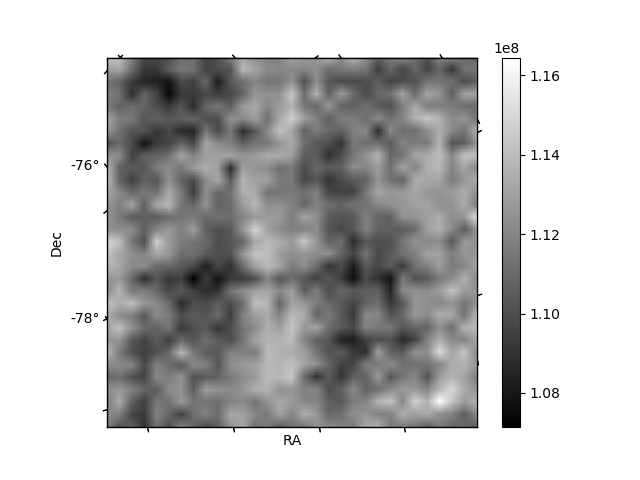
Histogram calculated using DETX and DETY for each event in the final _common_clean file
| Quadrant A | 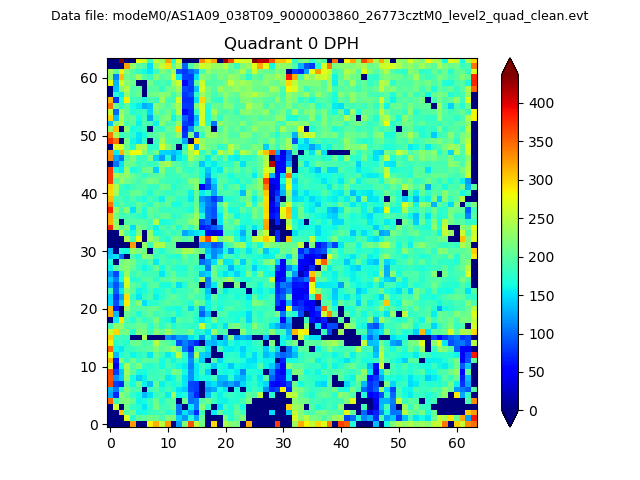 |
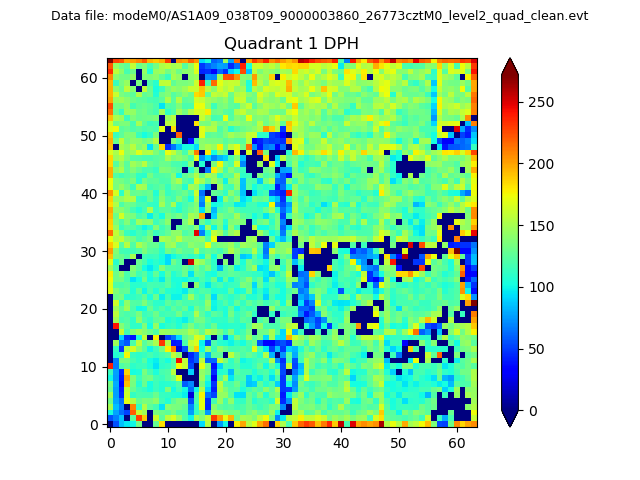 |
Quadrant B |
|---|---|---|---|
| Quadrant D | 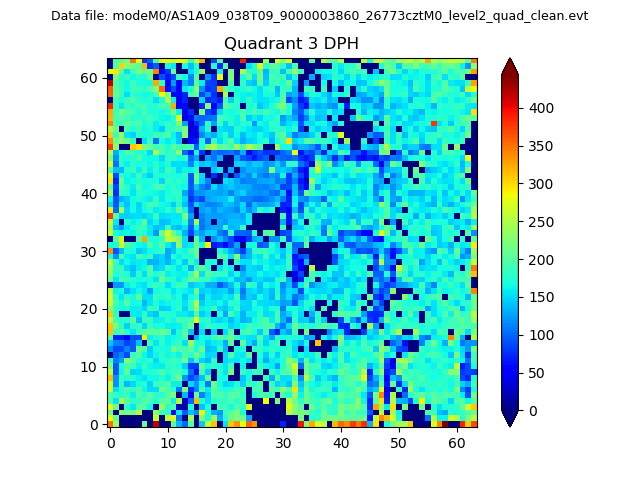 |
 |
Quadrant C |
| Plot type | Count rate plots | Images |
|---|---|---|
| Comparison with Poisson distribution Blue bars denote a histogram of data divided into 1 sec bins. Red curve is a Poisson curve with rate = median count rate of data. |
 |
 |
| Quadrant-wise count rates Data is divided into 100 sec bins |
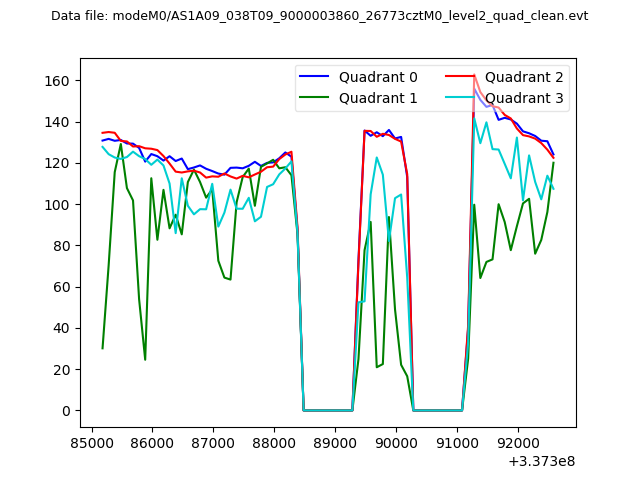 |
|
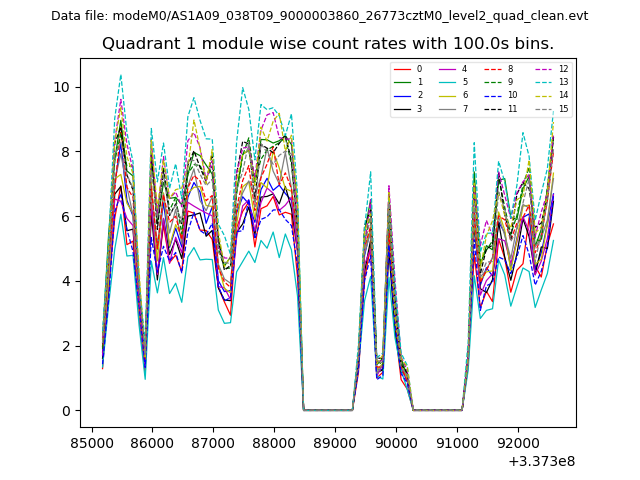
| Module-wise count rates for Quadrant A Data is divided into 100 sec bins |
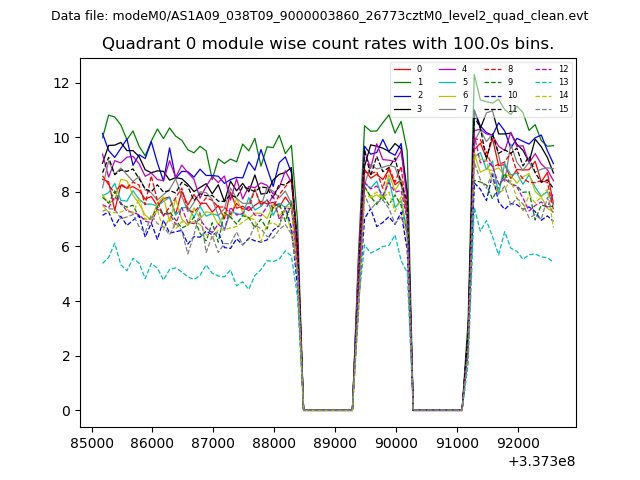 |
 |
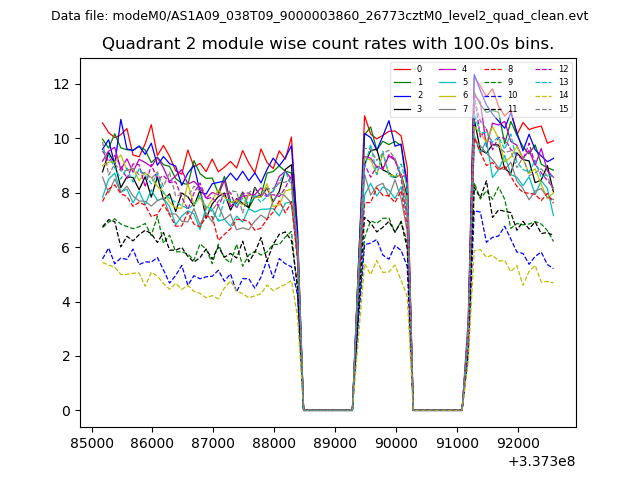
| Module-wise count rates for Quadrant B Data is divided into 100 sec bins |
 |
 |
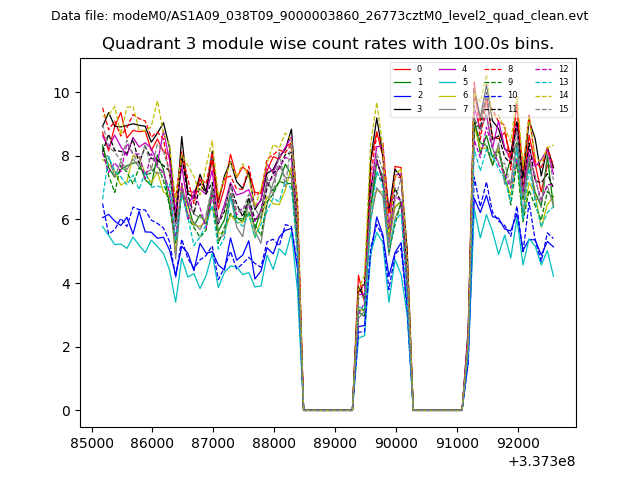
| Module-wise count rates for Quadrant C Data is divided into 100 sec bins |
 |
 |
| Module-wise count rates for Quadrant D Data is divided into 100 sec bins |
 |
 |
| Parameter | Plot |
|---|---|
| CZT HV Monitor | 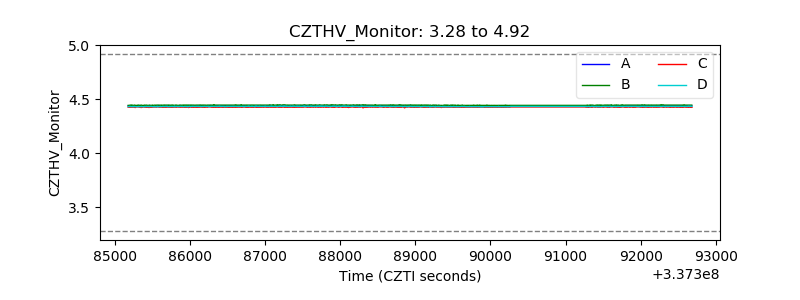 |
| D_VDD | 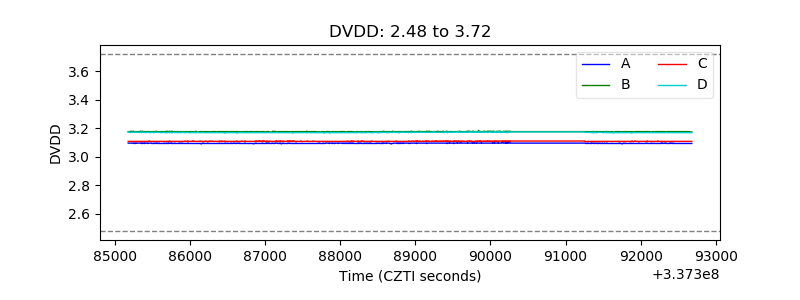 |
| Temperature 1 | 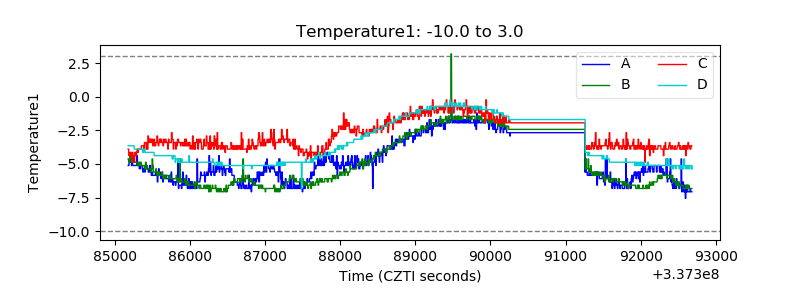 |
| Veto HV Monitor |  |
| Veto LLD | 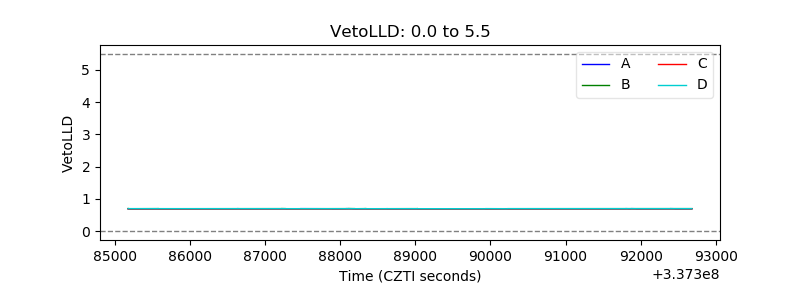 |
| Alpha Counter | 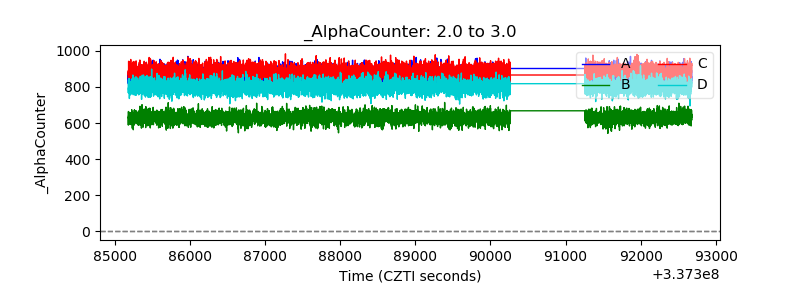 |
| _CPM_Rate | 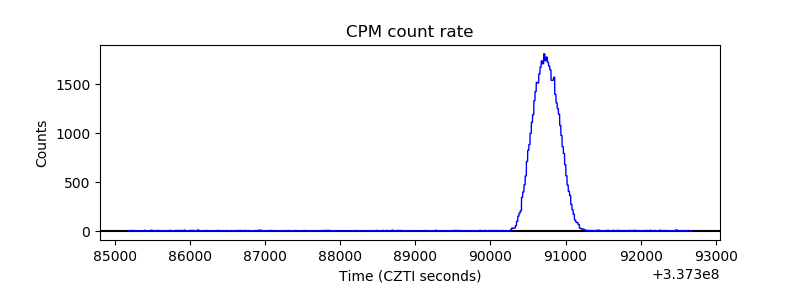 |
| CZT Counter | 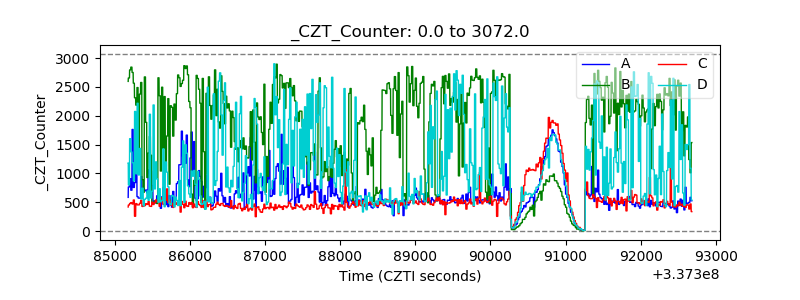 |
| +2.5 Volts monitor |  |
| +5 Volts monitor |  |
| _ROLL_ROT | 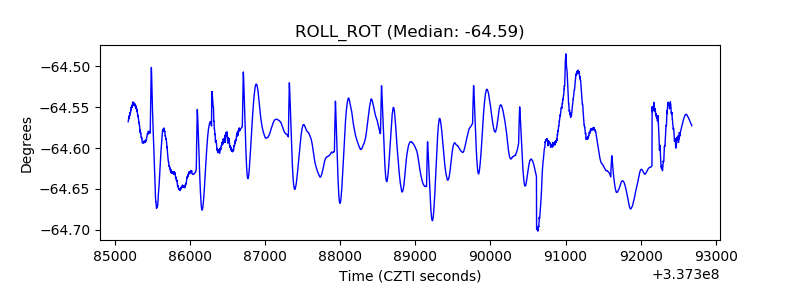 |
| _Roll_DEC | 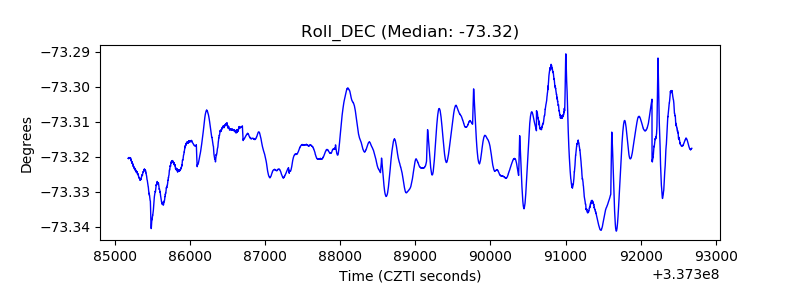 |
| _Roll_RA | 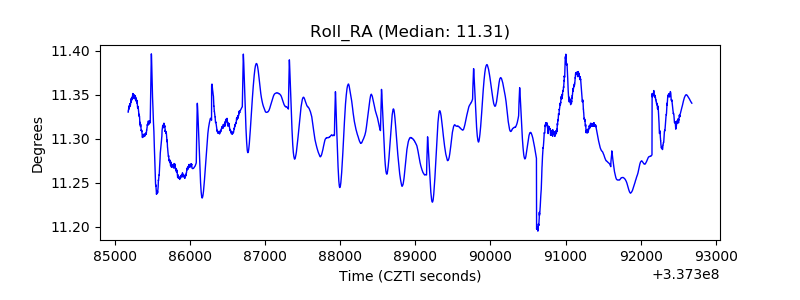 |
| Veto Counter | 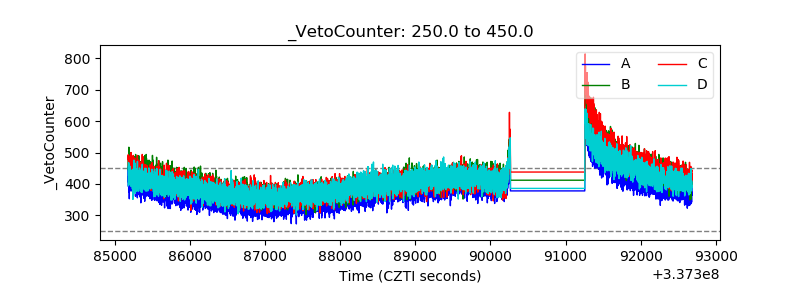 |