| Param | Original file | Final file |
|---|---|---|
| Filename | modeM0/AS1A09_038T09_9000003860_26774cztM0_level2.evt | modeM0/AS1A09_038T09_9000003860_26774cztM0_level2_quad_clean.evt |
| Size (bytes) | 315,964,800 | 40,587,840 |
| Size | 301.3 MB | 38.7 MB |
| Events in quadrant A | 1,136,569 | 301,400 |
| Events in quadrant B | 4,662,166 | 199,541 |
| Events in quadrant C | 1,100,060 | 298,063 |
| Events in quadrant D | 2,516,173 | 266,595 |
| Mode M0 | |||
|---|---|---|---|
| Quadrant | BADHDUFLAG | Total packets | Discarded packets |
| A | 0 | 4842 | 0 |
| B | 0 | 15390 | 0 |
| C | 0 | 4683 | 0 |
| D | 0 | 9051 | 0 |
| Mode M9 | |||
|---|---|---|---|
| Quadrant | BADHDUFLAG | Total packets | Discarded packets |
| A | 0 | 5 | 0 |
| B | 0 | 6 | 0 |
| C | 0 | 6 | 0 |
| D | 0 | 6 | 0 |
| Quadrant | Total seconds | Saturated seconds | Saturation percentage |
|---|---|---|---|
| A | 2244 | 1 | 0.044563% |
| B | 2244 | 1579 | 70.365419% |
| C | 2244 | 13 | 0.579323% |
| D | 2244 | 359 | 15.998217% |
Noise dominated data is calculated using 1-second bins in cleaned event files. If a bin has >2000 counts, and if more than 50% of those come from <1% of pixels, then it is considered to be noise-dominated and hence unusable.
| Quadrant | # 1 sec bins | Bins with >0 counts | Bins with >2000 counts | High rate bins dominated by noise | Noise dominated (total time) | Noise dominated (detector-on time) | Marked lightcurve |
|---|---|---|---|---|---|---|---|
| A | 2244 | 2244 | 0 | 0 | 0.00% | 0.00% | 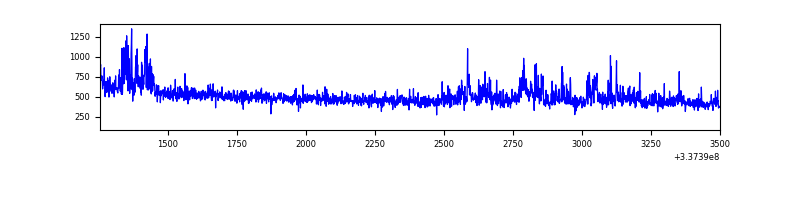 |
| B | 2244 | 2244 | 1375 | 1375 | 61.27% | 61.27% | 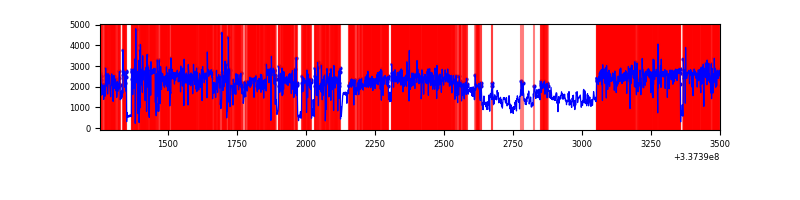 |
| C | 2244 | 2244 | 0 | 0 | 0.00% | 0.00% | 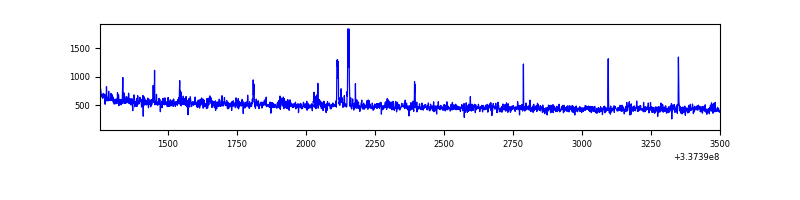 |
| D | 2244 | 2244 | 313 | 313 | 13.95% | 13.95% | 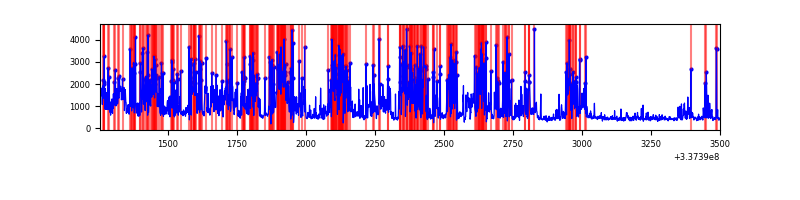 |
Top three noisy pixels from each quadrant. If the there are fewer than three noisy pixels in the level2.evt file, extra rows are filled as -1
| Pixel properties | Quadrant properties | ||||||
|---|---|---|---|---|---|---|---|
| Quadrant | DetID | PixID | Counts | Sigma | Mean | Median | Sigma |
| A | 0 | 13 | 113901 | 2103.32 | 263 | 258 | 54.0 |
| A | 13 | 34 | 5461 | 96.3 | 263 | 258 | 54.0 |
| A | 13 | 254 | 4109 | 71.27 | 263 | 258 | 54.0 |
| B | 0 | 189 | 3910003 | 104373.88 | 190 | 185 | 37.5 |
| B | 12 | 111 | 4319 | 110.36 | 190 | 185 | 37.5 |
| B | 0 | 229 | 4114 | 104.89 | 190 | 185 | 37.5 |
| C | 14 | 238 | 42146 | 661.99 | 262 | 264 | 63.3 |
| C | 2 | 16 | 36549 | 573.53 | 262 | 264 | 63.3 |
| C | 13 | 61 | 1769 | 23.79 | 262 | 264 | 63.3 |
| D | 7 | 80 | 1417662 | 24291.38 | 240 | 234 | 58.4 |
| D | 1 | 52 | 115900 | 1982.24 | 240 | 234 | 58.4 |
| D | 11 | 176 | 28481 | 484.09 | 240 | 234 | 58.4 |
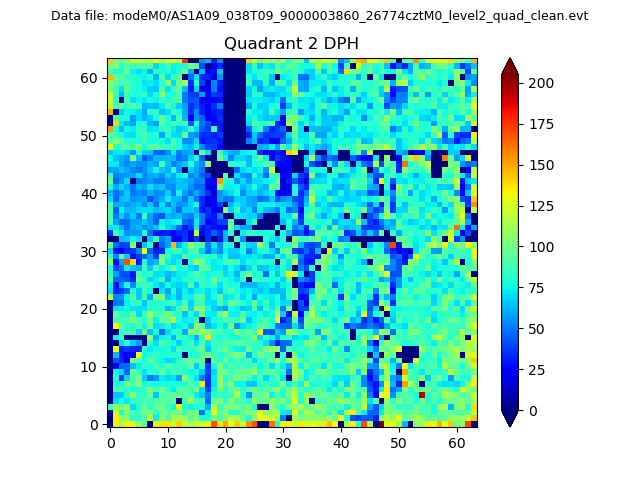
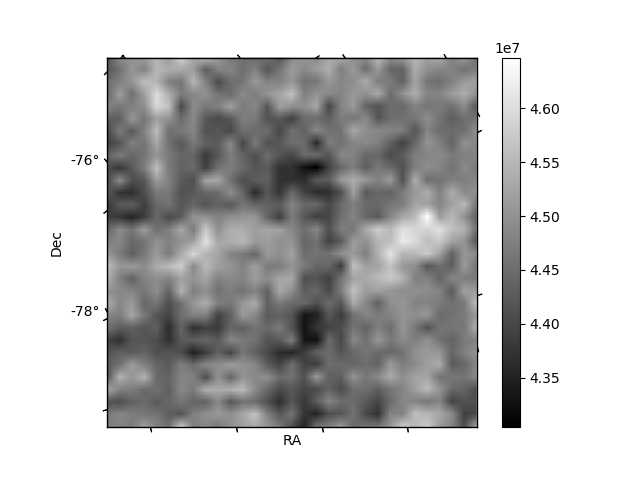
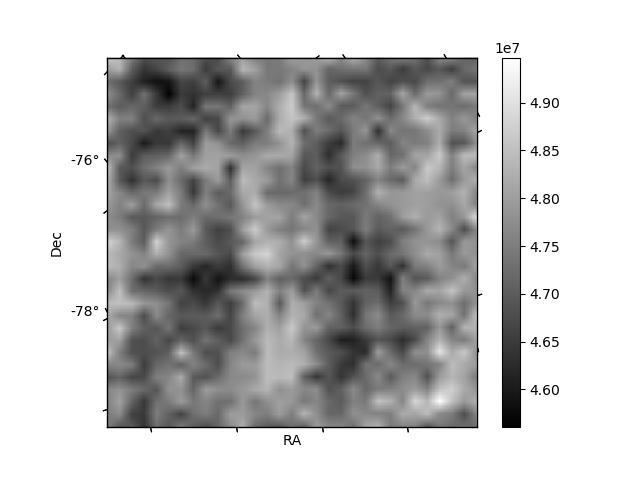
Histogram calculated using DETX and DETY for each event in the final _common_clean file
| Quadrant A | 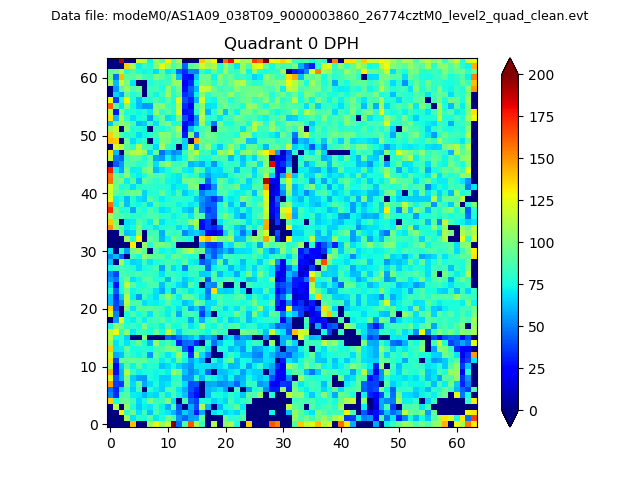 |
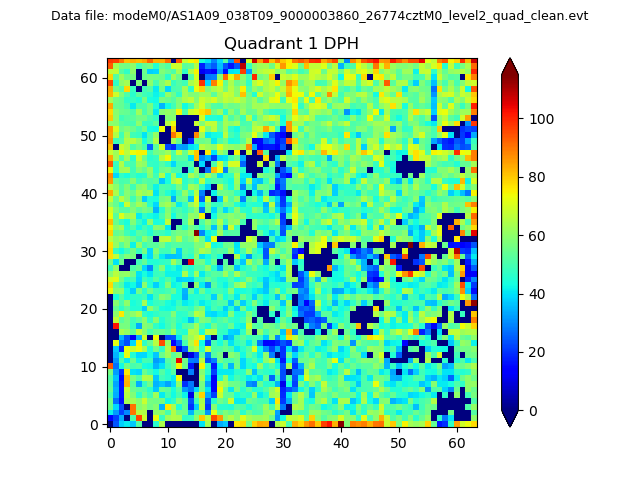 |
Quadrant B |
|---|---|---|---|
| Quadrant D | 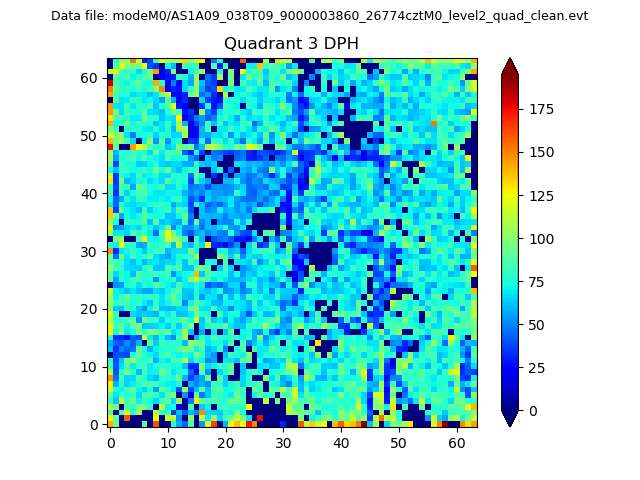 |
 |
Quadrant C |
| Plot type | Count rate plots | Images |
|---|---|---|
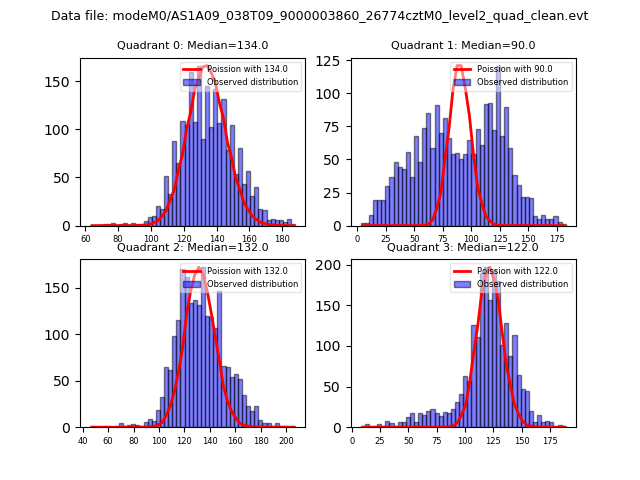
| Comparison with Poisson distribution Blue bars denote a histogram of data divided into 1 sec bins. Red curve is a Poisson curve with rate = median count rate of data. |
 |
 |
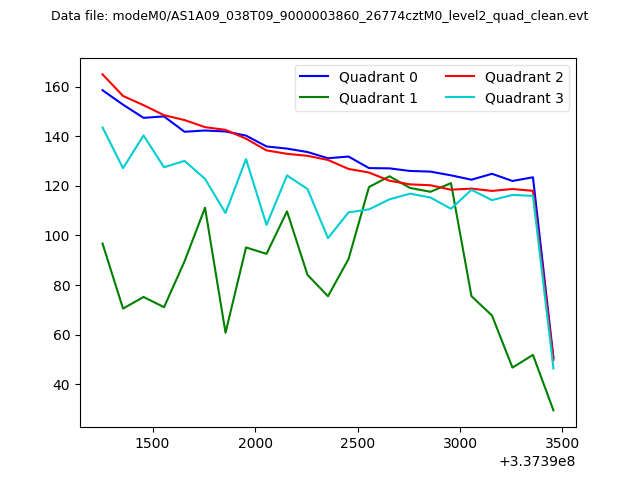
| Quadrant-wise count rates Data is divided into 100 sec bins |
 |
|
| Module-wise count rates for Quadrant A Data is divided into 100 sec bins |
 |
 |
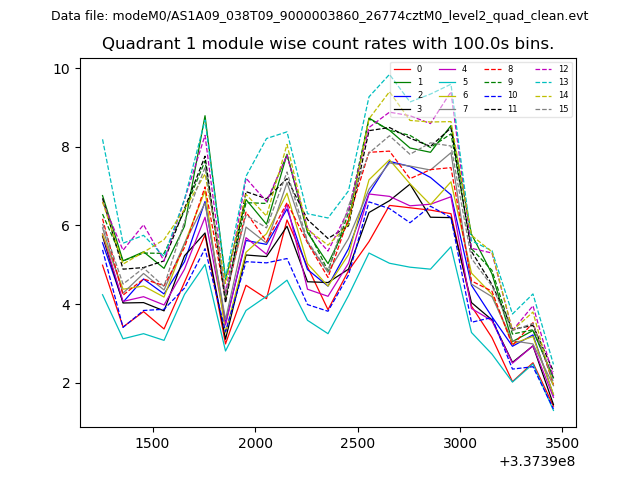
| Module-wise count rates for Quadrant B Data is divided into 100 sec bins |
 |
 |
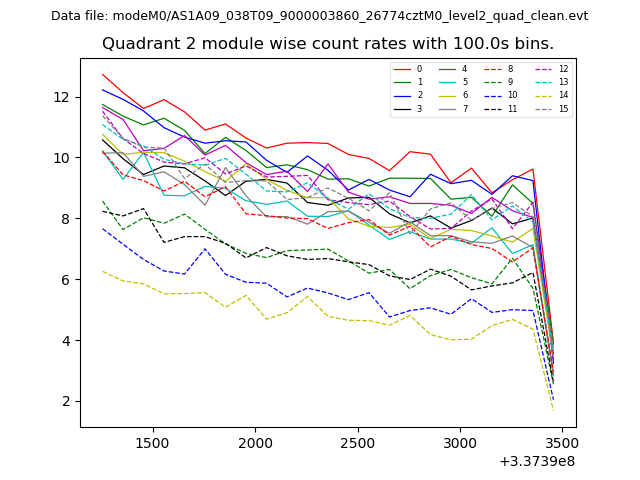
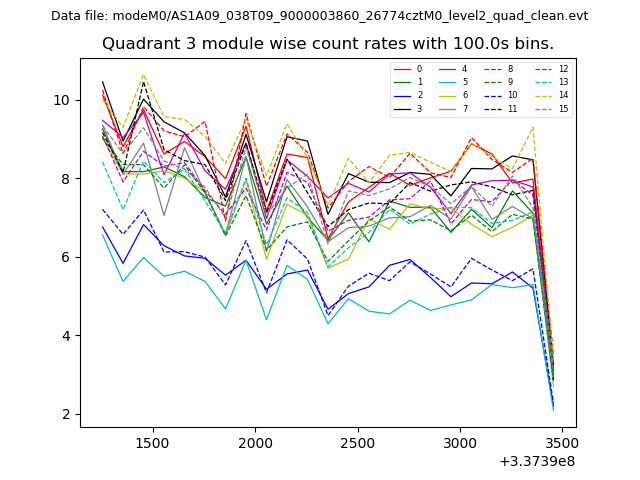
| Module-wise count rates for Quadrant C Data is divided into 100 sec bins |
 |
 |
| Module-wise count rates for Quadrant D Data is divided into 100 sec bins |
 |
 |
| Parameter | Plot |
|---|---|
| CZT HV Monitor | 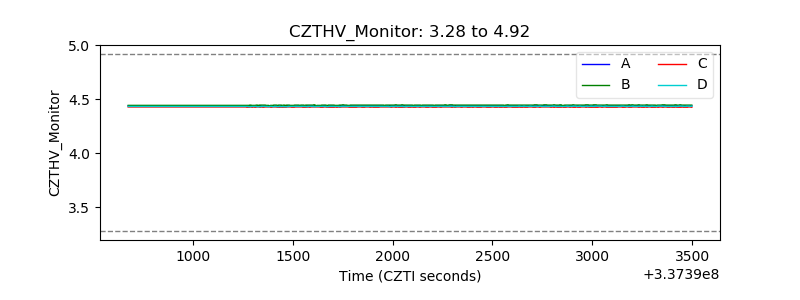 |
| D_VDD |  |
| Temperature 1 | 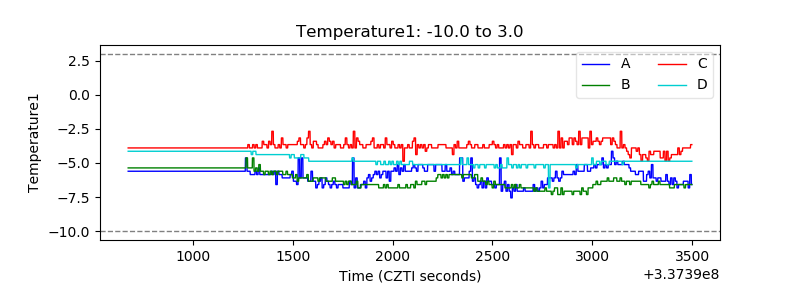 |
| Veto HV Monitor | 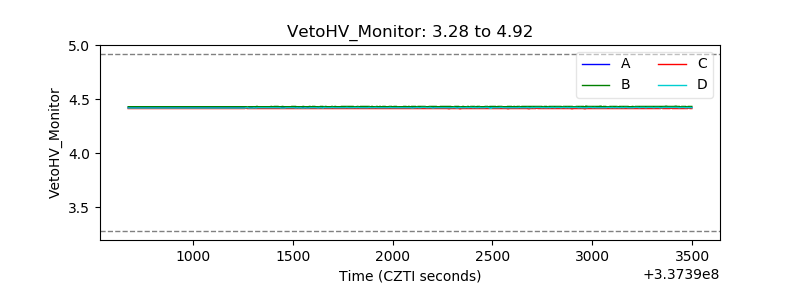 |
| Veto LLD | 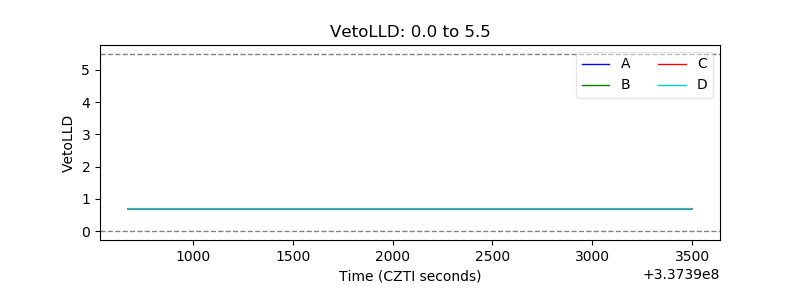 |
| Alpha Counter | 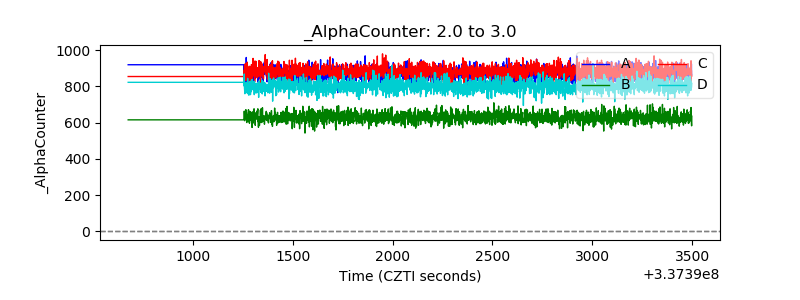 |
| _CPM_Rate | 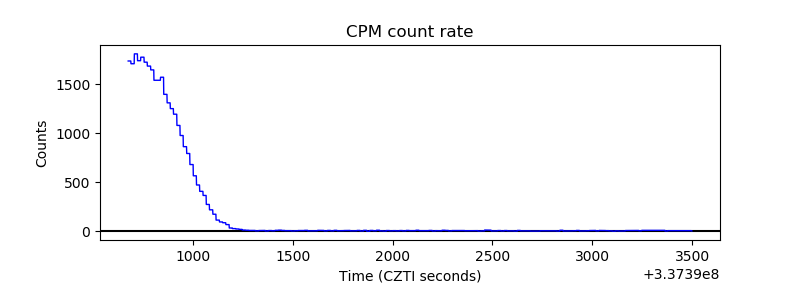 |
| CZT Counter | 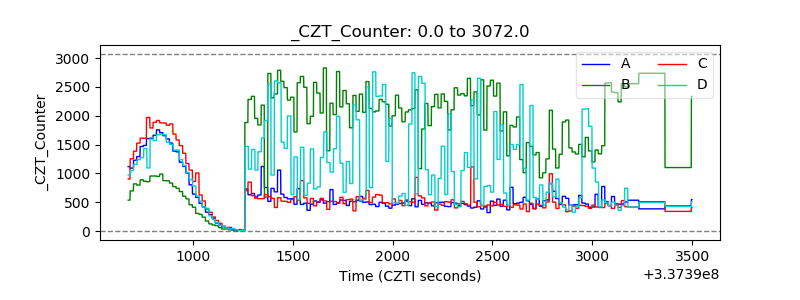 |
| +2.5 Volts monitor |  |
| +5 Volts monitor |  |
| _ROLL_ROT | 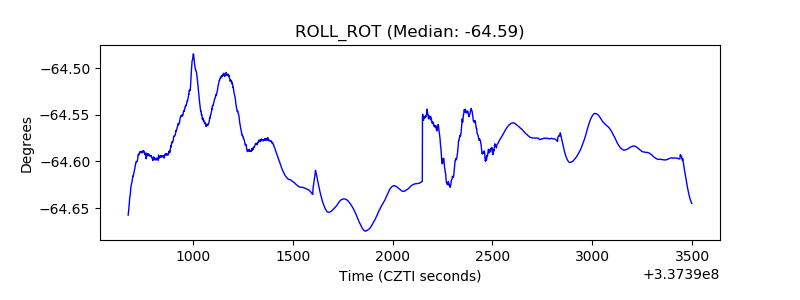 |
| _Roll_DEC |  |
| _Roll_RA | 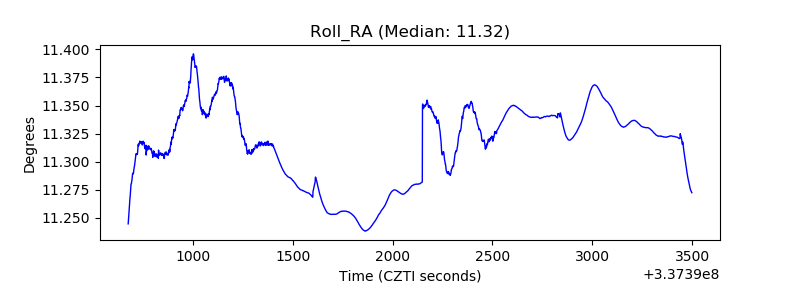 |
| Veto Counter | 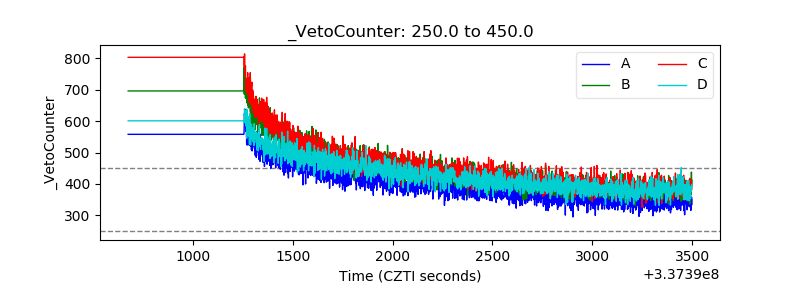 |