| Param | Original file | Final file |
|---|---|---|
| Filename | modeM0/AS1A09_145T01_9000003854cztM0_level2.fits | modeM0/AS1A09_145T01_9000003854cztM0_level2_quad_clean.evt |
| Size (bytes) | 166,579,200 | 152,527,680 |
| Size | 158.9 MB | 145.5 MB |
| Events in quadrant A | 1,085,918 | 971,574 |
| Events in quadrant B | 976,842 | 952,550 |
| Events in quadrant C | 1,052,960 | 922,573 |
| Events in quadrant D | 735,402 | 581,601 |
| Mode M0 | |||
|---|---|---|---|
| Quadrant | BADHDUFLAG | Total packets | Discarded packets |
| A | 0 | 40574 | 0 |
| B | 0 | 51501 | 0 |
| C | 0 | 37484 | 0 |
| D | 0 | 91531 | 0 |
| Mode SS | |||
|---|---|---|---|
| Quadrant | BADHDUFLAG | Total packets | Discarded packets |
| A | 0 | 270 | 0 |
| B | 0 | 270 | 0 |
| C | 0 | 270 | 0 |
| D | 0 | 270 | 0 |
| Mode M9 | |||
|---|---|---|---|
| Quadrant | BADHDUFLAG | Total packets | Discarded packets |
| A | 0 | 19 | 0 |
| B | 0 | 19 | 0 |
| C | 0 | 19 | 0 |
| D | 0 | 19 | 0 |
| Quadrant | Total seconds | Saturated seconds | Saturation percentage |
|---|---|---|---|
| A | 17535 | 501 | 2.857143% |
| B | 17535 | 2018 | 11.508412% |
| C | 17535 | 466 | 2.657542% |
| D | 17535 | 6418 | 36.601084% |
Noise dominated data is calculated using 1-second bins in cleaned event files. If a bin has >2000 counts, and if more than 50% of those come from <1% of pixels, then it is considered to be noise-dominated and hence unusable.
| Quadrant | # 1 sec bins | Bins with >0 counts | Bins with >2000 counts | High rate bins dominated by noise | Noise dominated (total time) | Noise dominated (detector-on time) | Marked lightcurve |
|---|---|---|---|---|---|---|---|
| A | 19445 | 17532 | 0 | 0 | 0.00% | 0.00% |  |
| B | 19445 | 17511 | 0 | 0 | 0.00% | 0.00% |  |
| C | 19445 | 17535 | 0 | 0 | 0.00% | 0.00% |  |
| D | 19445 | 17252 | 0 | 0 | 0.00% | 0.00% | 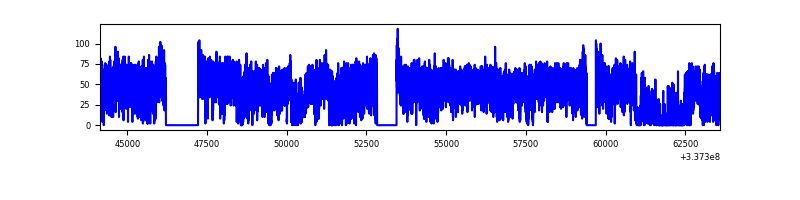 |
Top three noisy pixels from each quadrant. If the there are fewer than three noisy pixels in the level2.evt file, extra rows are filled as -1
| Pixel properties | Quadrant properties | ||||||
|---|---|---|---|---|---|---|---|
| Quadrant | DetID | PixID | Counts | Sigma | Mean | Median | Sigma |
| A | 0 | 29 | 993 | 10.23 | 282 | 266 | 71.0 |
| A | 7 | 110 | 889 | 8.77 | 282 | 266 | 71.0 |
| A | 0 | 30 | 853 | 8.26 | 282 | 266 | 71.0 |
| B | 2 | 9 | 790 | 10.25 | 258 | 246 | 53.1 |
| B | 3 | 17 | 665 | 7.9 | 258 | 246 | 53.1 |
| B | 2 | 8 | 646 | 7.54 | 258 | 246 | 53.1 |
| C | 12 | 241 | 754 | 6.96 | 278 | 260 | 71.0 |
| C | 9 | 209 | 740 | 6.76 | 278 | 260 | 71.0 |
| C | 2 | 191 | 708 | 6.31 | 278 | 260 | 71.0 |
| D | 1 | 31 | 521 | 5.81 | 210 | 191 | 56.8 |
| D | 6 | 67 | 520 | 5.79 | 210 | 191 | 56.8 |
| D | 4 | 160 | 517 | 5.73 | 210 | 191 | 56.8 |
Histogram calculated using DETX and DETY for each event in the final _common_clean file
| Quadrant A |  |
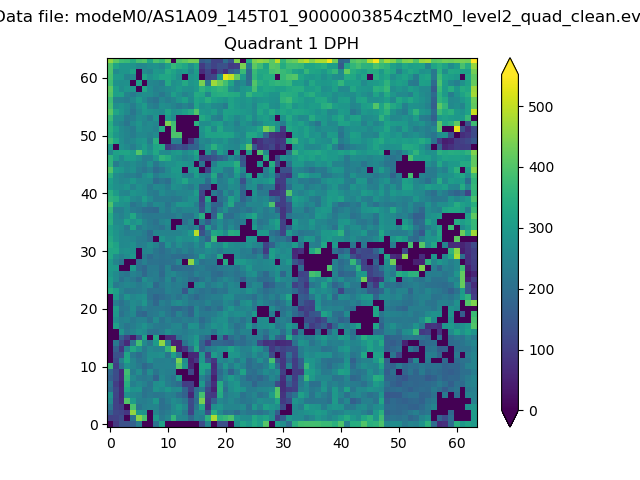 |
Quadrant B |
|---|---|---|---|
| Quadrant D |  |
 |
Quadrant C |
| Plot type | Count rate plots | Images |
|---|---|---|
| Comparison with Poisson distribution Blue bars denote a histogram of data divided into 1 sec bins. Red curve is a Poisson curve with rate = median count rate of data. |
 |
 |
| Quadrant-wise count rates Data is divided into 100 sec bins |
 |
|
| Module-wise count rates for Quadrant A Data is divided into 100 sec bins |
 |
 |
| Module-wise count rates for Quadrant B Data is divided into 100 sec bins |
 |
 |
| Module-wise count rates for Quadrant C Data is divided into 100 sec bins |
 |
 |
| Module-wise count rates for Quadrant D Data is divided into 100 sec bins |
 |
 |
| Parameter | Plot |
|---|---|
| CZT HV Monitor |  |
| D_VDD |  |
| Temperature 1 | 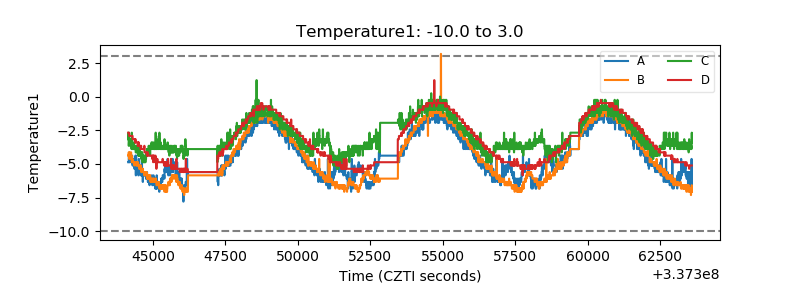 |
| Veto HV Monitor | 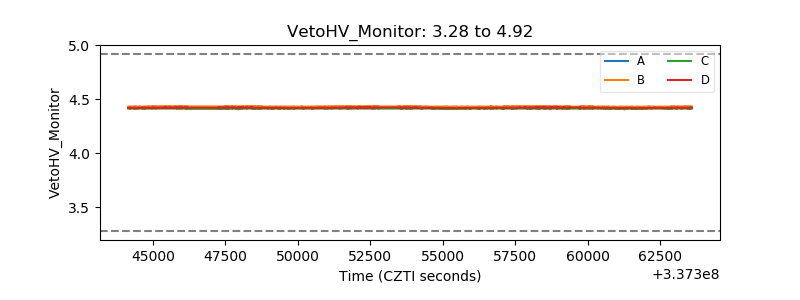 |
| Veto LLD |  |
| Alpha Counter |  |
| _CPM_Rate |  |
| CZT Counter |  |
| +2.5 Volts monitor |  |
| +5 Volts monitor |  |
| _ROLL_ROT |  |
| _Roll_DEC | 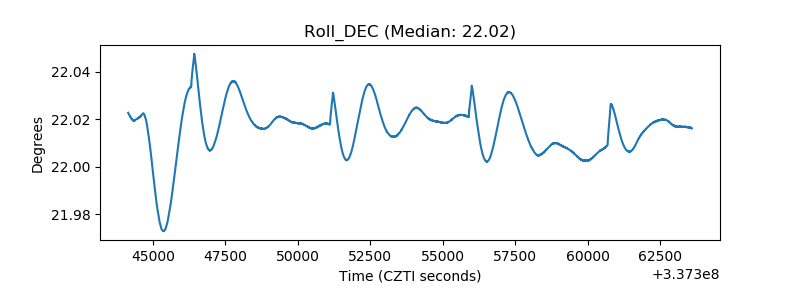 |
| _Roll_RA | 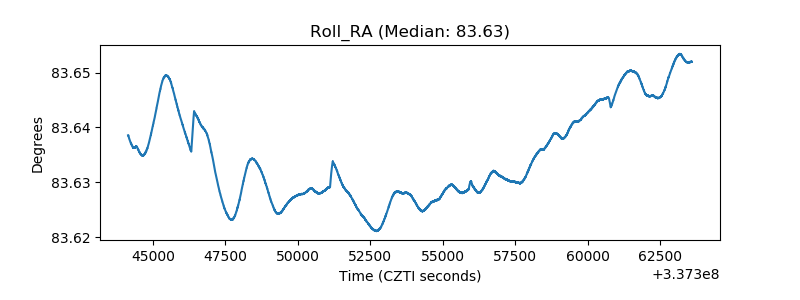 |
| Veto Counter |  |