| Param | Original file | Final file |
|---|---|---|
| Filename | modeM0/AS1A09_145T01_9000003854_26766cztM0_level2.fits | modeM0/AS1A09_145T01_9000003854_26766cztM0_level2_quad_clean.evt |
| Size (bytes) | 292,884,480 | 68,630,400 |
| Size | 279.3 MB | 65.5 MB |
| Events in quadrant A | 1,874,654 | 497,535 |
| Events in quadrant B | 1,973,676 | 502,048 |
| Events in quadrant C | 2,042,860 | 470,020 |
| Events in quadrant D | 4,682,342 | 365,312 |
| Mode M0 | |||
|---|---|---|---|
| Quadrant | BADHDUFLAG | Total packets | Discarded packets |
| A | 0 | 7458 | 1 |
| B | 0 | 7734 | 1 |
| C | 0 | 7984 | 2 |
| D | 0 | 16328 | 1 |
| Mode SS | |||
|---|---|---|---|
| Quadrant | BADHDUFLAG | Total packets | Discarded packets |
| A | 0 | 72 | 0 |
| B | 0 | 72 | 0 |
| C | 0 | 72 | 0 |
| D | 0 | 72 | 0 |
| Mode M9 | |||
|---|---|---|---|
| Quadrant | BADHDUFLAG | Total packets | Discarded packets |
| A | 0 | 10 | 0 |
| B | 0 | 10 | 0 |
| C | 0 | 10 | 0 |
| D | 0 | 10 | 0 |
| Quadrant | Total seconds | Saturated seconds | Saturation percentage |
|---|---|---|---|
| A | 3432 | 90 | 2.622378% |
| B | 3432 | 136 | 3.962704% |
| C | 3431 | 154 | 4.488487% |
| D | 3431 | 883 | 25.735937% |
Noise dominated data is calculated using 1-second bins in cleaned event files. If a bin has >2000 counts, and if more than 50% of those come from <1% of pixels, then it is considered to be noise-dominated and hence unusable.
| Quadrant | # 1 sec bins | Bins with >0 counts | Bins with >2000 counts | High rate bins dominated by noise | Noise dominated (total time) | Noise dominated (detector-on time) | Marked lightcurve |
|---|---|---|---|---|---|---|---|
| A | 4442 | 3433 | 0 | 0 | 0.00% | 0.00% | 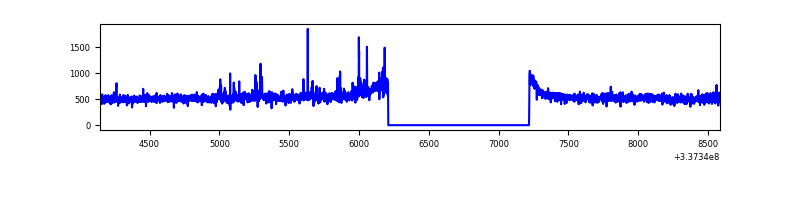 |
| B | 4442 | 3433 | 42 | 42 | 0.95% | 1.22% | 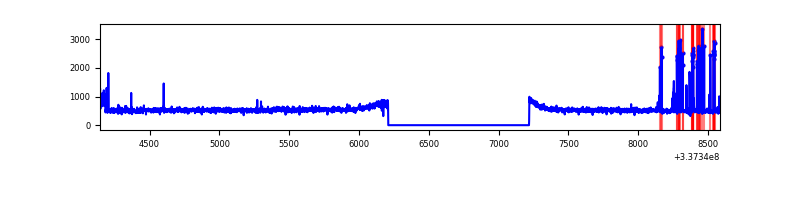 |
| C | 4441 | 3432 | 50 | 50 | 1.13% | 1.46% | 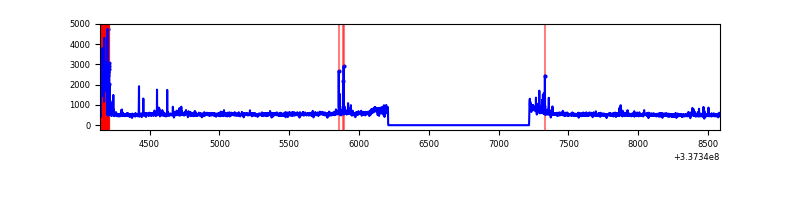 |
| D | 4440 | 3431 | 574 | 574 | 12.93% | 16.73% | 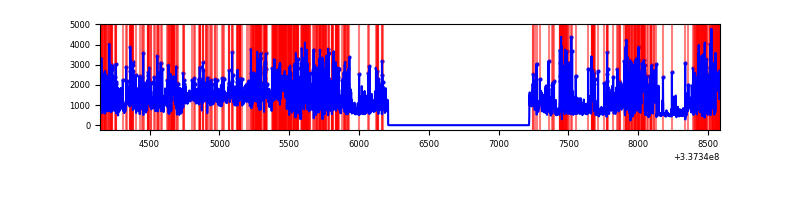 |
Top three noisy pixels from each quadrant. If the there are fewer than three noisy pixels in the level2.evt file, extra rows are filled as -1
| Pixel properties | Quadrant properties | ||||||
|---|---|---|---|---|---|---|---|
| Quadrant | DetID | PixID | Counts | Sigma | Mean | Median | Sigma |
| A | 0 | 13 | 50055 | 512.93 | 472 | 463 | 96.7 |
| A | 13 | 254 | 5521 | 52.31 | 472 | 463 | 96.7 |
| A | 3 | 137 | 4278 | 39.46 | 472 | 463 | 96.7 |
| B | 0 | 189 | 142345 | 1594.39 | 464 | 455 | 89.0 |
| B | 12 | 111 | 10412 | 111.89 | 464 | 455 | 89.0 |
| B | 11 | 111 | 9627 | 103.06 | 464 | 455 | 89.0 |
| C | 2 | 16 | 216317 | 2038.8 | 448 | 452 | 105.9 |
| C | 14 | 238 | 70772 | 664.15 | 448 | 452 | 105.9 |
| C | 10 | 22 | 6628 | 58.33 | 448 | 452 | 105.9 |
| D | 7 | 80 | 2267048 | 22760.63 | 412 | 403 | 99.6 |
| D | 1 | 52 | 366500 | 3676.18 | 412 | 403 | 99.6 |
| D | 15 | 36 | 214272 | 2147.58 | 412 | 403 | 99.6 |
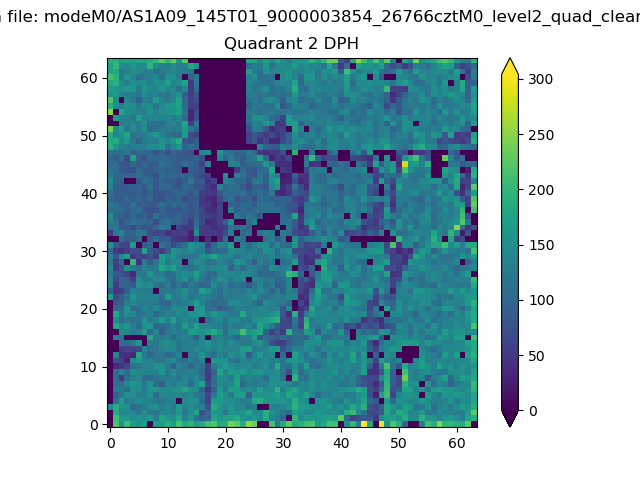
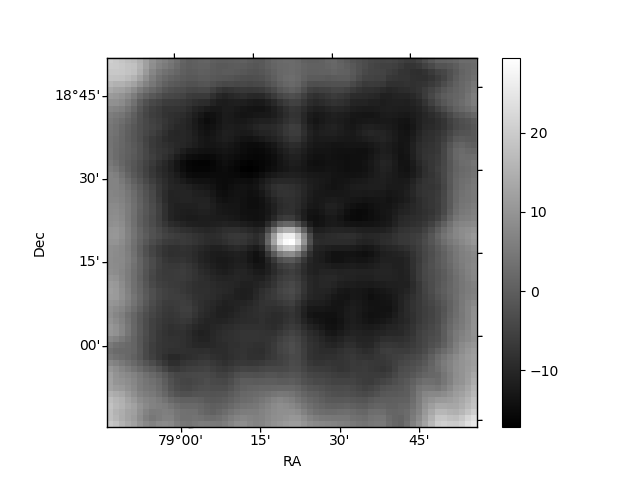
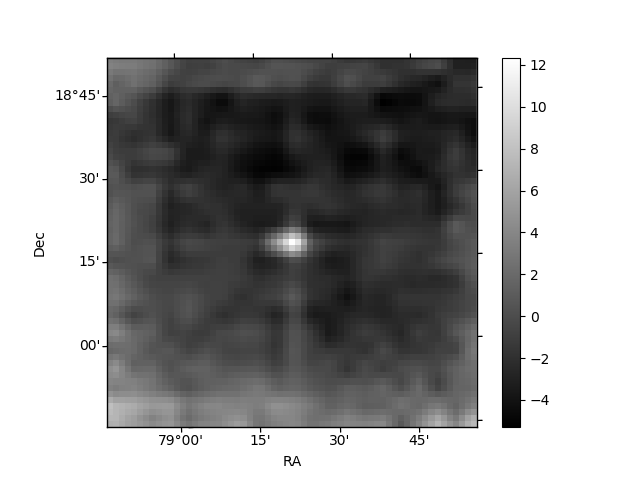
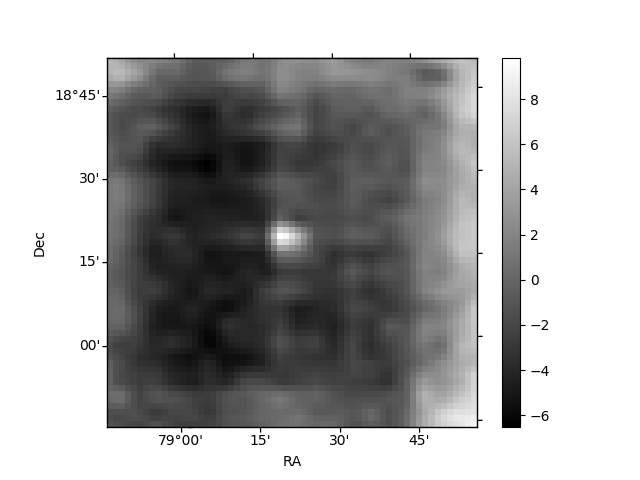
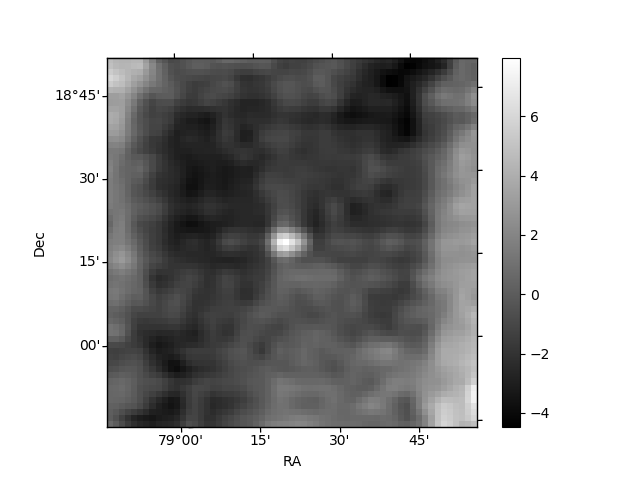
Histogram calculated using DETX and DETY for each event in the final _common_clean file
| Quadrant A | 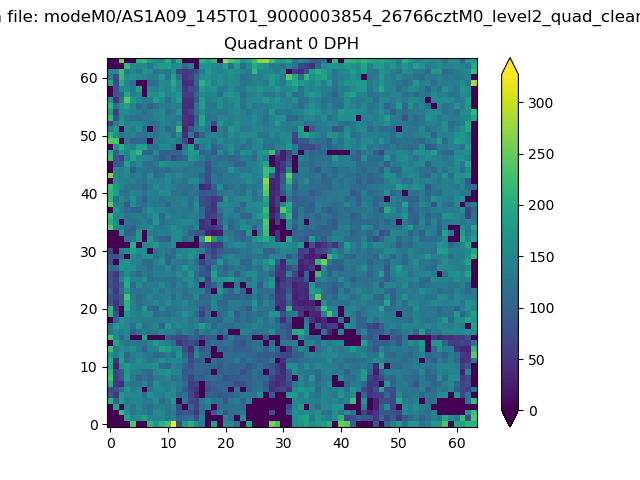 |
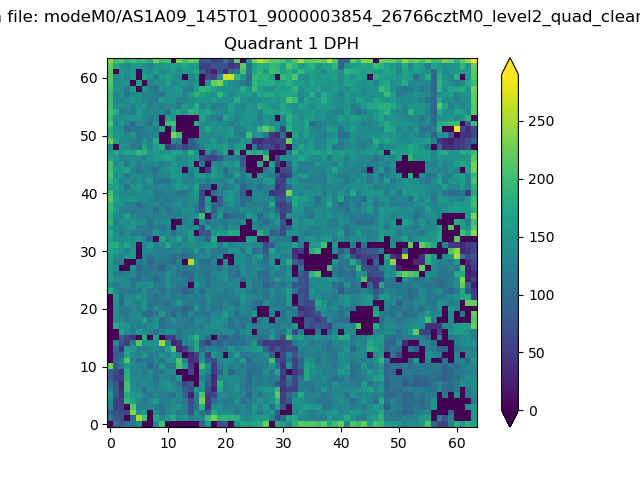 |
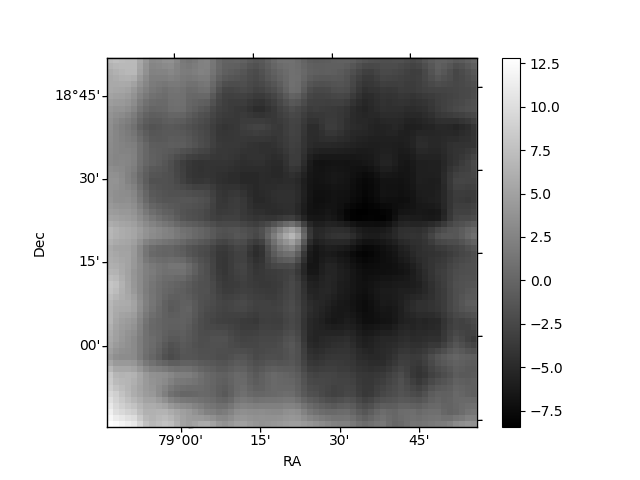
Quadrant B |
|---|---|---|---|
| Quadrant D | 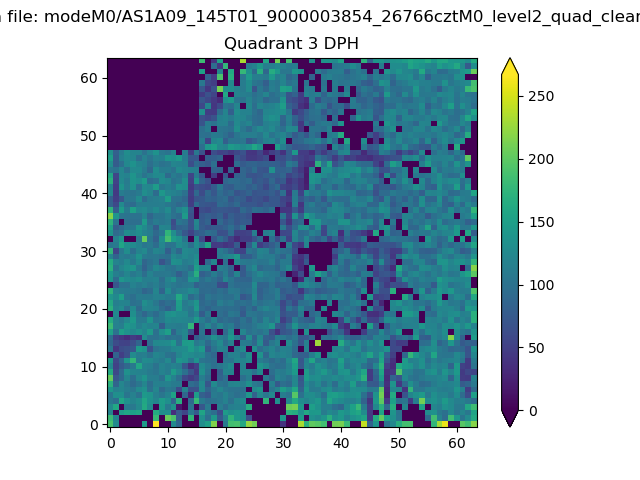 |
 |
Quadrant C |
| Plot type | Count rate plots | Images |
|---|---|---|
| Comparison with Poisson distribution Blue bars denote a histogram of data divided into 1 sec bins. Red curve is a Poisson curve with rate = median count rate of data. |
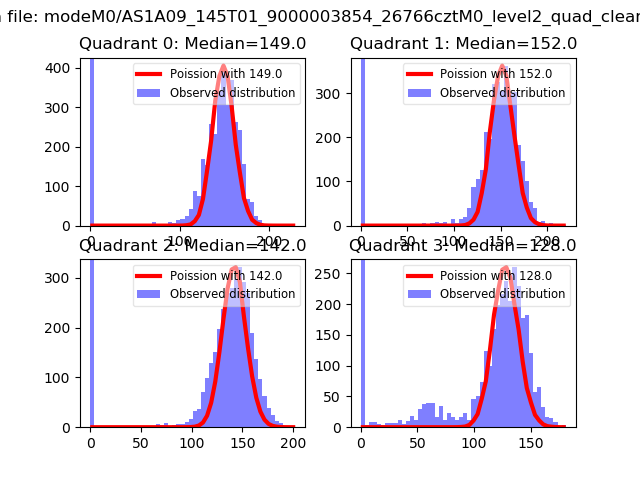 |
 |
| Quadrant-wise count rates Data is divided into 100 sec bins |
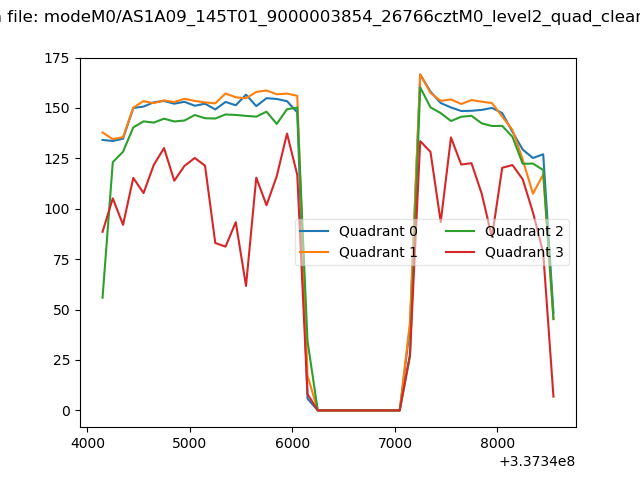 |
|
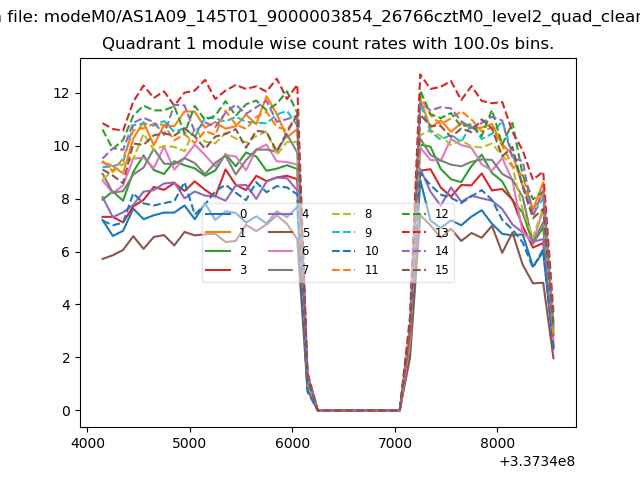
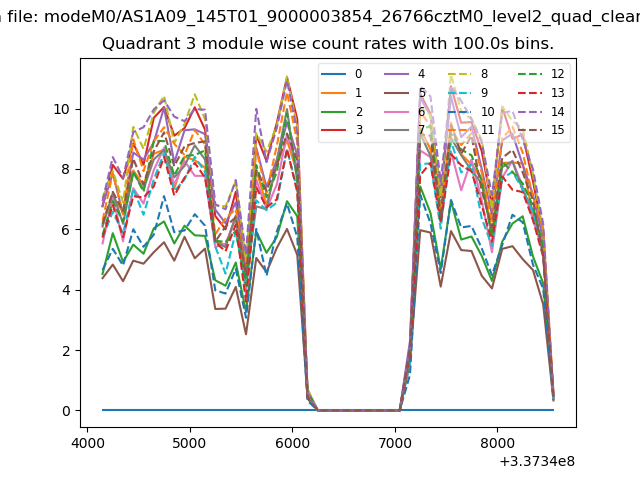
| Module-wise count rates for Quadrant A Data is divided into 100 sec bins |
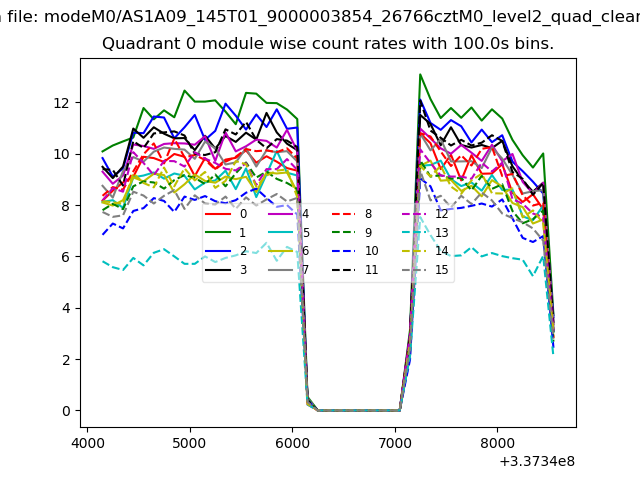 |
 |
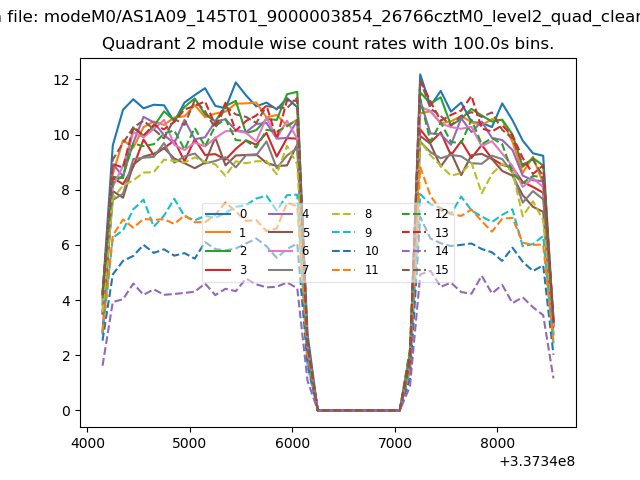
| Module-wise count rates for Quadrant B Data is divided into 100 sec bins |
 |
 |
| Module-wise count rates for Quadrant C Data is divided into 100 sec bins |
 |
 |
| Module-wise count rates for Quadrant D Data is divided into 100 sec bins |
 |
 |
| Parameter | Plot |
|---|---|
| CZT HV Monitor | 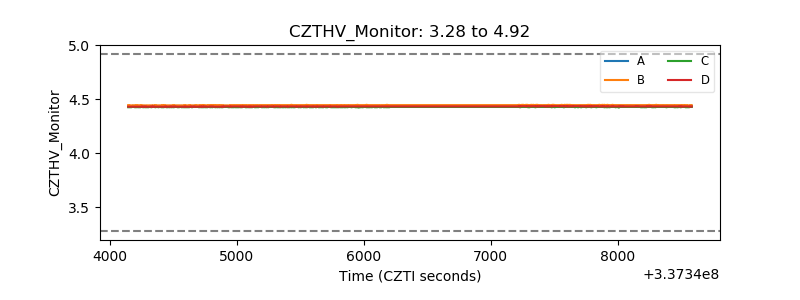 |
| D_VDD | 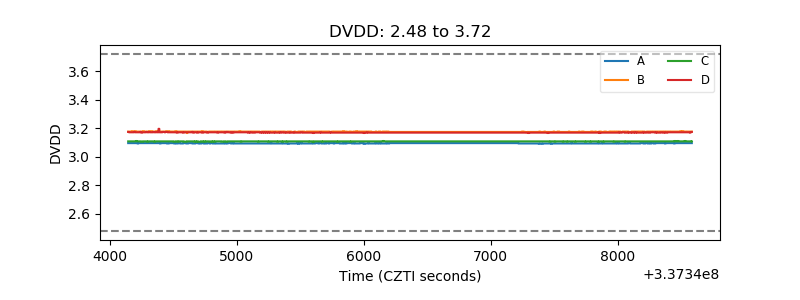 |
| Temperature 1 | 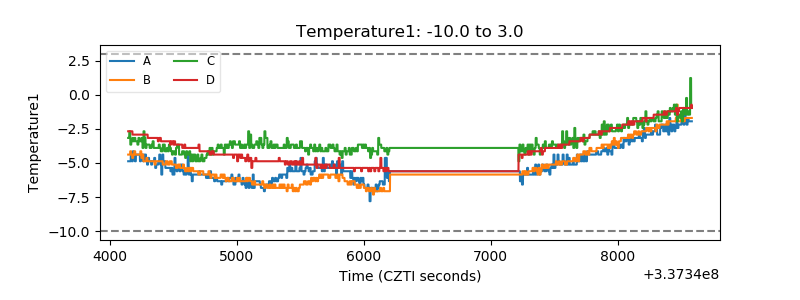 |
| Veto HV Monitor | 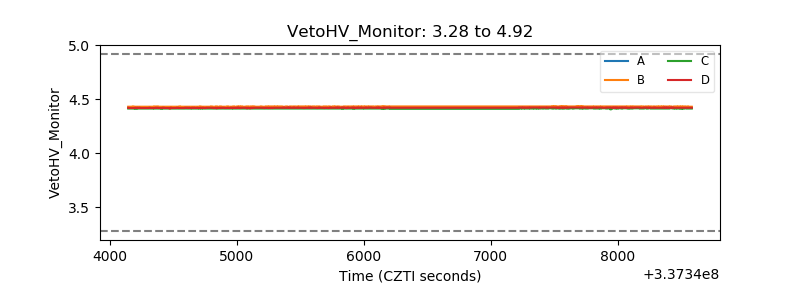 |
| Veto LLD | 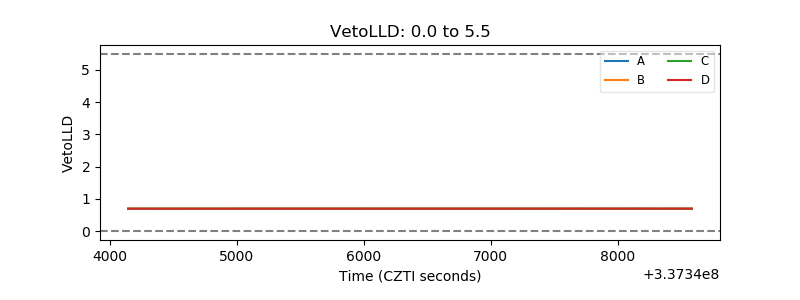 |
| Alpha Counter | 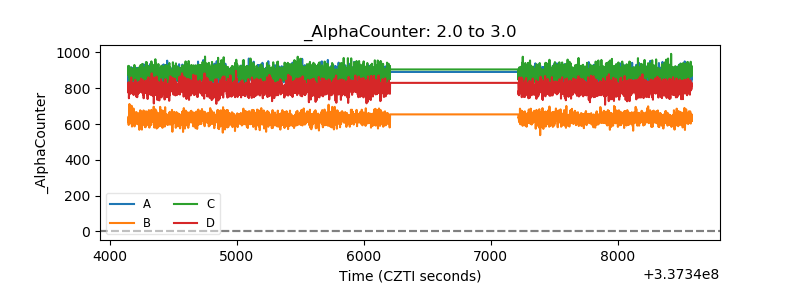 |
| _CPM_Rate | 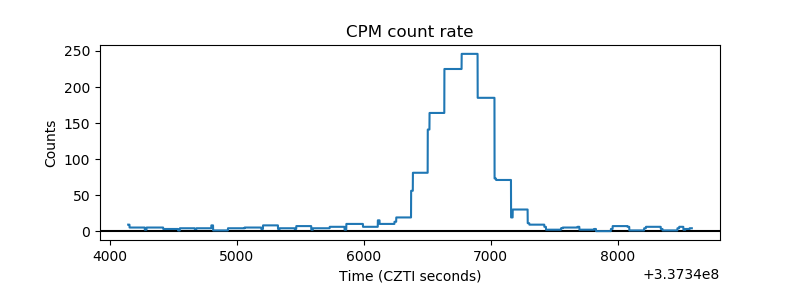 |
| CZT Counter | 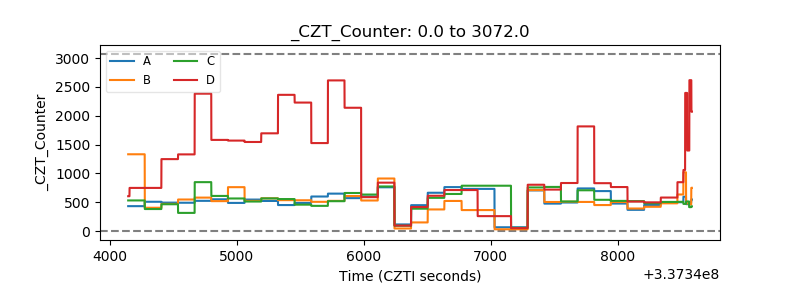 |
| +2.5 Volts monitor |  |
| +5 Volts monitor |  |
| _ROLL_ROT | 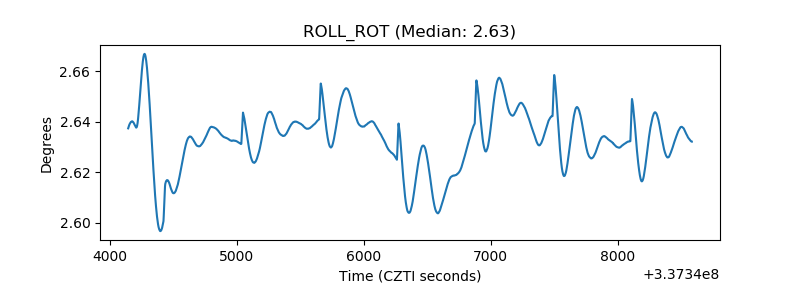 |
| _Roll_DEC | 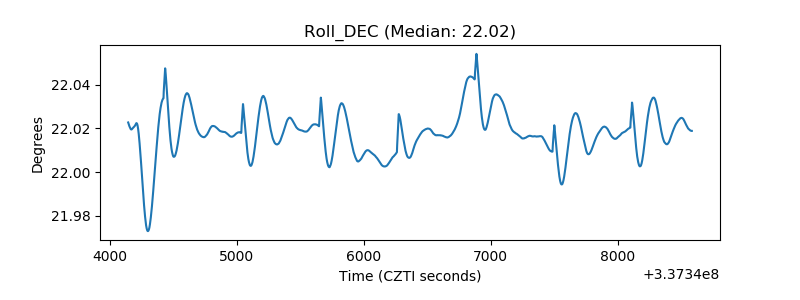 |
| _Roll_RA | 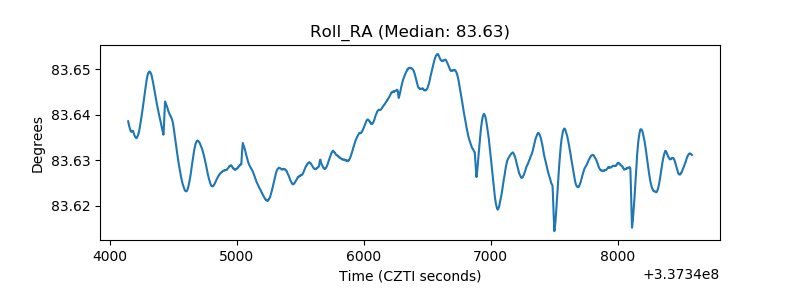 |
| Veto Counter | 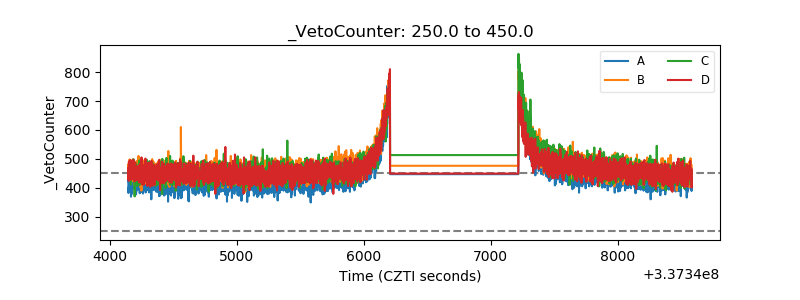 |