| Param | Original file | Final file |
|---|---|---|
| Filename | modeM0/AS1A09_145T01_9000003854_26768cztM0_level2.fits | modeM0/AS1A09_145T01_9000003854_26768cztM0_level2_quad_clean.evt |
| Size (bytes) | 702,072,000 | 86,837,760 |
| Size | 669.5 MB | 82.8 MB |
| Events in quadrant A | 4,621,012 | 551,010 |
| Events in quadrant B | 7,126,723 | 557,342 |
| Events in quadrant C | 3,798,387 | 536,537 |
| Events in quadrant D | 9,863,633 | 464,680 |
| Mode M0 | |||
|---|---|---|---|
| Quadrant | BADHDUFLAG | Total packets | Discarded packets |
| A | 0 | 18324 | 1 |
| B | 0 | 25763 | 1 |
| C | 0 | 15644 | 1 |
| D | 0 | 34522 | 1 |
| Mode SS | |||
|---|---|---|---|
| Quadrant | BADHDUFLAG | Total packets | Discarded packets |
| A | 0 | 152 | 0 |
| B | 0 | 152 | 0 |
| C | 0 | 152 | 0 |
| D | 0 | -1 | -1 |
| Mode M9 | |||
|---|---|---|---|
| Quadrant | BADHDUFLAG | Total packets | Discarded packets |
| A | 0 | 3 | 0 |
| B | 0 | 3 | 0 |
| C | 0 | 3 | 0 |
| D | 0 | 3 | 0 |
| Quadrant | Total seconds | Saturated seconds | Saturation percentage |
|---|---|---|---|
| A | 7466 | 259 | 3.469060% |
| B | 7467 | 1239 | 16.593009% |
| C | 7467 | 168 | 2.249900% |
| D | 7466 | 1964 | 26.305920% |
Noise dominated data is calculated using 1-second bins in cleaned event files. If a bin has >2000 counts, and if more than 50% of those come from <1% of pixels, then it is considered to be noise-dominated and hence unusable.
| Quadrant | # 1 sec bins | Bins with >0 counts | Bins with >2000 counts | High rate bins dominated by noise | Noise dominated (total time) | Noise dominated (detector-on time) | Marked lightcurve |
|---|---|---|---|---|---|---|---|
| A | 7756 | 7467 | 109 | 109 | 1.41% | 1.46% | 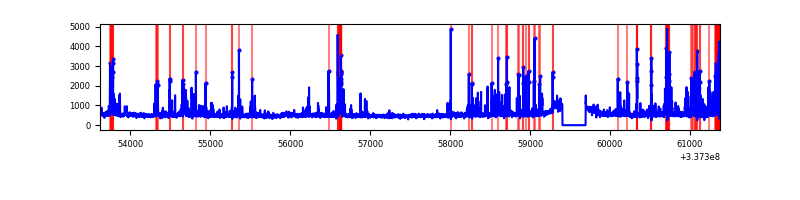 |
| B | 7757 | 7468 | 984 | 984 | 12.69% | 13.18% | 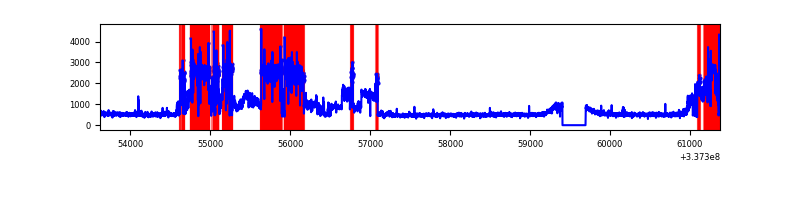 |
| C | 7757 | 7468 | 0 | 0 | 0.00% | 0.00% | 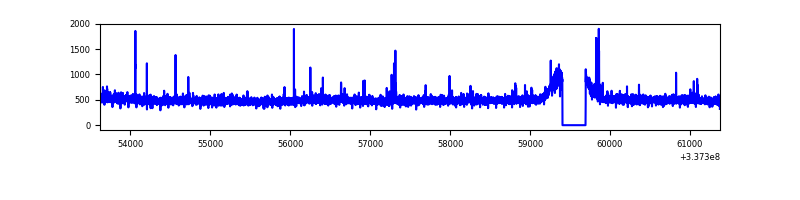 |
| D | 7755 | 7466 | 1499 | 1499 | 19.33% | 20.08% | 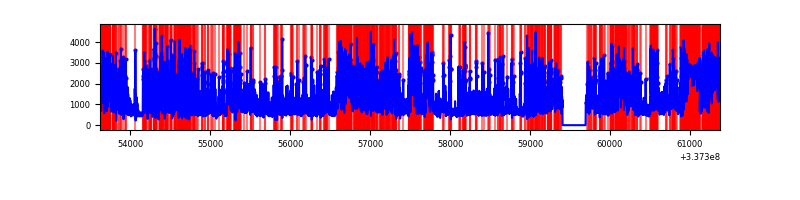 |
Top three noisy pixels from each quadrant. If the there are fewer than three noisy pixels in the level2.evt file, extra rows are filled as -1
| Pixel properties | Quadrant properties | ||||||
|---|---|---|---|---|---|---|---|
| Quadrant | DetID | PixID | Counts | Sigma | Mean | Median | Sigma |
| A | 0 | 13 | 471767 | 2439.41 | 955 | 937 | 193.0 |
| A | 12 | 96 | 439967 | 2274.65 | 955 | 937 | 193.0 |
| A | 13 | 34 | 20252 | 100.07 | 955 | 937 | 193.0 |
| B | 0 | 189 | 3652073 | 21371.82 | 879 | 858 | 170.8 |
| B | 12 | 111 | 20459 | 114.73 | 879 | 858 | 170.8 |
| B | 11 | 111 | 18163 | 101.29 | 879 | 858 | 170.8 |
| C | 14 | 238 | 146285 | 673.3 | 916 | 923 | 215.9 |
| C | 2 | 16 | 32560 | 146.54 | 916 | 923 | 215.9 |
| C | 15 | 208 | 24479 | 109.11 | 916 | 923 | 215.9 |
| D | 7 | 80 | 5512838 | 27560.55 | 826 | 809 | 200.0 |
| D | 1 | 52 | 740905 | 3700.53 | 826 | 809 | 200.0 |
| D | 2 | 250 | 271602 | 1353.98 | 826 | 809 | 200.0 |
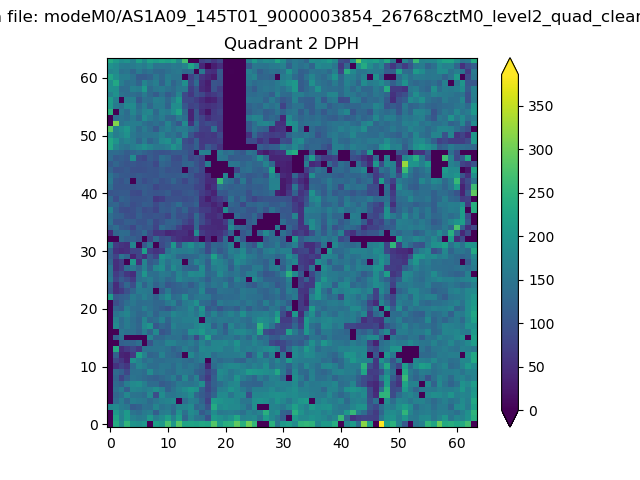
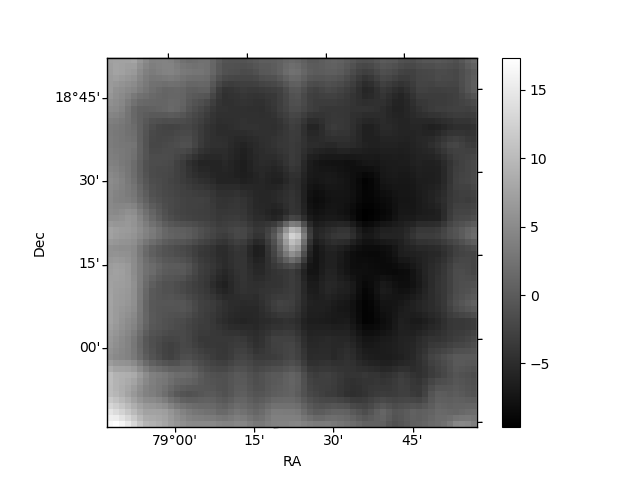
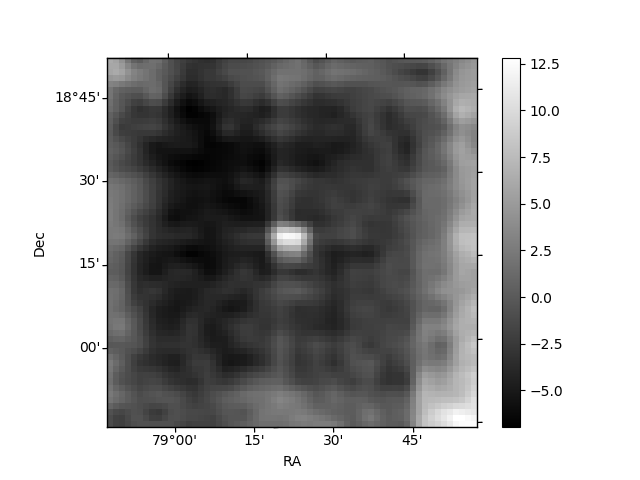
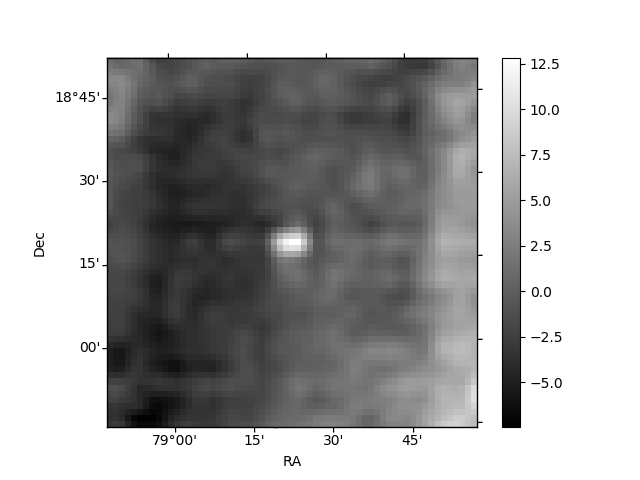
Histogram calculated using DETX and DETY for each event in the final _common_clean file
| Quadrant A | 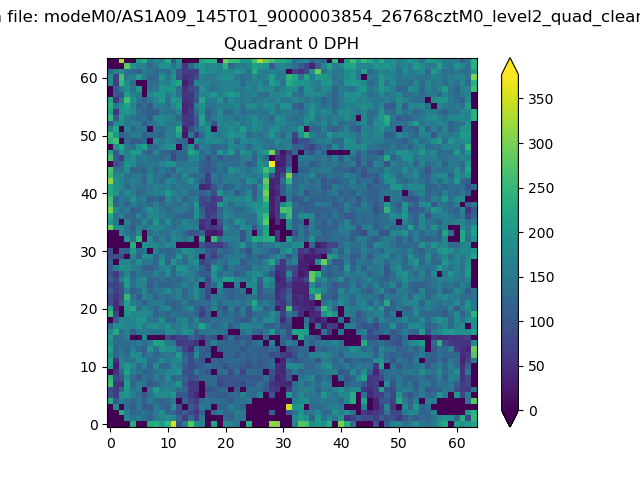 |
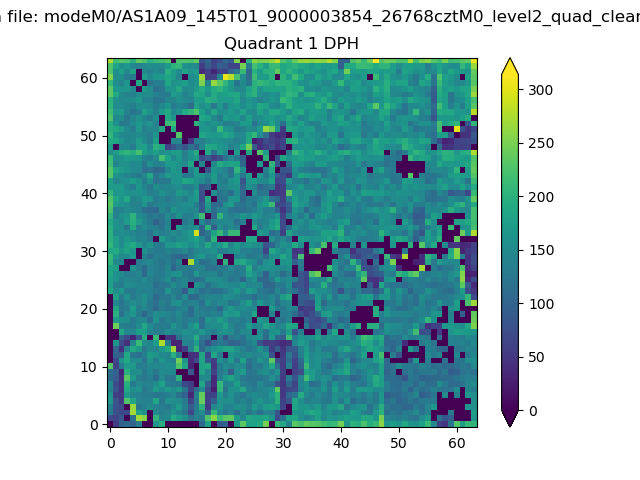 |
Quadrant B |
|---|---|---|---|
| Quadrant D | 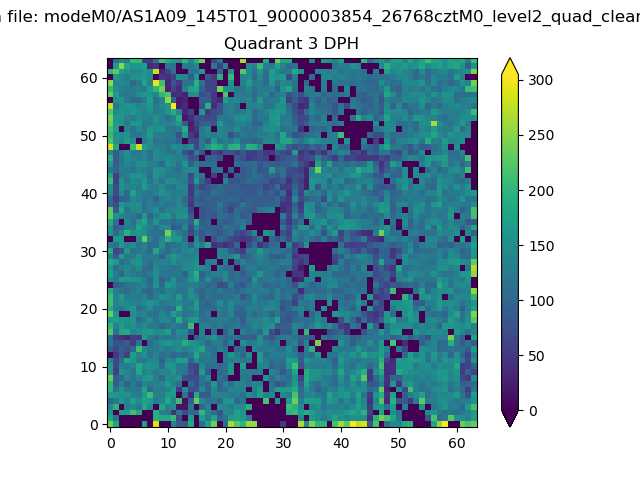 |
 |
Quadrant C |
| Plot type | Count rate plots | Images |
|---|---|---|
| Comparison with Poisson distribution Blue bars denote a histogram of data divided into 1 sec bins. Red curve is a Poisson curve with rate = median count rate of data. |
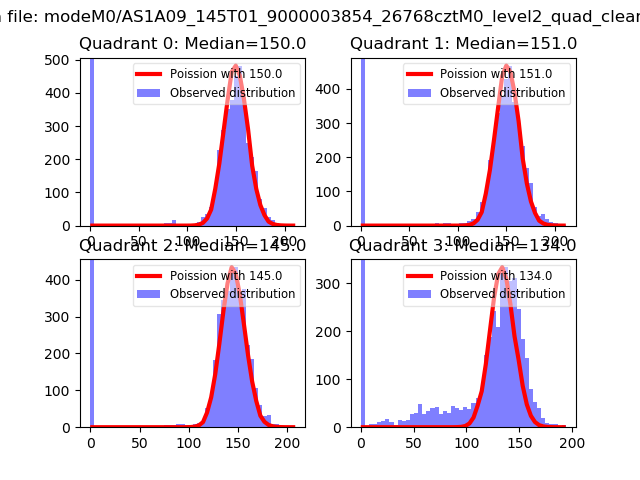 |
 |
| Quadrant-wise count rates Data is divided into 100 sec bins |
 |
|
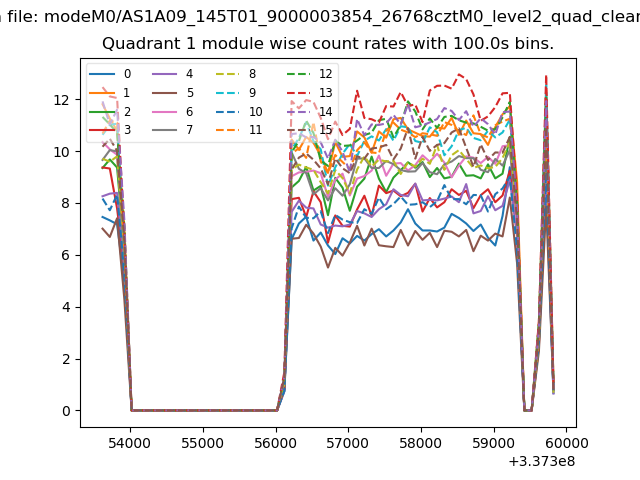
| Module-wise count rates for Quadrant A Data is divided into 100 sec bins |
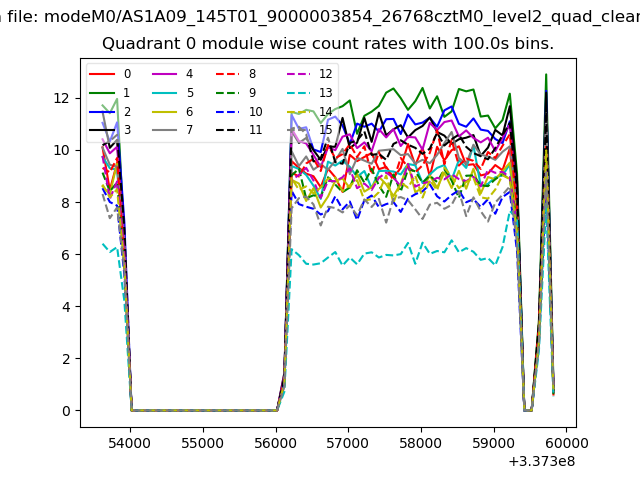 |
 |
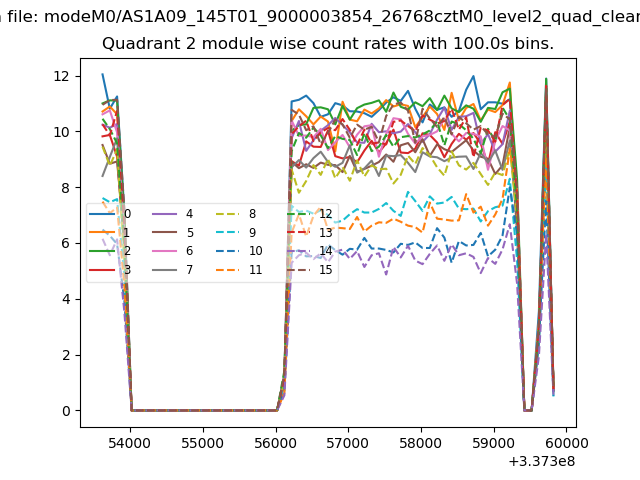
| Module-wise count rates for Quadrant B Data is divided into 100 sec bins |
 |
 |
| Module-wise count rates for Quadrant C Data is divided into 100 sec bins |
 |
 |
| Module-wise count rates for Quadrant D Data is divided into 100 sec bins |
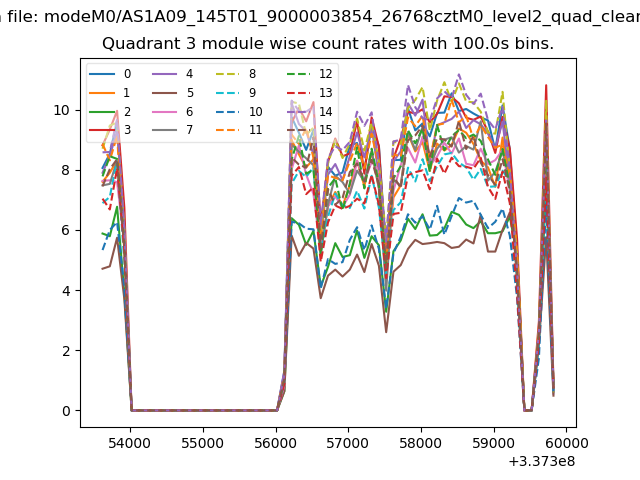 |
 |
| Parameter | Plot |
|---|---|
| CZT HV Monitor | 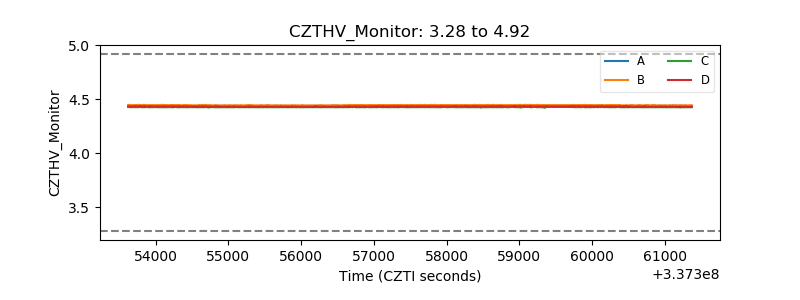 |
| D_VDD | 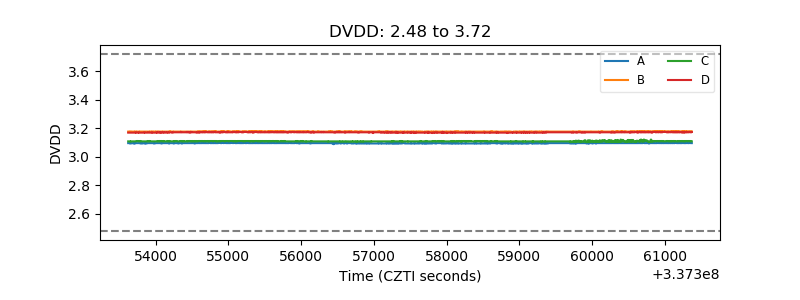 |
| Temperature 1 | 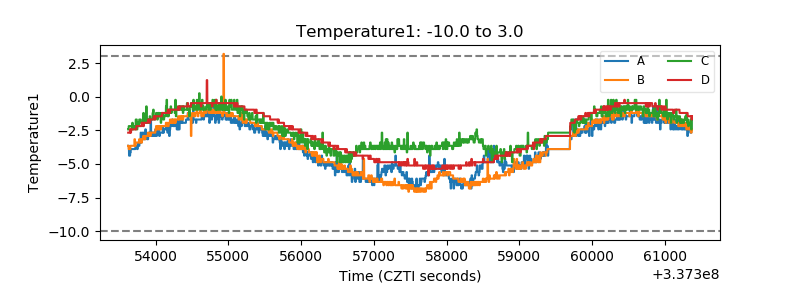 |
| Veto HV Monitor |  |
| Veto LLD | 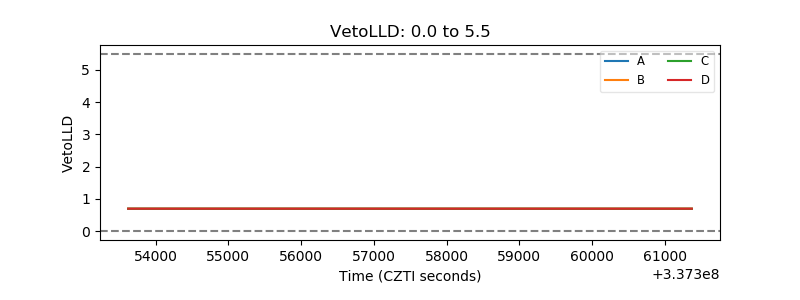 |
| Alpha Counter | 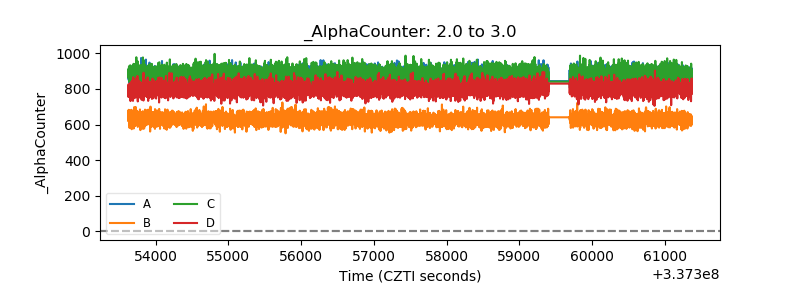 |
| _CPM_Rate | 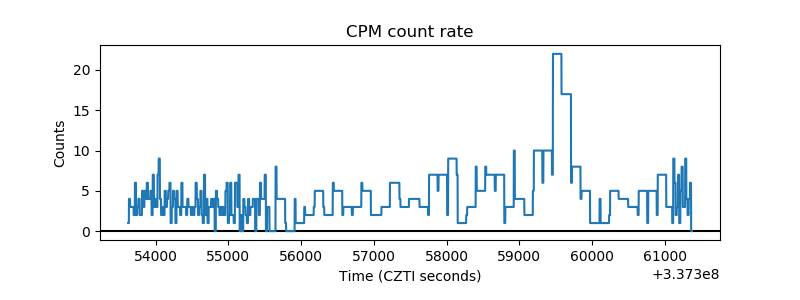 |
| CZT Counter | 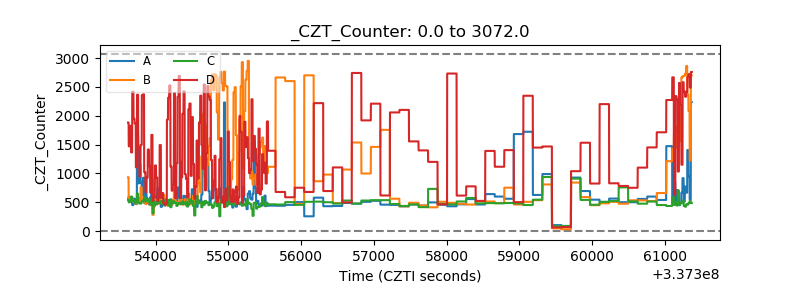 |
| +2.5 Volts monitor | 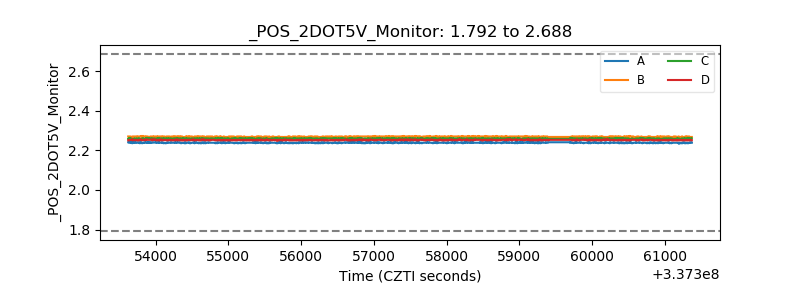 |
| +5 Volts monitor |  |
| _ROLL_ROT | 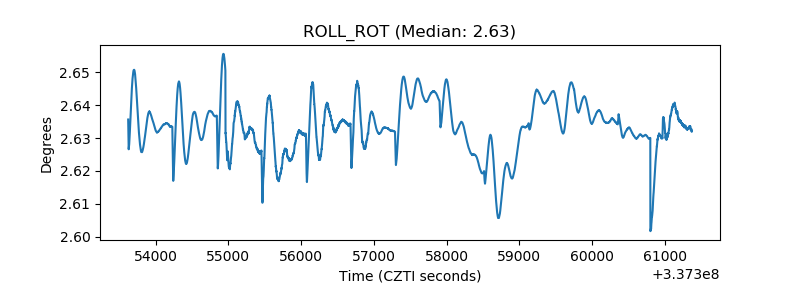 |
| _Roll_DEC | 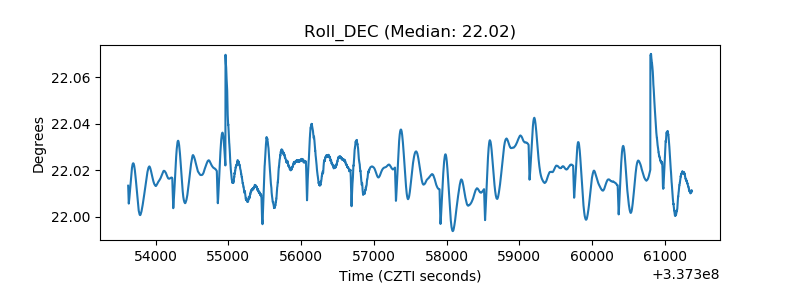 |
| _Roll_RA | 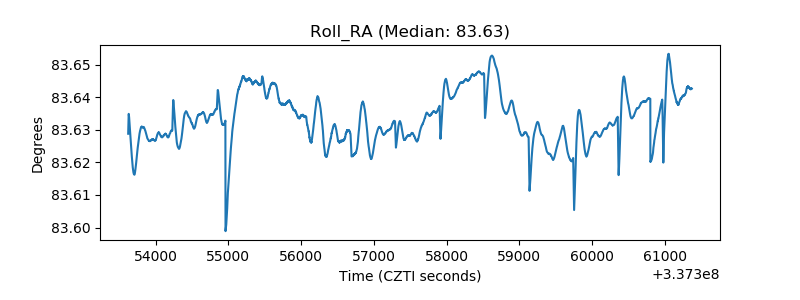 |
| Veto Counter | 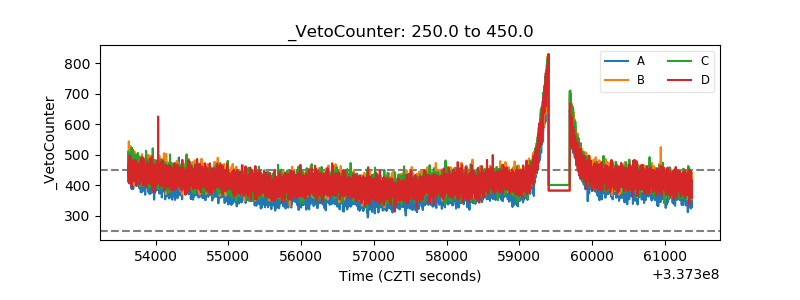 |