| Param | Original file | Final file |
|---|---|---|
| Filename | modeM0/AS1A09_145T01_9000003854_26769cztM0_level2.fits | modeM0/AS1A09_145T01_9000003854_26769cztM0_level2_quad_clean.evt |
| Size (bytes) | 424,169,280 | 61,516,800 |
| Size | 404.5 MB | 58.7 MB |
| Events in quadrant A | 2,379,919 | 484,472 |
| Events in quadrant B | 3,781,455 | 423,562 |
| Events in quadrant C | 1,955,374 | 468,786 |
| Events in quadrant D | 7,282,562 | 212,010 |
| Mode M0 | |||
|---|---|---|---|
| Quadrant | BADHDUFLAG | Total packets | Discarded packets |
| A | 0 | 9542 | 1 |
| B | 0 | 13684 | 1 |
| C | 0 | 8127 | 1 |
| D | 0 | 24301 | 1 |
| Mode SS | |||
|---|---|---|---|
| Quadrant | BADHDUFLAG | Total packets | Discarded packets |
| A | 0 | 78 | 0 |
| B | 0 | 78 | 0 |
| C | 0 | 78 | 0 |
| D | 0 | 78 | 0 |
| Quadrant | Total seconds | Saturated seconds | Saturation percentage |
|---|---|---|---|
| A | 3874 | 121 | 3.123387% |
| B | 3875 | 702 | 18.116129% |
| C | 3875 | 38 | 0.980645% |
| D | 3875 | 2192 | 56.567742% |
Noise dominated data is calculated using 1-second bins in cleaned event files. If a bin has >2000 counts, and if more than 50% of those come from <1% of pixels, then it is considered to be noise-dominated and hence unusable.
| Quadrant | # 1 sec bins | Bins with >0 counts | Bins with >2000 counts | High rate bins dominated by noise | Noise dominated (total time) | Noise dominated (detector-on time) | Marked lightcurve |
|---|---|---|---|---|---|---|---|
| A | 3874 | 3874 | 68 | 68 | 1.76% | 1.76% | 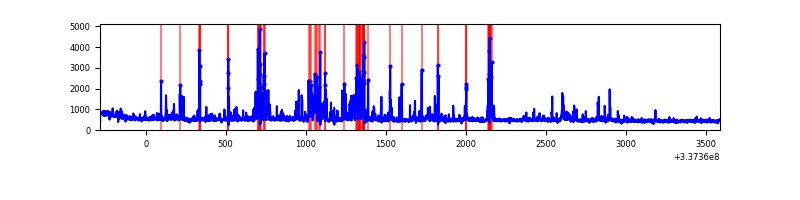 |
| B | 3875 | 3875 | 616 | 616 | 15.90% | 15.90% | 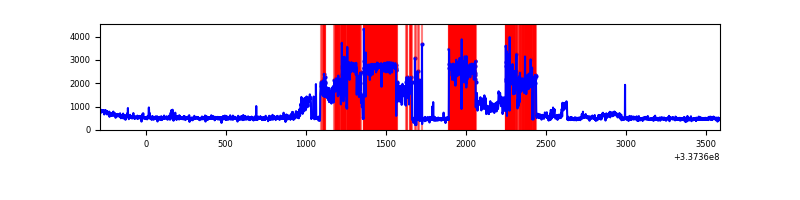 |
| C | 3875 | 3875 | 5 | 5 | 0.13% | 0.13% | 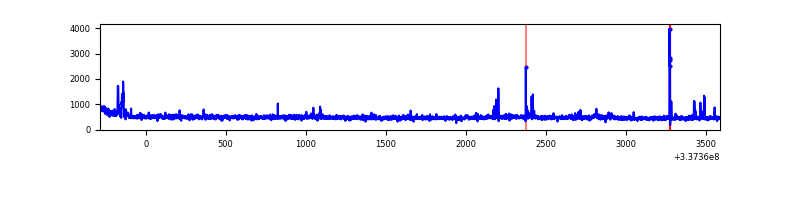 |
| D | 3875 | 3875 | 1898 | 1898 | 48.98% | 48.98% | 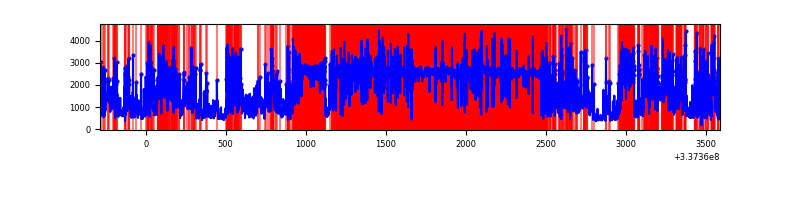 |
Top three noisy pixels from each quadrant. If the there are fewer than three noisy pixels in the level2.evt file, extra rows are filled as -1
| Pixel properties | Quadrant properties | ||||||
|---|---|---|---|---|---|---|---|
| Quadrant | DetID | PixID | Counts | Sigma | Mean | Median | Sigma |
| A | 12 | 96 | 430557 | 4420.41 | 476 | 467 | 97.3 |
| A | 0 | 13 | 111719 | 1143.43 | 476 | 467 | 97.3 |
| A | 13 | 254 | 6848 | 65.58 | 476 | 467 | 97.3 |
| B | 0 | 189 | 2070226 | 24335.16 | 434 | 424 | 85.1 |
| B | 12 | 111 | 9883 | 111.21 | 434 | 424 | 85.1 |
| B | 11 | 111 | 8755 | 97.95 | 434 | 424 | 85.1 |
| C | 14 | 238 | 74441 | 678.16 | 459 | 462 | 109.1 |
| C | 15 | 208 | 32600 | 294.61 | 459 | 462 | 109.1 |
| C | 10 | 22 | 26578 | 239.4 | 459 | 462 | 109.1 |
| D | 7 | 80 | 5682383 | 73612.17 | 309 | 302 | 77.2 |
| D | 2 | 250 | 215149 | 2783.37 | 309 | 302 | 77.2 |
| D | 1 | 52 | 160862 | 2080.08 | 309 | 302 | 77.2 |
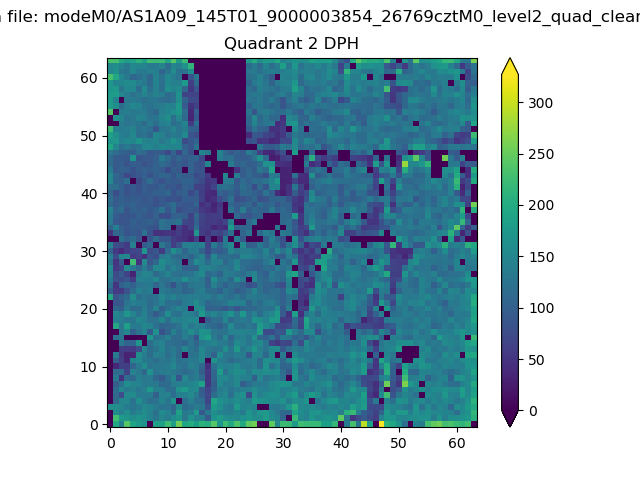
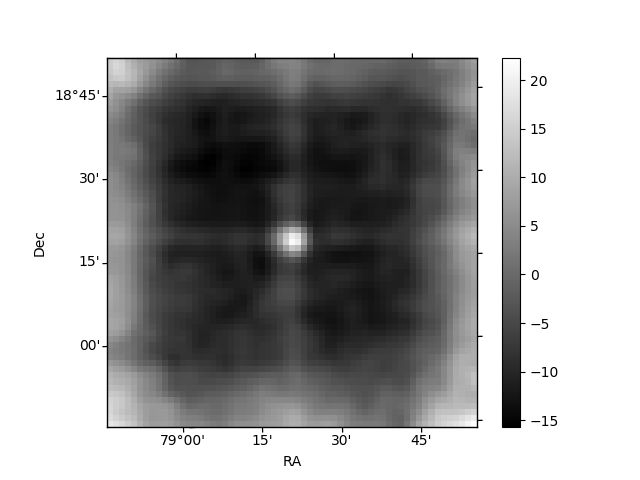
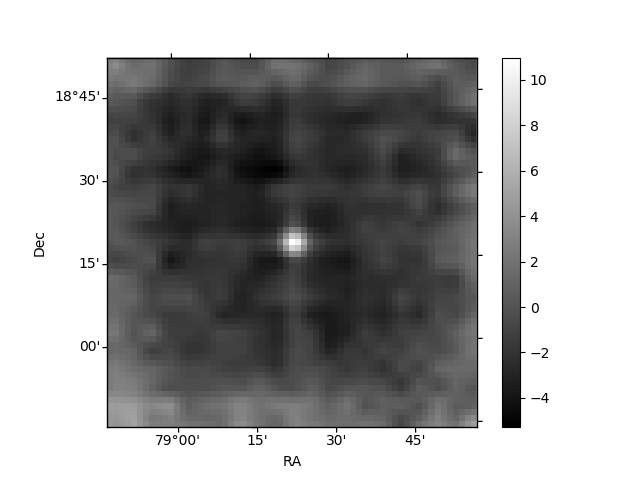
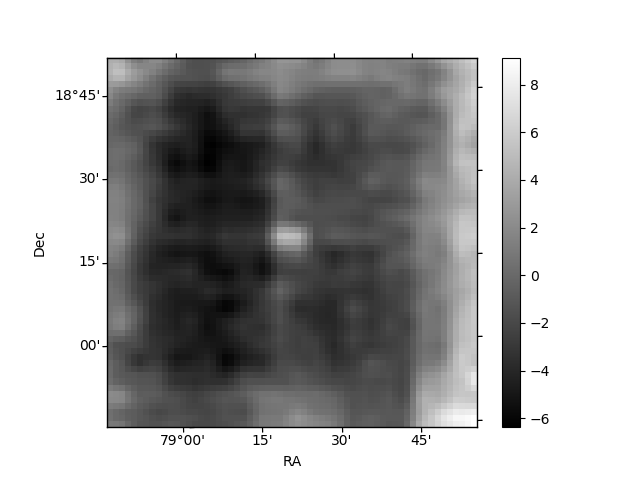
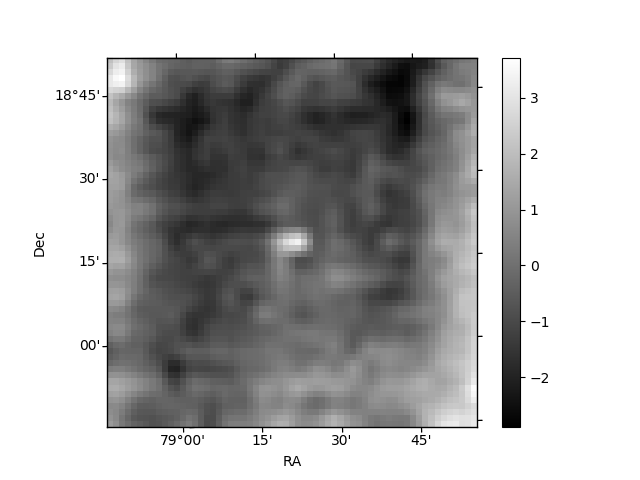
Histogram calculated using DETX and DETY for each event in the final _common_clean file
| Quadrant A | 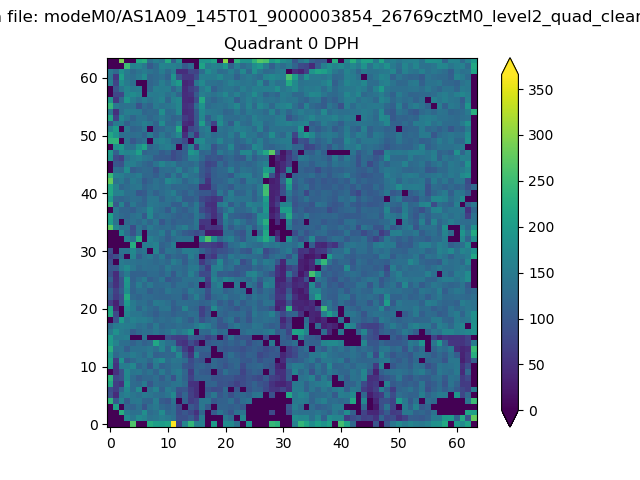 |
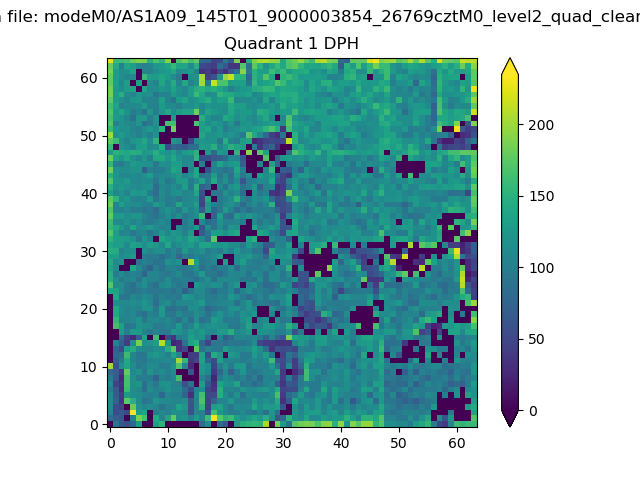 |
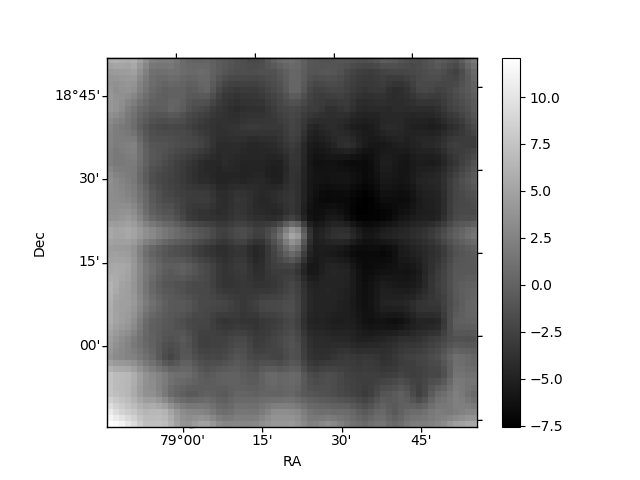
Quadrant B |
|---|---|---|---|
| Quadrant D | 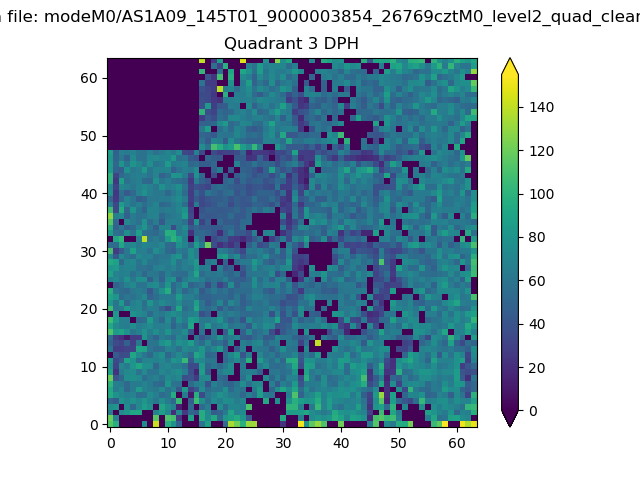 |
 |
Quadrant C |
| Plot type | Count rate plots | Images |
|---|---|---|
| Comparison with Poisson distribution Blue bars denote a histogram of data divided into 1 sec bins. Red curve is a Poisson curve with rate = median count rate of data. |
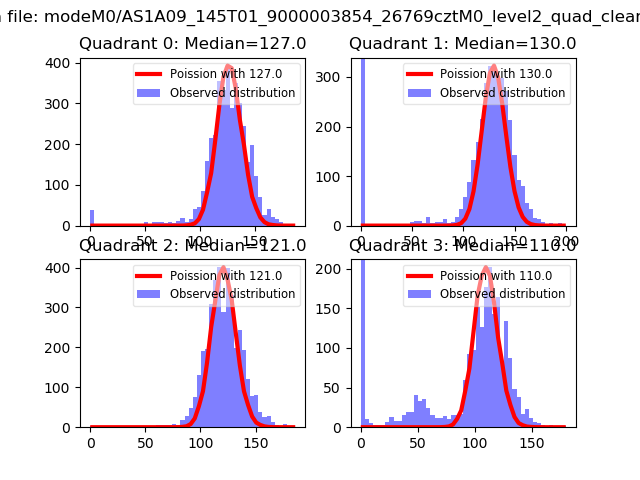 |
 |
| Quadrant-wise count rates Data is divided into 100 sec bins |
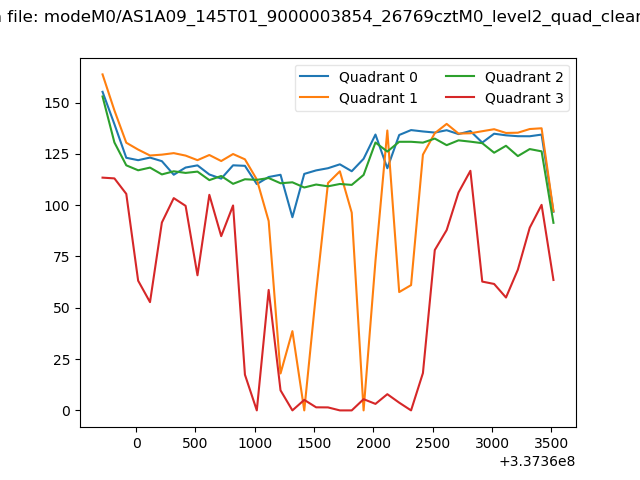 |
|
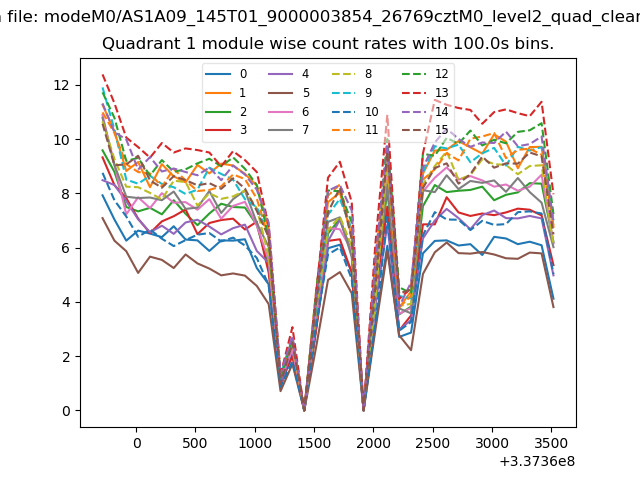
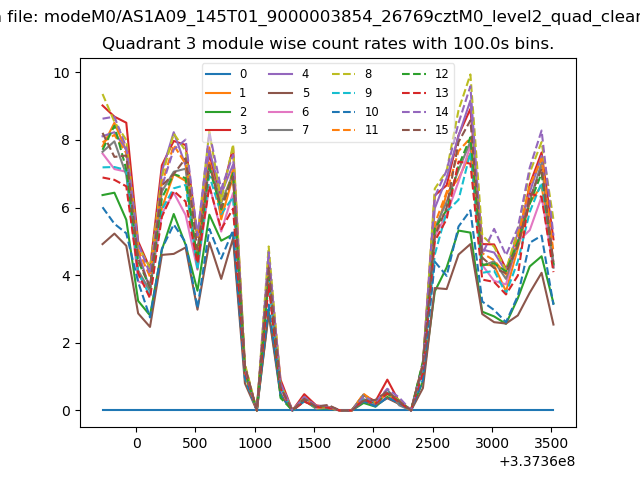
| Module-wise count rates for Quadrant A Data is divided into 100 sec bins |
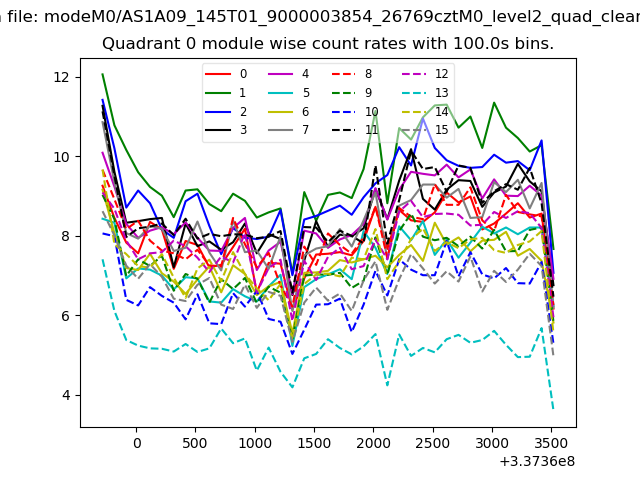 |
 |
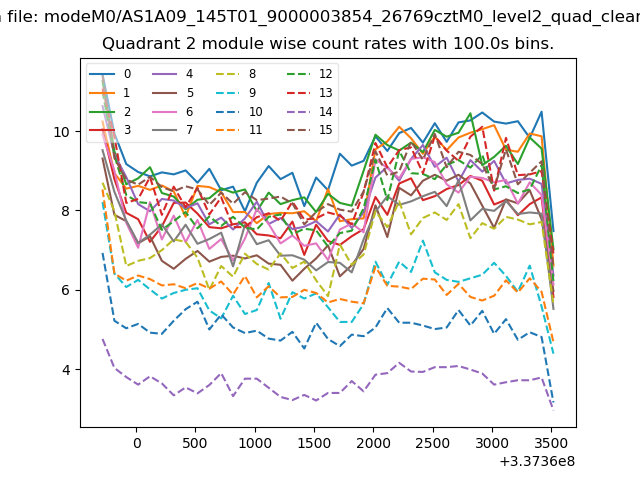
| Module-wise count rates for Quadrant B Data is divided into 100 sec bins |
 |
 |
| Module-wise count rates for Quadrant C Data is divided into 100 sec bins |
 |
 |
| Module-wise count rates for Quadrant D Data is divided into 100 sec bins |
 |
 |
| Parameter | Plot |
|---|---|
| CZT HV Monitor | 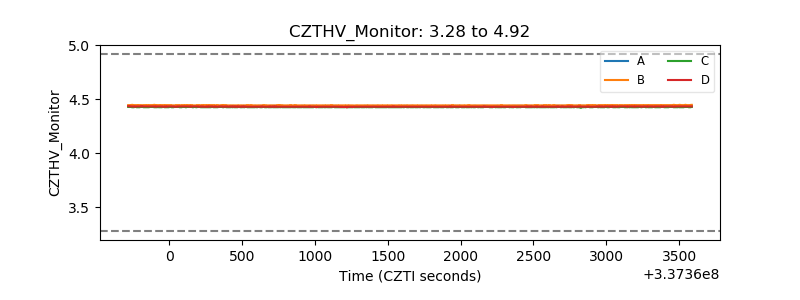 |
| D_VDD | 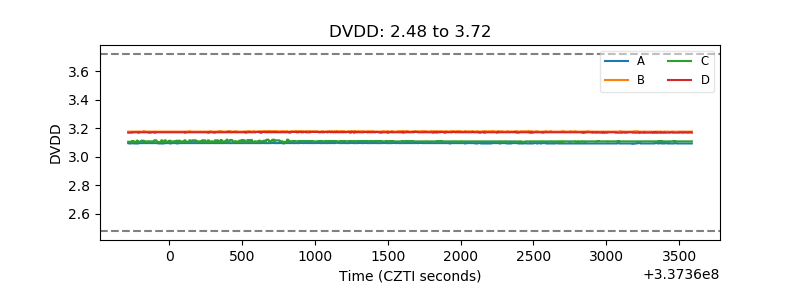 |
| Temperature 1 | 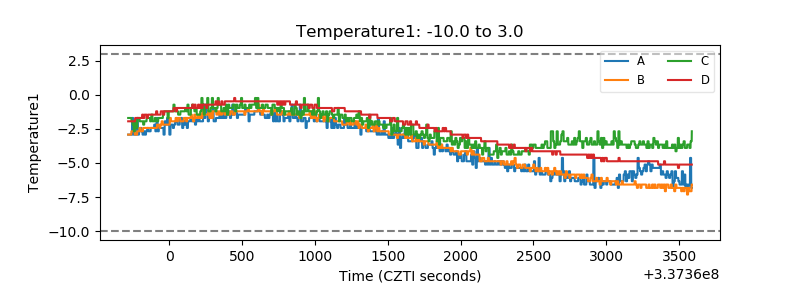 |
| Veto HV Monitor | 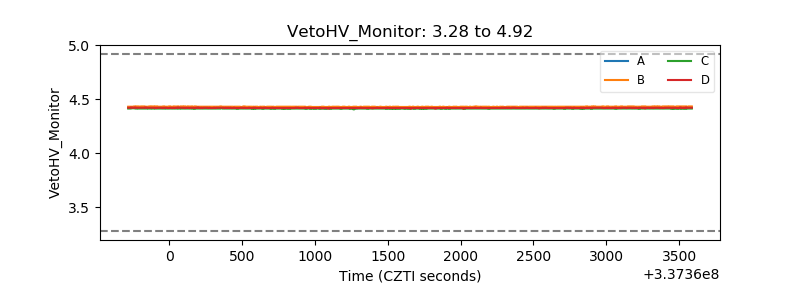 |
| Veto LLD | 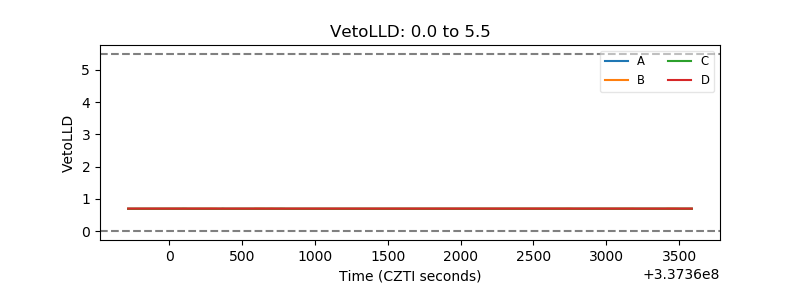 |
| Alpha Counter | 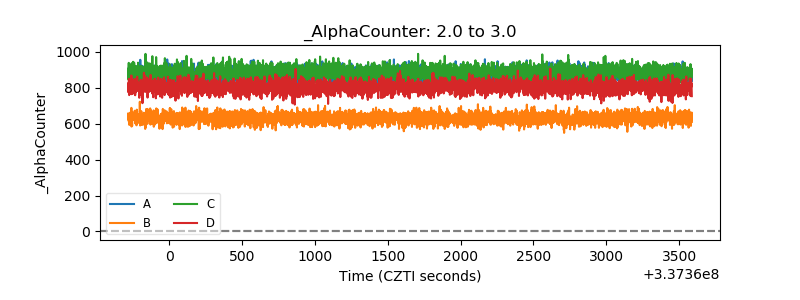 |
| _CPM_Rate | 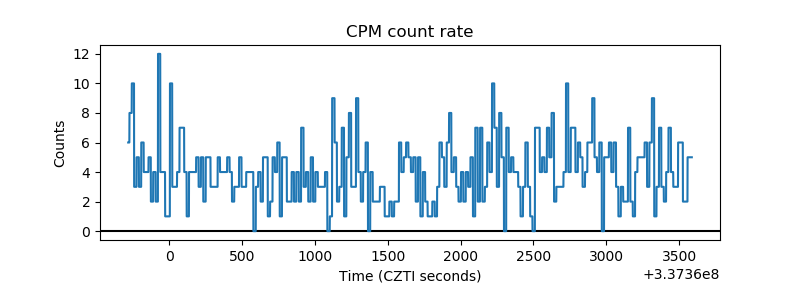 |
| CZT Counter | 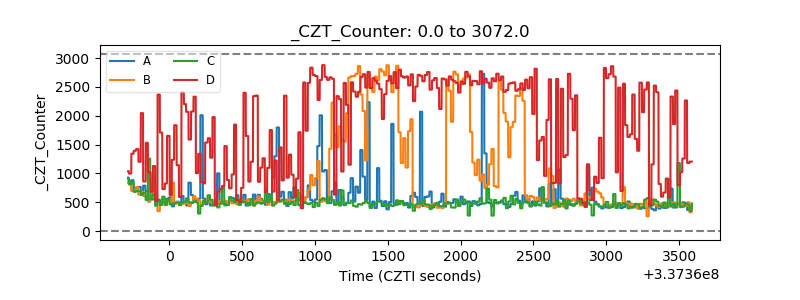 |
| +2.5 Volts monitor |  |
| +5 Volts monitor |  |
| _ROLL_ROT | 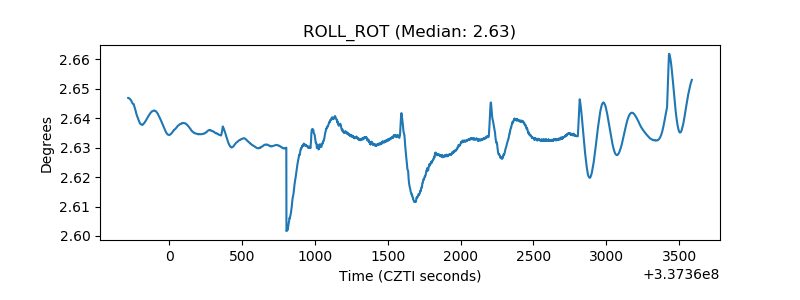 |
| _Roll_DEC | 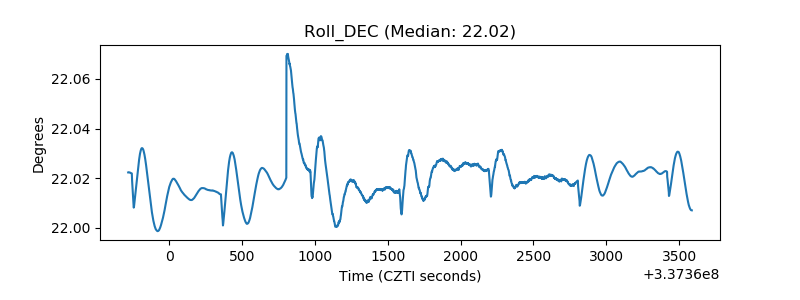 |
| _Roll_RA |  |
| Veto Counter |  |