| Param | Original file | Final file |
|---|---|---|
| Filename | modeM0/AS1A07_027T01_9000003862cztM0_level2.fits | modeM0/AS1A07_027T01_9000003862cztM0_level2_quad_clean.evt |
| Size (bytes) | 286,534,080 | 117,662,400 |
| Size | 273.3 MB | 112.2 MB |
| Events in quadrant A | 1,876,290 | 497,638 |
| Events in quadrant B | 1,613,834 | 374,124 |
| Events in quadrant C | 1,848,898 | 487,739 |
| Events in quadrant D | 1,502,170 | 368,555 |
| Mode M0 | |||
|---|---|---|---|
| Quadrant | BADHDUFLAG | Total packets | Discarded packets |
| A | 0 | 69594 | 0 |
| B | 0 | 96826 | 0 |
| C | 0 | 61801 | 0 |
| D | 0 | 111903 | 0 |
| Mode SS | |||
|---|---|---|---|
| Quadrant | BADHDUFLAG | Total packets | Discarded packets |
| A | 0 | 544 | 0 |
| B | 0 | 544 | 0 |
| C | 0 | 544 | 0 |
| D | 0 | 544 | 0 |
| Mode M9 | |||
|---|---|---|---|
| Quadrant | BADHDUFLAG | Total packets | Discarded packets |
| A | 0 | 63 | 0 |
| B | 0 | 63 | 0 |
| C | 0 | 63 | 0 |
| D | 0 | 63 | 0 |
| Quadrant | Total seconds | Saturated seconds | Saturation percentage |
|---|---|---|---|
| A | 26636 | 302 | 1.133804% |
| B | 26636 | 5918 | 22.218051% |
| C | 26636 | 768 | 2.883316% |
| D | 26636 | 4823 | 18.107073% |
Noise dominated data is calculated using 1-second bins in cleaned event files. If a bin has >2000 counts, and if more than 50% of those come from <1% of pixels, then it is considered to be noise-dominated and hence unusable.
| Quadrant | # 1 sec bins | Bins with >0 counts | Bins with >2000 counts | High rate bins dominated by noise | Noise dominated (total time) | Noise dominated (detector-on time) | Marked lightcurve |
|---|---|---|---|---|---|---|---|
| A | 32906 | 26636 | 0 | 0 | 0.00% | 0.00% |  |
| B | 32906 | 26598 | 0 | 0 | 0.00% | 0.00% | 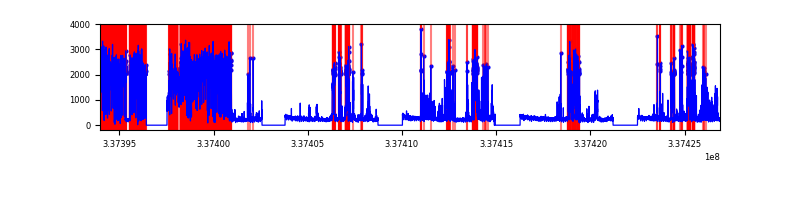 |
| C | 32906 | 26635 | 0 | 0 | 0.00% | 0.00% | 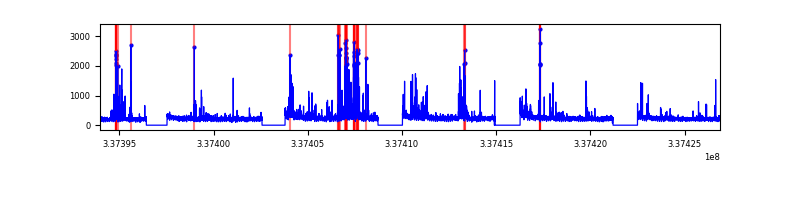 |
| D | 32906 | 26612 | 0 | 0 | 0.00% | 0.00% |  |
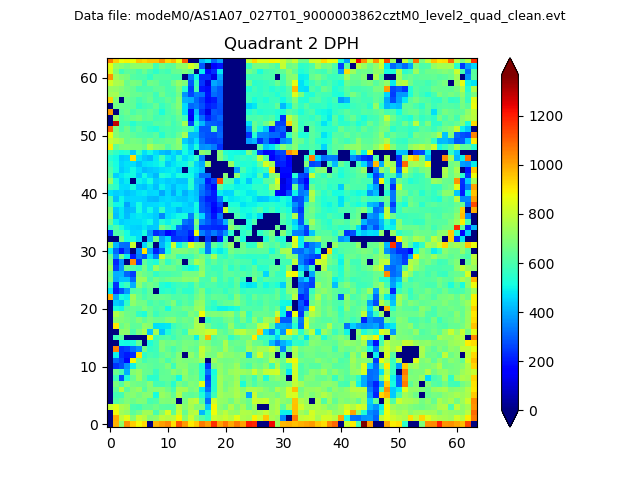
Top three noisy pixels from each quadrant. If the there are fewer than three noisy pixels in the level2.evt file, extra rows are filled as -1
| Pixel properties | Quadrant properties | ||||||
|---|---|---|---|---|---|---|---|
| Quadrant | DetID | PixID | Counts | Sigma | Mean | Median | Sigma |
| A | 0 | 29 | 1482 | 8.48 | 490 | 465 | 120.0 |
| A | 7 | 110 | 1416 | 7.93 | 490 | 465 | 120.0 |
| A | 9 | 19 | 1346 | 7.34 | 490 | 465 | 120.0 |
| B | 2 | 9 | 1275 | 10.23 | 427 | 411 | 84.4 |
| B | 5 | 128 | 1086 | 8.0 | 427 | 411 | 84.4 |
| B | 2 | 8 | 1077 | 7.89 | 427 | 411 | 84.4 |
| C | 1 | 81 | 1497 | 8.44 | 488 | 463 | 122.5 |
| C | 1 | 80 | 1422 | 7.83 | 488 | 463 | 122.5 |
| C | 3 | 126 | 1315 | 6.96 | 488 | 463 | 122.5 |
| D | 10 | 189 | 1147 | 6.67 | 429 | 394 | 113.0 |
| D | 6 | 231 | 1102 | 6.27 | 429 | 394 | 113.0 |
| D | 6 | 67 | 1089 | 6.15 | 429 | 394 | 113.0 |
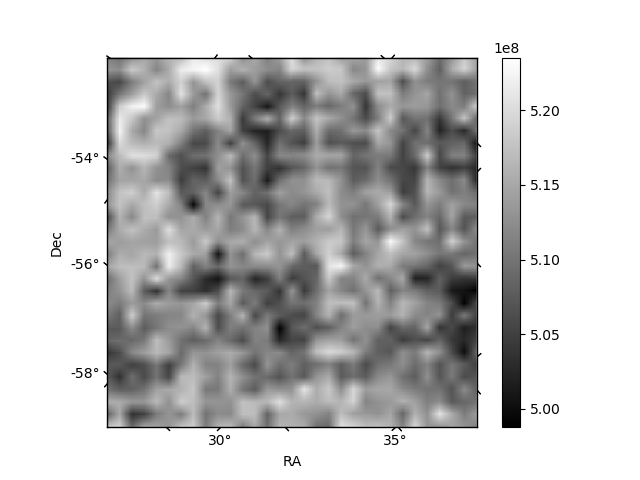
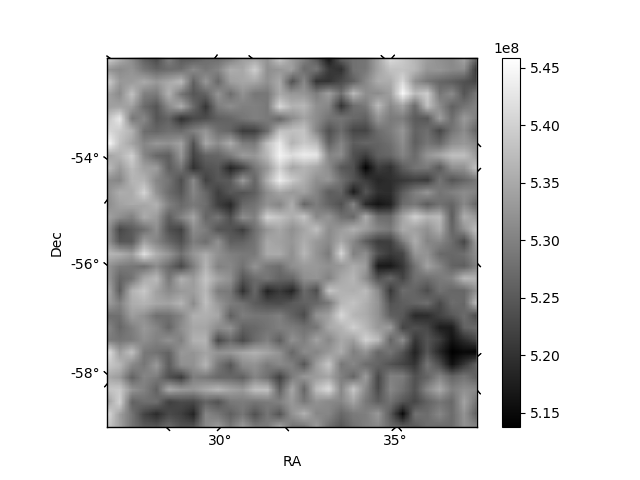
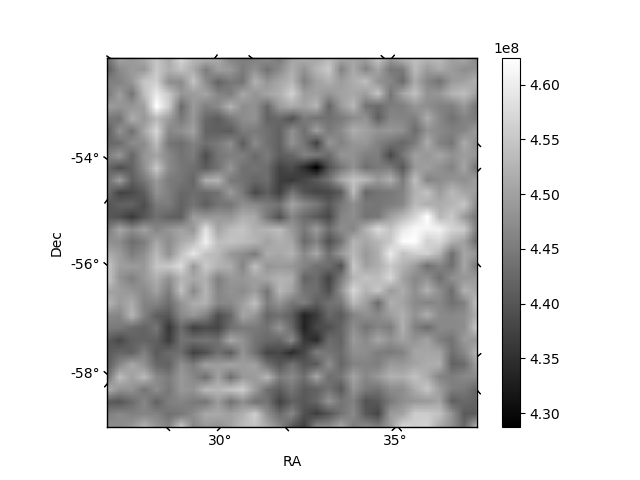
Histogram calculated using DETX and DETY for each event in the final _common_clean file
| Quadrant A |  |
 |
Quadrant B |
|---|---|---|---|
| Quadrant D |  |
 |
Quadrant C |
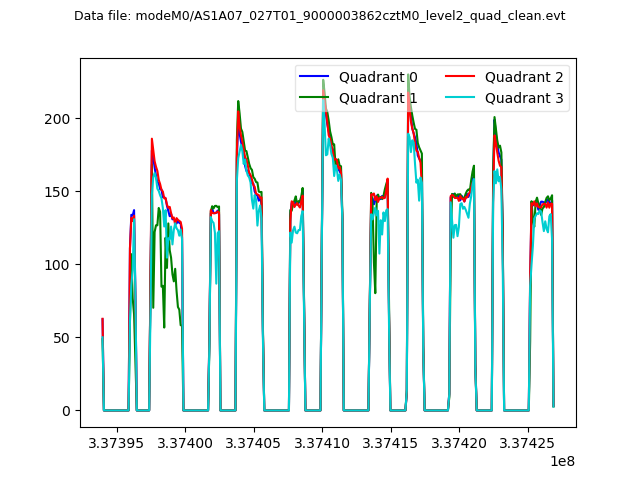
| Plot type | Count rate plots | Images |
|---|---|---|
| Comparison with Poisson distribution Blue bars denote a histogram of data divided into 1 sec bins. Red curve is a Poisson curve with rate = median count rate of data. |
 |
 |
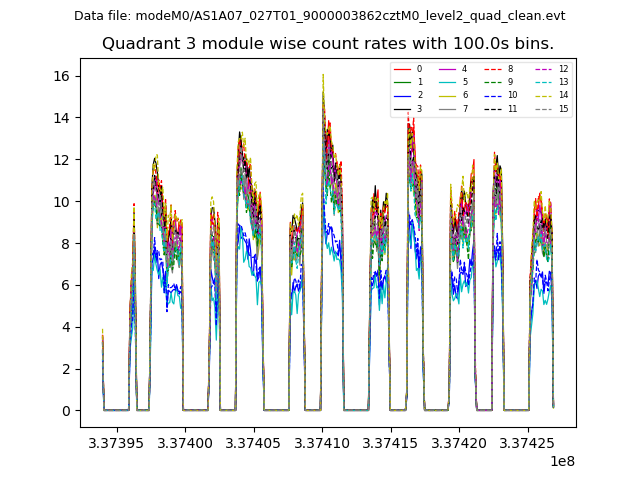
| Quadrant-wise count rates Data is divided into 100 sec bins |
 |
|
| Module-wise count rates for Quadrant A Data is divided into 100 sec bins |
 |
 |
| Module-wise count rates for Quadrant B Data is divided into 100 sec bins |
 |
 |
| Module-wise count rates for Quadrant C Data is divided into 100 sec bins |
 |
 |
| Module-wise count rates for Quadrant D Data is divided into 100 sec bins |
 |
 |
| Parameter | Plot |
|---|---|
| CZT HV Monitor |  |
| D_VDD |  |
| Temperature 1 |  |
| Veto HV Monitor | 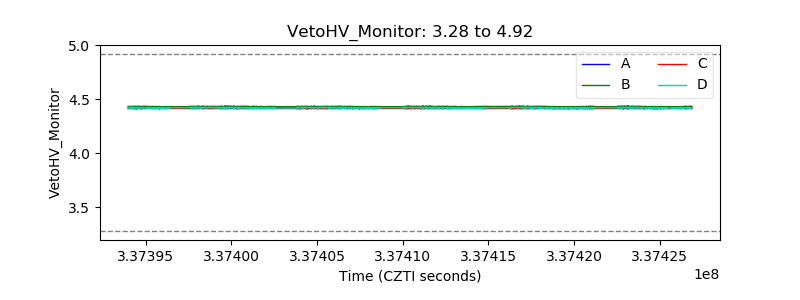 |
| Veto LLD | 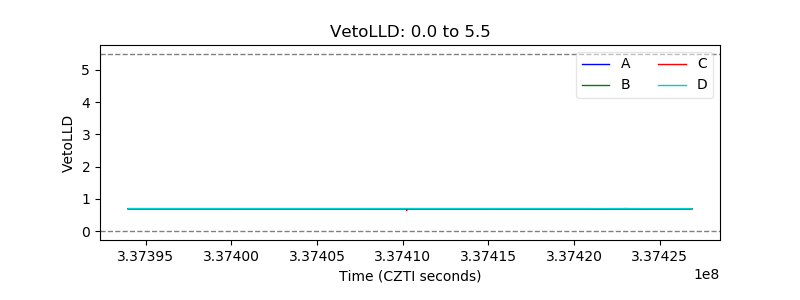 |
| Alpha Counter |  |
| _CPM_Rate | 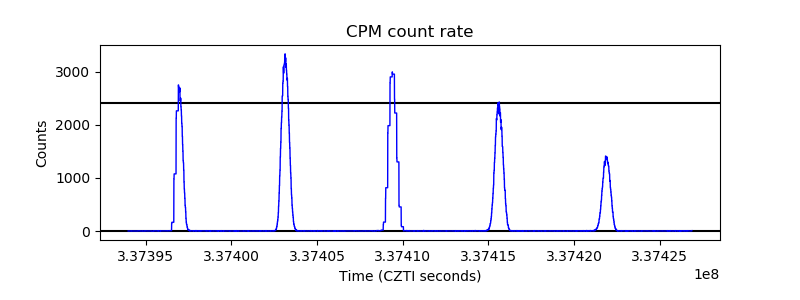 |
| CZT Counter | 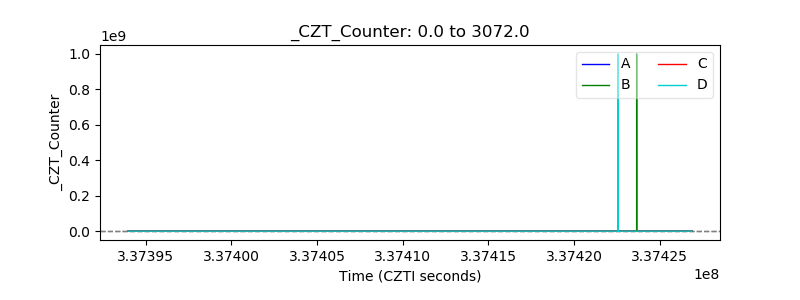 |
| +2.5 Volts monitor |  |
| +5 Volts monitor |  |
| _ROLL_ROT |  |
| _Roll_DEC |  |
| _Roll_RA | 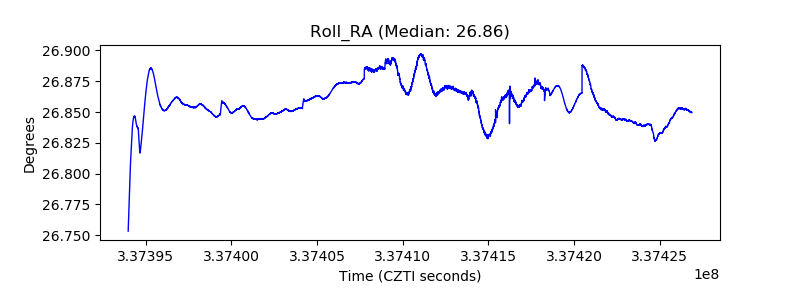 |
| Veto Counter |  |